Gold: Daily Range Retest Setting Up a Late-December BounceGold remains in a clear daily range, currently retesting a prior support zone. The broader trend is still upward, and with December carrying a moderately bullish seasonal bias, the final days of the month favour a potential push back toward the range highs.
Trade ideas
GOLD (XAUUSD): Bullish Continuation
There is a high probability that Gold will continue rising
after a confirmed breakout of a key intraday/daily resistance cluster.
Expect a move up at least to 4205
❤️Please, support my work with like, thank you!❤️
I am part of Trade Nation's Influencer program and receive a monthly fee for using their TradingView charts in my analysis.

Gold Price Poised for Breakout as Bullish Channel StrengthensHi!
Market Structure Overview
Price is moving within a clearly defined ascending channel, forming higher highs and higher lows. The recent pullback corrected only about 35% of the previous bullish leg, indicating that buyers are still in control and momentum remains positive.
Key Support Zone (Green Area 4,150–4,175)
This zone represents a former supply that has now flipped into a potential demand area. Price is currently pushing into it from below, and the reaction here will determine the next major move. A clean break and hold above this zone would signal strength and open the path toward higher targets.
Breakout Scenario
If price breaks above the green resistance block, the chart suggests a bullish continuation toward the major supply zone highlighted in red (4,220). The drawn arrow implies that momentum could accelerate once the breakout confirms, aligning with the channel’s upper boundary.
Upside Target (Red Zone 4,220)
This red area represents a strong supply where sellers previously stepped in aggressively. Should price reach this level again, some form of reaction or correction is likely.
Downside Risk
If the breakout fails and price rejects the green zone, a retracement back toward the mid-channel dashed line or even the lower channel boundary would be the next logical move.
Disclaimer: As part of ThinkMarkets’ Influencer Program, I am sponsored to share and publish their charts in my analysis.


XAUUSD H4 high probability is to break the previous high(XAUUSD H4)Let's Break Down this Chart👇
XAUUSD is following a Bullish trend line since October 28th ,And Yesterday market close Above a H4 Bearish OB that has become a Breaker.
And below, we see a strong H4 order block that was able to break the internal structure.
The volume profile shows us that it was at this level that the large orders were opened.
SENARIO 1 : XAUUSD retests the Breaker which could become a support and breaks the previous High.
SENARIO 2 : XAUUSD retests the H4 Order Block, which could act as support, and breaks the previous high.

Gold Buy SetupHi All,
Just small analysis for Gold - Entered buy from here and SL _ TP on the chart.
Please do your analysis before entering trade on my analysis (This is only for educational purposes).
Happy Trading
Green Pips To All

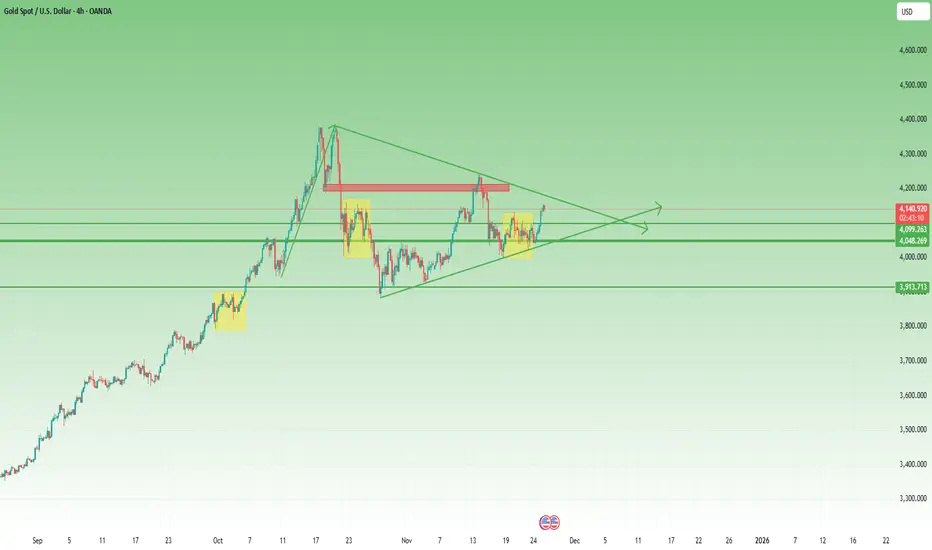
How to choose a direction at the end of a triangular formation#XAUUSD TVC:GOLD OANDA:XAUUSD
Although gold is still in a volatile market in the short term, its current trend has entered the end of a converging triangle pattern, and the market is getting closer to choosing a direction.
The market has recently been driven primarily by news, and the current geopolitical tensions, coupled with the stalled Russia-Ukraine peace talks, may trigger a new wave of risk aversion. Therefore, during the European session, we can consider going long on gold when it retraces to the 4040-4030 range.

XAUUSD – Quick Technical OutlookGold continues its steady climb and is now testing a major supply zone around 4,230–4,245. This area previously triggered strong rejection, making it a critical level for the next move.
If price breaks and holds above this zone, momentum could extend toward new highs. However, failure to clear resistance may lead to a pullback toward 4,180–4,160 before buyers attempt another push.
Market is bullish, but entering directly into supply requires caution.

How to Calculate Lot Size for Trading XAUUSD on TradingView
Very few people know that there is a free position size calculator for any trading instrument and, of course, for GOLD on TradingView.
It is absolutely free , it does not require a paid subscription, and it can be used to measure position size for XAUUSD trading for any account size, leverage and broker.
In this article, I will teach you how to calculate lot size for your XAUUSD trades in 3 simple steps.
Set It Up
The first step will be to simply create a free TradingView account.
Then open Gold price chart and find a trading panel.
It will be at the bottom of the screen.
Click " expand " in the right corner.
In the suggested options, choose TradingView Paper Trading and click " Connect ".
In paper trading window, click " create an account ".
Choose the account balance, leverage and commissions exactly as you have with your real gold trading account.
And now your best free gold position size calculator is ready .
How to Use It
Once you found a trading setup, know the exact stop loss level and your desired risk per trade.
Let's imagine that we want to buy Gold now.
To calculate the best lot size for our trade, we should know the exact level of our Stop Loss.
Let's take 2770 level for the sake of the example.
Right-click on that chart and choose " trade " and " create new order " then.
The window that will appear on the right side of the chart. It will be your lot size calculator on TradingView.
Select " stop loss " checkbox and input the desired risk percentage for a trading position.
Let's take 1% as the example.
In the price field, input the exact price level of your stop loss : 2770 in our case.
In Gold XAUUSD, trading 1 standard lot equals 100 units/ounces.
Your lot size will be based on the number of units.
Take that number and divide it by 100.
In our case, we have 54 units.
Our lot size will be 54 dived by 100 or 0,54.
That will be your lot size for the Gold trade.
What I like about TradingView position size calculator is that once you set your default parameters, the only thing that you need to adjust for the measurement of a lot of size is the level of stop loss of your Gold trading position.
If you use TradingView for charting, it will be very convenient for you to use it.
❤️Please, support my work with like, thank you!❤️
I am part of Trade Nation's Influencer program and receive a monthly fee for using their TradingView charts in my analysis.
XAUUSD is ready for a deeper correctionA Historical Run
For the last 2 months, Gold ( OANDA:XAUUSD ) was an absolute monster. Near vertical move. All pullback shorts were destroyed. The momentum was just intense.
Corrective Structure
As all impulsive moves must, the rally is now exhausted , and we are in a corrective phase. Price is no longer going up, but it is consolidating.
What's Next?
The current wave down appears to be shaping into a bearish AB=CD.
In a classic AB=CD pattern, the length of the CD leg must equal the length of the AB leg.
I will not be looking for any long setups until price reaches $3700~3770 range, and shows signs of reversal.
Until then, my view is still bearish on XAUUSD. I'm expecting a pullback testing the previous resistance ($4150) then continuation to the down side.
Good Luck!

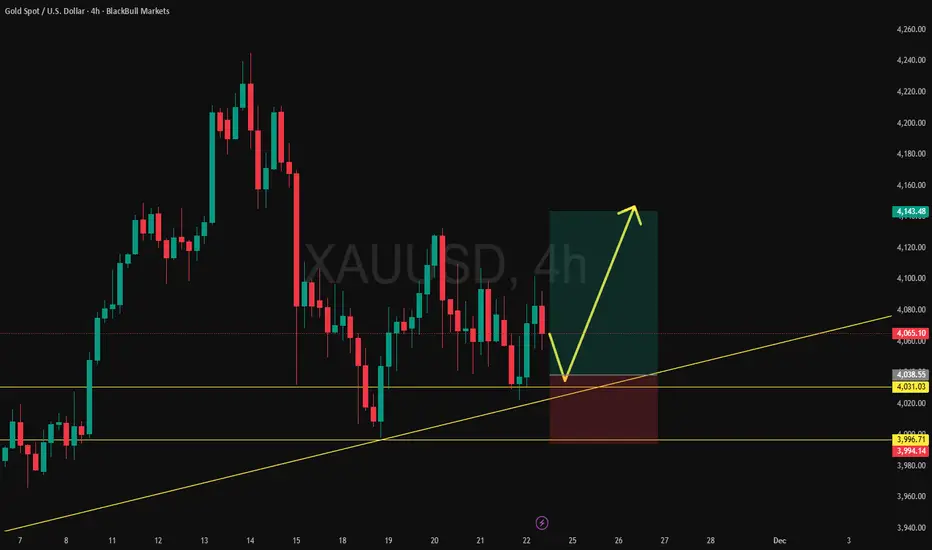
XAUUSD / GOLDGold highlighting a potential bullish continuation setup after a period of consolidation.
Over the past several sessions, price has broken out of a descending trendline, transitioning from a bearish phase into a more constructive, upward-leaning structure. Following the breakout, Gold has consistently respected a newly formed ascending trendline, which now acts as dynamic support.
Multiple horizontal demand zones (grey areas) can be seen beneath the current price, showing where buyers previously stepped in. Price retraced into one of these demand zones and bounced, suggesting ongoing buying interest. After reclaiming this zone, Gold has been forming higher lows, signalling growing bullish momentum.
The chart also displays a projected bullish path, where price may experience a small pullback into the ascending trendline before making another upward impulse. Two clearly marked TARGET zones above the current price indicate potential take-profit areas if bullish momentum continues. These targets align with previous supply zones where price has reacted strongly in the past.
The green shaded region represents the buying area and profit zone, showing the anticipated move toward the upper resistance zone around 4,225. The red region underneath marks the risk zone (stop-loss area), highlighting the level where the bullish setup would be invalidated if price falls below it.
Overall, the chart communicates a structured and disciplined bullish setup:
✔ A breakout from the downtrend
✔ Support formed at an ascending trendline
✔ Demand zones holding
✔ Bullish targets identified ahead
This provides traders with a clear framework of how price may behave if the trend continues upward while also defining the risk in case the market reverses.
If you find it helpful please like and comments for this post and share thanks.

Gold buy ideaGold Analysis
Gold is rejecting the London Low with a strong wick, showing buyers stepping in at a key level.
How to Trade It
1️⃣ Wait for the 15m candle to close
Wait for confirmation that price is holding above the rejection zone.
2️⃣ Targets (TPs)
TP1: 4139
TP2: 4150
3️⃣ Risk Filter
If the next candle closes below the previous 15m candle, do not take the trade. This signals weakness in the setup.

Gold Set Up Secured 300 PipsPerfect play, with price BOS on the 1h, come down tap into 1h demand, engulf on the 1h and 15m to target BSL

XAUUSD: Pullbacks to support levels present entry opportunitiesThere’s no need to panic over gold’s pullback—the retracement is healthy and provides a better opportunity to re-enter long positions.
From the daily chart, gold remains firmly in a bullish structure this week. The rally during the Asian session followed by a corrective pullback is a normal consolidation move and does not change the overall bullish trend. It’s important to recognize that this is a retracement, not a reversal.
On the 1-hour chart, the key support zone is $4,142–$4,150, a level that has been repeatedly validated in previous sessions. Therefore, as long as gold’s pullback holds above this zone, I believe the bullish outlook remains intact.
Trading Plan:
Buy at: $4,142–$4,150
Take Profit 1: $4,170
Take Profit 2: $4,200
Stop-loss: Based on individual risk tolerance

XAUUSD – H1 uptrend channel, short-term downside risk increasingXAUUSD – H1 uptrend channel, short-term downside risk increasing Brian – Prioritize short selling at the channel peak, wait to buy back at lower support
I. Strategy Summary Gold is trading in an uptrend channel on H1, but the rise around 4.160 shows signs of weakening, increasing short-term correction risk.
Preferred Scenario: Short sell at the channel peak 4.162–4.164, targeting support areas 4.145 – 4.130 – 4.115 – 4.100.
After the correction, the 4.100–4.080 area may become the foundation for the next rise in the larger trend.
Important price areas to watch: 4.139 – 4.127 – 4.110 – 4.088.
II. Macro Context & News 27/11
02:00 – Fed releases Beige Book This document updates the Fed branches' assessment of the US economic situation.
Describing slower growth, cooling price pressures will further reinforce expectations that the Fed will soon cut interest rates → supporting gold.
Conversely, if the Beige Book describes the economy as still “resilient,” the market may temporarily slow down pricing in rate cuts → causing a short-term adjustment for gold.
19:30 – ECB releases October meeting minutes
If the minutes lean towards the scenario of keeping high interest rates longer, the EUR may be supported, indirectly affecting the USD and gold inflows.
However, the impact is usually not as strong as US data, mainly affecting the overall risk-on/risk-off sentiment.
General Context: Gold has surpassed 4.160 USD/oz as the market increasingly expects the Fed to cut interest rates as early as December, reducing the appeal of interest-bearing assets and increasing the allure of gold – a non-yielding asset. This creates a support foundation for the medium-term uptrend, but after a hot rise, technical adjustments on H1 are normal.
III. Technical Structure – H1 uptrend channel
The price is within the H1 uptrend channel, with rising peaks and troughs, but the upper area near 4.160 coincides with:
The upper boundary of the price channel. The “Sell POC” area on the chart – where liquidity and sell orders are concentrated.
Preferred scenario on the chart: The price may slightly rebound to the POC area 4.162–4.164, then be rejected and slide to the important support area around 4.110 before extending the adjustment down to 4.100–4.080.
The lower trendline of the uptrend channel also acts as a short-term buy area if a clear candle reaction appears.
Notable price areas on H1: Resistance: 4.162–4.164 (channel peak + POC). Intermediate support: 4.139 – 4.127 – 4.110. Deep support: 4.088 – 4.080 – 4.100 (area that may form the bottom for the next rise).
IV. Trading Plan 1. Preferred Scenario – Short sell at the channel peak Idea: Short sell when the price rebounds to the upper boundary of the H1 uptrend channel and POC 4.162–4.164, expecting a correction to support.
Sell: 4.162–4.164 SL: 4.168 TP targets: TP1: 4.145 TP2: 4.130 TP3: 4.115 TP4: 4.100
This is a counter-move order in the uptrend channel, only targeting a short-term correction, not a major trend reversal scenario.
2. Supplementary Scenario – Short buy at support trendline Idea: When the price hits the lower trendline of the H1 uptrend channel and a nice candle reaction appears, consider a short-term buy according to the channel, prioritizing areas:
4.139 – 4.127 – 4.110 – 4.088
Specific Entry/SL levels will depend on the actual price reaction at the trendline, but the general principle:
Buy close to the trendline,
SL placed below the immediate support area,
TP aimed at the middle of the channel or the nearest resistance.
V. Risk Management & Notes
Do not open new positions right before or at the time of the Beige Book and ECB minutes release, as volatility may suddenly increase, widening spreads.
The sell order at 4.162–4.164 is a short-term counter-trend order in the uptrend channel, requiring moderate volume and strict adherence to SL 4.168.
If the price clearly breaks and holds above the 4.170 area, the H1 correction scenario weakens – in that case, stay out, wait for a new structure instead of trying to maintain a sell view.

XAUUSD LONG 28/11Greetings,
Hello traders, this is the XAU-USD 15m important support zone.
Based on market trend and previous day movement.(white line)
Key levels;
Entry: 4163.21
Target: 4173.21
Stop loss: 4153.21
Risk Reward Ratio 1:1
Your likes and boosts motivate us to keep learning and sharing ideas!

Gold price tries to return to 4194⭐️GOLDEN INFORMATION:
Gold (XAU/USD) edges lower in Thursday’s Asian session, slipping from Wednesday’s near two-week high, though losses remain limited. Expectations of lower US rates and optimism over a potential Russia-Ukraine peace deal are supporting broader risk sentiment, diverting some flows away from safe-haven gold amid light Thanksgiving-thinned trading
⭐️Personal comments NOVA:
maintain uptrend above 4100, continue to accumulate and try to return to 4194. Market is optimistic about December interest rate
⭐️SET UP GOLD PRICE:
🔥SELL GOLD zone: 4193 - 4195 SL 4200
TP1: $4180
TP2: $4170
TP3: $4150
🔥BUY GOLD zone: 4063 - 4061 SL 4056
TP1: $4078
TP2: $4090
TP3: $4108
⭐️Technical analysis:
Based on technical indicators EMA 34, EMA89 and support resistance areas to set up a reasonable BUY order.
⭐️NOTE:
Note: Nova wishes traders to manage their capital well
- take the number of lots that match your capital
- Takeprofit equal to 4-6% of capital account
- Stoplose equal to 2-3% of capital account

Gold Hit Both Targets — +440 Buy, +195 SellHello my trader friends,
I'm back with an updated analysis on gold.
We had a great forecast on XAU/USD.
Based on our previous analysis, we expected a bullish move toward our marked zone — and gold followed the chart beautifully. Our buy position delivered +440 pips profit.
After that, we were waiting for a reaction from the sell zone, and that’s exactly what happened. Gold tapped our level and started a corrective move downward, giving us another +195 pips profit from the sell.
Follow me for more updates and upcoming analyses!

XAUUSD – H2: Discount zone has formed, just waiting for the ...XAUUSD – H2: Discount zone has formed, just waiting for the price to pull back to continue buying up
On the H2 frame, gold just had a strong break up to the 4.180+ zone after a period of narrow range compression. At the end of the week, coinciding with Thanksgiving, I only prioritize waiting for an adjustment to the discount zone to buy up, absolutely not chasing the price at the peak.
🎯 MAIN SCENARIO – BUY THE DIP AT FIBO & POC ZONE 4.163–4.160
Buy entry: 4.163 – 4.160
SL: 4.155
TP: 4.178 – 4.195 – 4.220
⭐️ ALTERNATIVE SCENARIO – BUY DEEP AT VAL ZONE + STRONG SUPPORT 4.139–4.136
Buy entry: 4.139 – 4.136
SL: 4.130
TP: 4.150 – 4.172 – 4.190 – 4.220
The total risk for each scenario I always keep within the range of 1–2% of the account.
Basic context
End of the week + Thanksgiving ⇒ thin liquidity, easy to shake at the end of the session.
Messages from Trump & credit data show the economic picture and the December interest rate path are not really clear.
This keeps gold still having a defensive role, but not enough basis to expect a straight upward move – so I prioritize trading according to technicals and specific price zones.
Technical analysis H2
Market sentiment & trading plan
After the break, the buyers are holding momentum, but the price moving sideways at the high zone shows the market is partially taking profits, waiting for liquidity.
Thin liquidity easily creates sweeps to the support zone before turning around, that's the move I want to take advantage of.
Plan:
Prioritize Buy at 4.163–4.160, only consider the 4.139–4.136 scenario if the price is deeply sold off.
All orders have a hard SL (4.155 and 4.130), do not widen the stop.
Take partial profits, move SL in a favorable direction as the price approaches TP levels.
If you find the analysis useful, follow TradingView and leave a comment about the price zone waiting for entry – I always read feedback to optimize future posts.

Structure Turns Bullish, Yet Volatility Warns of Traps1. Recap of Yesterday’s Outlook
In yesterday’s analysis, I said very clearly:
➡️ “As long as 4100 resistance is intact, the structure remains bearish.”
And indeed, I followed that bias — I sold the rally around 4075, the trade moved 150 pips in my favor, but without follow-through.
I closed it with an insignificant 30-pip profit, a good decision considering that holding it would’ve led straight into a stop-loss hit.
Price action justified the caution.
2. Has the Structure Shifted?
The key question today:
➡️ Has the market turned bullish?
So far, yes — technically, the structure has shifted.
Why?
- The 4100 resistance was broken strongly, with conviction.
- The breakout wasn’t just a wick; it held.
- Momentum flipped short-term direction
Under normal conditions, this would imply:
➡️ Upside continuation toward 4200.
And the logic is simple:
- What was resistance becomes support.
- So the 4100–4080 zone is now the bullish line in the sand.
3. But This Is Gold These Days… Volatile & Erratic
The problem is not the technicals — the problem is behavior.
Gold recently has been:
- Hysterical in volatility,
- Featuring massive fakeouts,
- Delivering 700–1500 pip swings within hours,
This makes the breakout valid, but not necessarily trustworthy without confirmation.
And here’s the key:
➡️ If Gold drops back under 4080, the structure instantly turns bearish again.
This is why blindly buying the breakout is dangerous.
Patience and confirmation matter more than ever.
4. Technical Outlook – Levels That Matter
Bullish structure (for now):
- 4100–4080 is support
- Above this zone → bullish
- Target → 4200
Bearish trigger:
- Break back below 4080 → failed breakout
- Structure returns bearish
- Possible revisit of 4000, then 3900
Bigger picture:
Gold is still contained in a large triangle formation since the all-time high.
Breakouts inside a triangle are often traps until the triangle itself resolves.
That’s why flexibility is essential.
5. Trading Plan – Short-Term, Flexible, and Level-Based
Because Gold is in a triangle and volatility is intense:
- Trade short-term, not swing positions.
- Look to buy dips into 4100–4080, but only with clear reversal signs.
- Don’t hold bias stubbornly — adapt candle by candle.
Clear plan:
Bullish scenario:
- Buy dips around 4100- 4110 only if reversal signs appear
- Target 4200
Bearish scenario:
- If price falls back below 4080, forget the breakout —
bearish again
- Potential drop toward 4000, then lower
This is one of those moments where discipline beats prediction.
6. Conclusion – Bullish, but With an Asterisk
In summary:
- The breakout above 4100 is real → bullish bias active
- Target: 4200
- BUT the structure remains fragile due to recent volatility
- Below 4080 = bearish again
- Triangle structure adds uncertainty
- Short-term trading and flexibility are essential these days
The trend says bullish, the behavior says be careful.
XAU/USD Price Outlook – Trade Setup📊 Technical Structure
OANDA:XAUUSD Gold (XAU/USD) remains supported after rebounding from the 4,154–4,160 support zone, keeping the short-term bullish structure intact. Price has broken above the 4,170–4,175 barrier and is now consolidating just below the 4,190–4,196 resistance zone, with buyers looking to extend gains as long as support holds.
The chart shows a bullish continuation pattern:
Support zone: 4,154 – 4,160
Resistance zone / target area: 4,190 – 4,196
As long as gold stays above 4,154, dips into support are likely to attract buyers, with upside potential toward 4,190–4,196. A decisive 4H close below 4,154 would invalidate the bullish setup and expose the 4,130 region.
🎯 Trade Setup
Idea: Buy dips into support, targeting a move toward the 4,190–4,196 resistance zone.
Entry: 4,160 – 4,154
Stop Loss: 4,149
Take Profit 1: 4,190
Take Profit 2: 4,196
Risk–Reward Ratio: ≈ 1 : 2.76
Bias remains constructively bullish while price holds above 4,154–4,160 on a closing basis.
A break below 4,154 would signal weakening momentum.
🌐 Macro Background
According to FXStreet, gold holds firm near a two-week high as rising expectations for a December Fed rate cut continue to support bullish sentiment. Comments from multiple Fed officials confirmed that further easing is a “live option,” helping gold absorb both a modest USD rebound and the broader risk-on tone.
Key drivers:
Fed rate cut expectations reinforced by dovish remarks from Williams, Waller, and Miran.
Kevin Hassett emerging as the frontrunner for Fed Chair, expected to support aggressive rate cuts.
Mixed US data failed to alter the easing outlook, keeping USD capped.
Russia–Ukraine developments keep geopolitical uncertainty in play, maintaining gold’s safe-haven appeal.
Despite improved risk appetite, gold’s bullish bias remains intact due to persistent USD softness and expectations of lower US rates. The fundamental backdrop continues to favor upside moves.
🔑 Key Technical Levels
Resistance zone: 4,190 – 4,196
Support zone: 4,154 – 4,160
📌 Trade Summary
Gold remains in a bullish continuation structure above the 4,154–4,160 support band. As long as this zone holds, the setup favours buying dips and targeting 4,190–4,196 where previous supply pressure may reappear. Fed rate cut expectations and geopolitical tensions underpin the bullish narrative, while risk sentiment limits immediate downside.
⚠️ Disclaimer
This analysis is for reference only and does not constitute trading advice. Trading involves significant risk, and proper risk management is essential.

Where Can Gold (XAUUSD) Take a Correction?Looking at your chart, Gold is moving up in a short-term recovery, but there are strong resistance zones above where a correction (downward move) can happen.
1️⃣ Zone: 4113 – 4120 (Current Area)
This is a minor resistance.
Small pullback is possible but not a major reversal zone.
2️⃣ Major Resistance Zone: 4143 – 4147
This is the first strong supply zone.
Price fell sharply from this zone earlier.
This is the most likely area for correction.
3️⃣ Strong Resistance: 4176 – 4180
If price continues upward, this is the next major resistance.
High probability that gold will correct from here.
4️⃣ Upper Resistance: 4200 – 4207
This aligns with your upper trendline.
This is the highest and strongest reversal zone.
A deep correction can start from here.
Stay Tuned For More Updates

Xauusd from Ment-methodBig move up ahead as the aggressive bull broke the long term trendline. Consider todays is Friday session, lets take a look what happen next week as this week's slow move/accumulation might indicates a stage 2 moves next.
