XAU/USD Market Structure Reveals Potential Upside Move!🥇 XAU/USD: "Gold Heist Wealth Map" - Swing/Day Trade Blueprint 🚨
🎉 Ladies & Gentlemen, Thief OGs! Welcome to the Gold Heist Wealth Map for XAU/USD (Gold vs. U.S. Dollar) — a cheeky, calculated swing/day trade plan to snatch profits from the metals market! 😎 This setup is designed with a thief-style layered entry strategy, bullish vibes, and a pro-level escape plan to dodge the "police barricades" (resistance zones). Let’s dive into this shiny opportunity with a fun yet professional edge! 💰
📈 Trade Setup: The Gold Heist Plan
Asset: XAU/USD (Gold vs. U.S. Dollar)
Outlook: Bullish 📈
Strategy: Thief-Style Layered Limit Orders — multiple buy limit entries to maximize your loot! 🕵️♂️
Entry Levels:
🔔 Buy Limit @ 3850
🔔 Buy Limit @ 3880
🔔 Buy Limit @ 3900
🔔 Buy Limit @ 3930
Pro Tip: Feel free to add more layers based on your risk appetite! Stack those entries like a master thief. 😜
Stop Loss (SL): Set at 3800 (the "Thief’s Exit Door"). 🚪
Note: This SL is my suggestion, but you’re the boss of your heist! Adjust based on your risk tolerance. 💸
Take Profit (TP): Aim for 4100 — a juicy target where a police barricade (strong resistance + overbought zone) might set a trap. Escape with profits before the market cuffs you! 👮♂️
Note: TP is my call, but take your loot when you feel the heat! Your trade, your rules. 😎
🛠️ Strategy Breakdown: Why This Setup?
Thief-Style Layering: Using multiple buy limit orders spreads your entry risk across price levels, letting you sneak into the market like a pro. 🕵️♀️
Bullish Momentum: Gold’s been shining bright with macroeconomic tailwinds (USD weakness, inflation hedges). 📡
Resistance Watch: The 4100 zone is a psychological and technical barricade. Overbought signals + potential traps mean it’s time to cash out smartly. 🏦
Risk Management: The 3800 SL keeps your downside locked, but always tailor it to your account size and risk profile. ⚖️
🔗 Related Pairs to Watch (in USD)
Keep an eye on these correlated assets to boost your market awareness:
OANDA:XAUUSD (Silver vs. U.S. Dollar): Silver often moves in tandem with gold. Watch for similar bullish setups or divergences.
USD Index ( TVC:DXY ): A weaker USD typically fuels gold rallies. Monitor DXY for inverse correlation signals. 📉
OANDA:AUDUSD : Gold prices often align with the Aussie dollar due to Australia’s gold exports. A rising AUD/USD could support our bullish XAU/USD bias. 🇦🇺
Key Correlation Insight: Gold thrives in low-rate environments or when USD weakens. Check economic calendars for Fed rate decisions or inflation data (CPI, PPI) to time your entries. 📅
⚠️ Disclaimer
This Thief-Style Trading Strategy is for fun and educational purposes only! Trading involves risks, and you’re responsible for your own decisions. Always do your own research (DYOR) and manage risk wisely. No financial advice here — just a playful map to navigate the markets! 😄
✨ If you find value in my analysis, a 👍 and 🚀 boost is much appreciated — it helps me share more setups with the community!
#XAUUSD #Gold #SwingTrading #DayTrading #ThiefStrategy #Bullish #Forex #MetalsMarket
Trade ideas

Momentum Building for Gold Bulls | 4125 → 4270Hello Followers, I am going to share you my opinion on gold next move..
Gold has finally break the bullish rhythm and now currently gold is at working near a resistance area and it's level is 4152/4128. We have two different interfaces here first is if gold break resistance then it'll fly till the target around 4270 and second is if gold respect this resistance then it will fall and will reach the lower support around 4058/4030 and then it'll fly again and break resistance and teach 4270..
KEYPOINTS:
Entry-level 4125
2nd Target 4270
Support area 4058/4030
Resistance Area 4152/4128

XAU/USD: Bullish Rally to 4225?OANDA:XAUUSD is priming for a bullish rally on the 1-hour chart , with price pulling back to a critical support zone after a sharp decline, forming a potential reversal point as buyers defend against further downside amid overall uptrend signals. This setup highlights a classic dip-buy opportunity near the confluence of support and recent lows.
Entry zone between 4007-4037 for a long position. Target at 4225 near the resistance zone for attractive upside potential. 📊 Set a stop loss on a close below 3991 to manage risk effectively. 🌟 Keep an eye on confirmation through a bullish engulfing pattern or increased volume pushing above the entry, leveraging gold's volatility in response to USD movements.
Fundamentally , today's US Initial Jobless Claims and Existing Home Sales data could introduce volatility to gold and the dollar—Jobless Claims are forecasted at around 233K, while Existing Home Sales are expected near 4.00M, potentially strengthening USD if figures beat expectations and pressuring gold prices. 💡
📝 Trade Plan:
✅ Entry Zone: $4,007 – $4,037 (buy zone near support)
❌ Stop Loss: Close below $3,991
🎯 Target: $4,225 (resistance zone / take-profit area)
💎 Risk-to-Reward: More than 1:4, offering a strong technical edge.
What's your outlook on this trade? Share below! 👇

Gold expectation 1HLast wek price originally was suppose to be bearish till support, but buyers stepped in. Now we could be seeing a course correction back to the sam support.

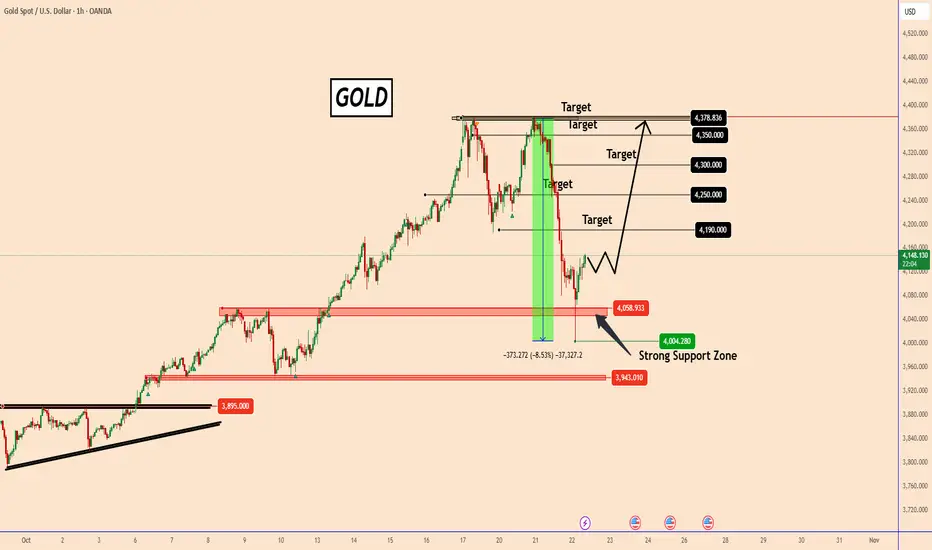
Gold Pulls Back on Profit-Taking, Bulls Defend the $4000 LevelGold Pulls Back on Profit-Taking, Bulls Defend the $4000 Level
Yesterday, gold faced a quick sell-off, likely triggered by the profit-taking of large institutions (manipulators), and corrected by almost 8.6%.
Considering that this move was created without news, it is a clear sign of manipulation. We cannot consider overbought conditions, as they have been in this state for 2 years.
The lower low was created near 4000, where the price found the bulls well-positioned near that psychological price zone.
Gold remains bullish and could rise again as shown in the chart.
It will break the 4000 level only if a larger manipulation unfolds again today or during the next week.
The price should rise again with targets at 4190; 4250; 4300 and 4350.
You may find more details in the chart!
Thank you and Good Luck!
❤️PS: Please support with a like or comment if you find this analysis useful for your trading day❤️
Lingrid | GOLD Weekly Analysis: Pullback From Record HighsThe price perfectly fulfilled my previous weekly idea . OANDA:XAUUSD market continues to navigate through considerable volatility as it pulls back from the recent spike that tested zone below the $4,400 resistance zone. After achieving a new all-time high, the metal is now experiencing natural selling pressure and technical correction, bringing some gravitational force into the equation. Despite this near-term weakness, the underlying trend structure remains constructively bullish, suggesting any substantial decline could present attractive entry opportunities for those seeking value.
The technical landscape reveals gold trading within a well-defined upward channel that has guided the rally since late September. The recent rejection from resistance has brought price action back toward the mid-channel area around $4,200, which aligns with the previous Monday high below and represents a crucial inflection, optimal entry point. The triangle pattern that formed during the consolidation phase earlier in the trend provided the springboard for the explosive breakout, and now the market may repeat this pattern, creating continuation formation.
The key support zone sits at $4,130-$4,135, and holding above this level would keep the bullish structure intact for another potential test of $4,400 and beyond toward the $4,500 projection zone. However, failure to hold could trigger deeper correction toward the lower channel boundary near $4,000 or even the stronger support at $3,730-$3,780, which would actually offer more compelling risk-reward for strategic accumulation. The coming week will clarify whether this represents healthy digestion or something more corrective in nature.
If this idea resonates with you or you have your own opinion, traders, hit the comments. I’m excited to read your thoughts!

XAU/USD Technical Setup ‖ Bullish Momentum or Smart Trap?🏆 XAU/USD: The Golden Heist Blueprint | Swing & Scalp Strategy 💰
📊 Market Overview
Asset: XAU/USD (Gold vs U.S. Dollar)
Market: Precious Metals
Strategy Type: Dual Setup - Swing Trading (Bullish) & Day Trading/Scalping (Bearish)
Risk Level: High Volatility Zone ⚠️
🎯 The Master Plan
🚀 Bullish Scenario: "To The Moon" Setup
Breakout Level: $4,400.00
Action: Direct long entry on confirmed breakout above resistance
Logic: Clean break = institutional momentum shift
🔻 Bearish Scenario: Scalping/Day Trade Setup
Breakdown Level: $4,050.00
Action: Short positions on confirmed break below support
⚠️ Trap Alert: Any pullback above $4,050.00 post-breakdown = potential smart money trap. Watch for false breakouts!
🛡️ Risk Management Zone
Stop Loss (Pullback Buy Plan): $3,950.00
⚠️ Disclaimer: This SL is based on my analysis for the bullish pullback scenario. You're the captain of your own ship! Adjust stops according to your risk tolerance, account size, and trading style. Never risk more than you can afford to lose.
🎖️ Profit Targets
Buy Side Target: $4,600.00
Exit Strategy Notes:
Strong resistance confluence at this level
Overbought conditions likely
Potential trap zone for late entries
Recommendation: Scale out profits gradually rather than waiting for the full target
Sell Side Target: $4,050.00
Exit Strategy Notes:
Major support level - expect bounces
High probability of liquidity grab at this zone
Consider partial profit taking before reaching full target
Recommendation: Trail stops as price moves in your favor
⚠️ Disclaimer: These targets are MY analysis, not financial advice. Take profits when YOUR strategy signals, not mine. Trail stops, scale out, or exit based on YOUR plan. Your money, your rules! 💪
🔗 Related Markets to Watch
Correlated Assets:
DXY (U.S. Dollar Index): Inverse correlation - Dollar strength = Gold weakness
GC (Gold Futures): Direct correlation - Institutional positioning indicator
XAUEUR (Gold vs Euro): Alternative safe-haven flow gauge
US10Y (10-Year Treasury Yield): Inverse correlation - Rising yields pressure Gold
BTCUSD (Bitcoin): Risk-on/risk-off sentiment indicator
Key Fundamental Drivers:
Fed monetary policy & interest rate decisions
Inflation data (CPI/PCE reports)
Geopolitical tensions (safe-haven demand)
Real yields & opportunity cost
🔑 Key Technical Points
✅ Breakout Confirmation: Wait for candle close above/below key levels
✅ Volume Analysis: High volume breakouts = higher probability
✅ Smart Money Traps: Watch for failed breakouts and liquidity grabs
✅ Risk-Reward Ratio: Calculate before entry - minimum 1:2 recommended
✅ Market Structure: Respect higher timeframe trends
🎭 Trading Psychology Reminder
This strategy has a playful "heist" theme for entertainment, but make no mistake — treat your capital with serious respect. The market doesn't care about our plans. Adapt, manage risk, and preserve capital above all else.
Remember:
No setup is guaranteed
Always use stop losses
Never risk your rent money
Emotions are the enemy
The market pays patient traders
✨ If you find value in my analysis, a 👍 and 🚀 boost is much appreciated — it helps me share more setups with the community!
#XAUUSD #Gold #GoldTrading #ForexTrading #SwingTrading #DayTrading #Scalping #TechnicalAnalysis #PreciousMetals #TradingStrategy #RiskManagement #Forex #GoldAnalysis #TradingIdeas #MarketAnalysis #PriceAction #Breakout #SupportAndResistance #TradingView #ForexSignals
Happy trading, and may the pips be ever in your favor! 🎯💎

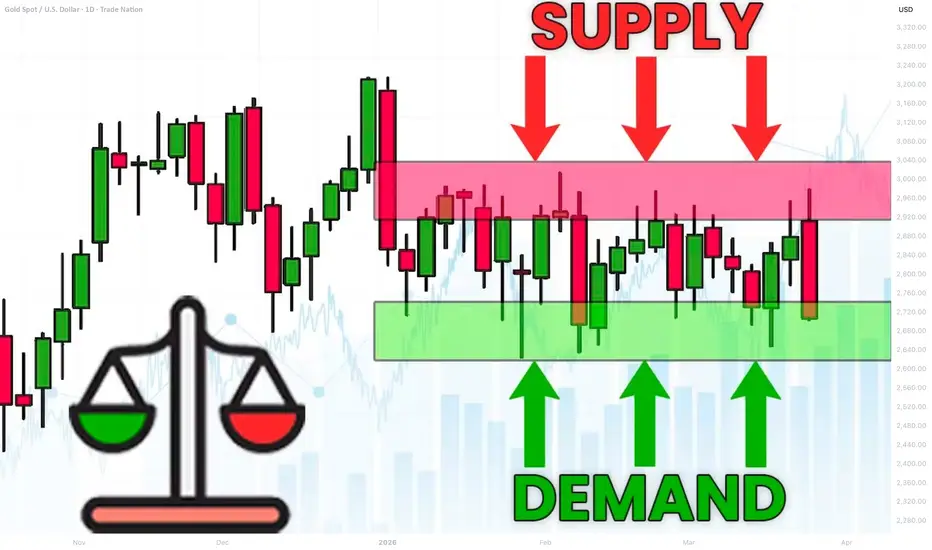
What is Equilibrium in SMC. Balance and Imbalance in Forex Gold
Equilibrium is one of the core elements for understanding market liquidity.
In this article, we will go through the essential basics of liquidity in Forex trading with Smart Money Concepts SMC.
You will learn the interconnections between supply and demand and I will explain how to easily identify balance and imbalance on any market.
Let's start our discussion with understanding how forex pairs move.
The price of an asset goes up if the market demand is stronger than the market supply. The excess of buying activity make the markets update the highs. In smart money concepts, such an event will also be called a buying imbalance.
Look at a strong bullish rally on Gold.
The price is going up because of a buying imbalance.
A strong buying activity creates a massive amount of buyers with unfilled orders.
To entice sellers to start selling, they must offer a higher-better price.
At the same time, if the price of an asset goes down , it means that the market supply is stronger than a demand. The excess of supply will make the markets update the lows. In smc, it will be called a selling imbalance.
That is exactly what is happening with GBPUSD forex pair.
A strong selling activity and the shortage of demand makes the price go down.
The excess of supply or demand on the market can not be eternal.
The lower the price becomes, the more buyers will start buying, and the more sellers will start closing their positions.
At some moment, the surplus of supply will be absorbed by the buyers.
That will be a moment when the market will find equilibrium , the balance between supply and demand.
A strong bearish imbalance on USDJPY made the price drop significantly.
The falling price made 3 things:
It attracted more buyers, because the lower the price the more profitable is buying USDJPY.
It discouraged some buyers from buying, considering that the price is already "too low".
It encouraged some buyers to close their positions in profit.
Because of that, USDJPY stopped falling and found a balance in supply and demand. That is what we call Equilibrium .
In a bull run, the higher the price will go, the more sellers will start selling.
At some moment, buying imbalance will be absorbed by the bears and supply & demand will eventually balance.
Such an event will be called the equilibrium .
EURGBP was rallying strongly.
The higher the price went, the more sellers started to sell, considering selling the pair more and more profitable.
And the same time, fewer buyers were buying and the more started to close their buy positions in profits.
At some moment, the entire excess of the market demand was absorbed by a supply. The market stopped growing and equilibrium was found.
One of the main characteristics of a market equilibrium is sideways price movement and a termination of a formation of new highs or new lows.
Usually, such a sideways price action will form a horizontal range.
That's a real example how a CAD JPY pair found an equilibrium after an extended bearish movement. A formation of a horizontal range confirmed a balance between a supply and a demand.
Please, note that these ranges will form on any time frame that you analyse.
The rule is that the higher is the time frame of the range, the stronger is the market equilibrium.
Above, I have 3 different charts:
USDJPY on a daily time frame, EURJPY on a 4H and GBPUSD on 15 minutes.
All the pairs found an equilibrium in horizontal ranges.
An equilibrium on USDJPY will signify intra week or even intra month balance,
while on EURJPY it will mean intraday/intra week balance.
On GBPUSD, it will signify intraday equilibrium.
Market equilibrium can not last forever.
Fundamentals news and changing market conditions, make the market participants constantly reassess a fair value of an asset.
A violation of the range and a breakout of one of its boundaries will be a trigger of an occurrence of an imbalance .
A bullish violation of the upper boundary of the range will signify a buying imbalance and a highly probable rise to the new highs.
While a bearish violation of the lower boundary of the range will mean a selling imbalance and a highly probable fall to the new lows.
Please, study how GBPCHF was moving for a week on an hourly time frame.
The periods of balance were changed by the periods of bullish or bearish imbalances, that found a new equilibrium on higher/lower price levels.
Understanding of basic principles of supply and demand in trading is essential for profitable trading smart money concepts.
Learn to recognize the periods of imbalance and equilibrium.
It will provide you the edge in understanding and trading any forex pair.
❤️Please, support my work with like, thank you!❤️
I am part of Trade Nation's Influencer program and receive a monthly fee for using their TradingView charts in my analysis.
After the gold shock, there may be a chance to break below 4000
News:
Last Friday, the US released CPI data. The reported decline in the figure supports the Fed's interest rate cut, which is bullish for gold, pushing it as high as 4135. However, the overall gain was not particularly strong, with continued volatility due to the limited rebound in the data, closing around 4114.
Next week will be the Fed's interest rate decision. Next week is the Federal Reserve’s interest rate decision. A rate cut is a foregone conclusion, and the extent of the positive impact is already limited. The increase before and after the data is released is estimated to be small. Therefore, after the volatility, I am optimistic that the gold price will weaken and fall next week, and it may break below the 4,000 mark. The idea is to rebound and short.
Specifically:
After the double top of gold in 4 hours, gold still fluctuated back and forth under the pressure of the neckline of the double top in 4 hours. Although the CPI was bullish for gold on Friday, it did not allow the gold bulls to break through 4160. This shows that the gold bulls are still under pressure in the short term, and gold will continue to fluctuate in a large range. If gold cannot break through 4160 at the beginning of next week, it will still be bearish, and we will continue to pay attention to the support around 4000.
If gold is stimulated by safe-haven news next weekend or directly breaks through 4160, then gold bulls may start to fight back and continue to go long at that time.
Trading strategy:
Buy: 4135-4125, SL: 4145, TP: 4105-4080

GOLD LONGLong gold from d ts, desitional block that created the true MSS, high bullish overall momentum from higher timeframes, liquidity grab at london open, D crt 50% target pending.

Gold Buy Plansweept Previus Both side.
recently CISD happend in H4.
h1 MSS farmed.
i am expecting bull relly start from fvg.

Latest Gold Price Analysis and Trading Strategy:
I. Fundamental Overview
Price Fluctuations
Gold experienced a significant correction, with spot gold falling 6.3% in a single day, marking its largest single-day drop since April 2013.
having rebounded after touching a low of $4005/oz during the Asian trading session.
Main Bearish Factors
Easing Geopolitical Tensions: European efforts to promote a ceasefire and peace talks, along with a thaw in China-US trade frictions, have reduced safe-haven demand.
Stronger US Dollar: The US Dollar Index (DXY) rose to near 98.97, putting pressure on dollar-denominated gold.
Technical Selling Pressure: Profit-taking intensified after the significant year-to-date gains, triggering a correction from technically overbought conditions.
Adjusted Institutional Views: Citibank turned bearish in the short term, setting a 1-3 month target price of $4000/oz.
Long-Term Supporting Factors
The core bullish drivers remain intact: expectations of Fed rate cuts, continued gold purchases by global central banks (e.g., China increased holdings for the 11th consecutive month), de-dollarization trends, and global debt concerns. The medium to long-term fundamental backdrop remains solid.
II. Today's Trading Strategy
Core Approach
Market volatility is high, and a top pattern is emerging. Adopt a cautious stance, favoring or range-trading strategies. Avoid chasing rallies or selling into sharp declines.
Key Levels
Resistance: $4150-$4160/oz (Conservative Range), $4192/oz (Strong Resistance).
Support: $4080/oz (Initial Support), $4000-$4010/oz (Key Psychological & Technical Support, coinciding with the 100-day Moving Average).
Specific Trading Recommendations
Short Opportunities:
If the price rallies to the $4150-$4160 range, consider initiating light short positions.
Set stop-loss above $4170/oz.
Take profit targets: $4080/oz initially, with a further extension towards $4000/oz if broken.
Long Opportunities:
If the price pulls back and stabilizes in the $4000-$4010 area, consider light long positions.
Set stop-loss below $3980/oz.
Take profit targets: $4080/oz initially, with a further extension towards $4150/oz if broken.
Breakout Scenarios:
If the price breaks decisively above $4190/oz, pause short strategies and monitor for directional confirmation.
Risk Warnings
Key Focus Events: Speeches from Fed officials, US economic data, and the ECB President's speech could trigger significant volatility.
Position Management: Allocate no more than 20% of total capital to a single trade. Implement stop-loss orders strictly to manage risks associated with high volatility.
Summary: Short-term technicals lean bearish, but potential for rebounds exists near key support levels. Adopt flexible range-trading tactics, enforce strict risk control, and await new fundamental catalysts.

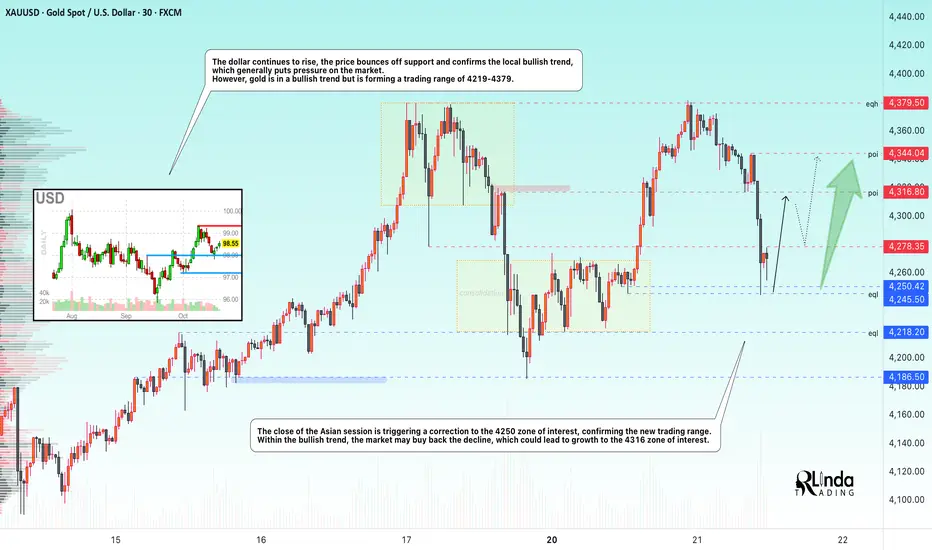
GOLD → The correction forms a trading range. Growth?FX:XAUUSD is adjusting to $4250 after retesting the all-time high of 4380. Short-term pressure is linked to hopes for an easing of the trade war between the US and China, but the bullish trend remains intact.
Key factors: Bentsen's meeting with the Chinese Vice Premier this week has revived optimism for a deal. The reduction in trade risks is temporarily supporting the USD. Hassett's statements about the imminent resumption of government work have reinforced risk-on sentiment.
Support for gold: The threat of tariffs rising to 155% from November 1 reminds us of the risks. Two rate cuts before the end of the year remain in focus. Friday's inflation data release and US corporate earnings reports are keeping demand for hedging alive.
Accordingly, the correction in gold is a temporary pause. The uptrend will remain unchanged as long as macro uncertainty persists.
Support levels: 4250, 4218
Resistance levels: 4278, 4316
Within the bullish trend, the price is forming a trading range. A retest of support could end in a recovery, with the fundamental background favoring the bulls. A retest of 4245 could trigger growth, as could a breakout of 4278 (closing above resistance).
Best regards, R. Linda!
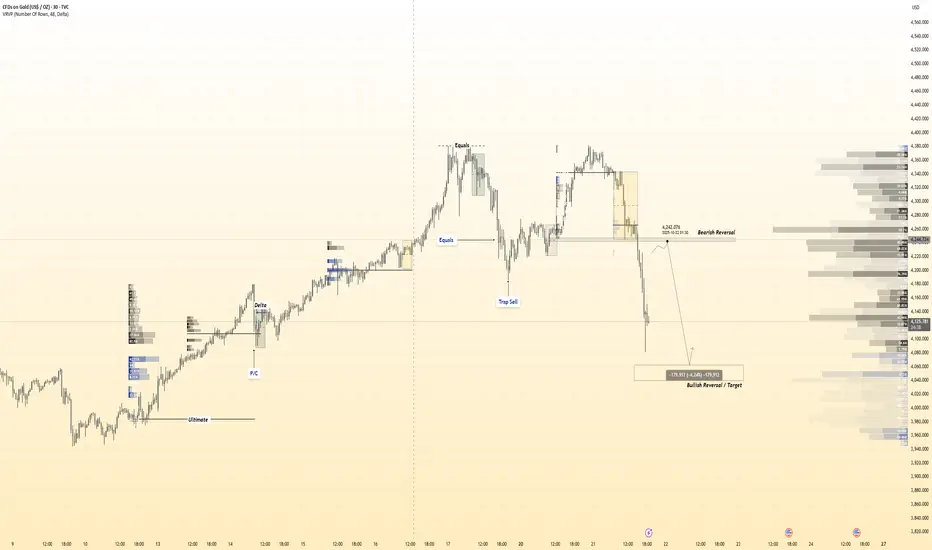
( HANZO Gold Protocol ) Bearish Reversal DetectedTime Frame: 30-Minute Warfare
Entry Protocol: Only after volume-verified breakout
🩸Bearish Reversal - 4240
🆚 Reasons To Enter The path
————
➕ Volume Engaged & Confirmed
➕ Time Zone Aligned (London / NY)
➕ Liquidity Cleared Below
➕ Cluster Shield Active
➕ Delta Shift Showing Buyer Control
➕ Reversal Formation Detected
➕ Price Below POC – Ready for Retrace
➕ Entry Prepared with Zero Emotion
GOLD (XAU/USD) – FINAL GRAND CYCLE ANALYSIS🟡 GOLD (XAU/USD) – FINAL GRAND CYCLE ANALYSIS
“The Rise of Real Money in a Failing Fiat World”
Elliott Waves | Fibonacci | Smart Money | Macro Fundamentals | Market Psychology
📅 Date: October 22, 2025
📍 Current Price: ~$4,039/oz
⏳ Time Horizon: 1970s to post-2050
🎯 Focus: Multi-decade Elliott Wave structure signaling the endgame for fiat currencies
🌐 SUPER CYCLE NARRATIVE – GOLD’S MONETARY METAMORPHOSIS
🔵 Wave I (1971–1980): The Rebirth of Real Money
Gold's first major secular rally began when the Bretton Woods system collapsed and President Nixon ended the U.S. dollar’s convertibility to gold in 1971. Gold soared from around $35 to nearly $875 by 1980. This wave was driven by runaway inflation, the oil embargo, and shattered confidence in fiat money.
🔴 Wave II (1980–1999): The Great Fiat Illusion
Following the 1980 peak, gold entered a brutal 19-year corrective phase, falling to the $250 zone. During this time, the U.S. dollar gained strength, Volcker’s interest rate hikes reined in inflation, and a new era of debt-based prosperity and stock market euphoria unfolded. Gold was dismissed, even by central banks who sold reserves. Structurally, this corrective phase formed a complex WXYXZ pattern , setting the groundwork for the massive Wave III rally.
🟢 Wave III (1999–~2033): The Fiat Reckoning Has Begun
This is the longest and most powerful supercycle wave and the one we are currently in. It is subdivided into five impulsive macro waves. As of now, gold is deep within Wave iii of III , the most explosive phase of the entire structure. The current rally is no longer driven by inflation fears but by existential doubts about the long-term viability of fiat currencies.
📈 Wave I of III (1999–2011): The Institutional Accumulation
Gold rose from around $250 to $1,920 over this period. Triggers included the dot-com bust, 9/11, the 2008 global financial crisis, and the launch of the first gold ETFs like GLD. This wave marked the beginning of institutional interest in gold as a systemic hedge.
📉 Wave II of III (2011–2015): The Disbelief Correction
Gold corrected nearly 45%, bottoming near $1,050. The narrative shifted — QE hadn't caused hyperinflation, the stock market was booming again, and faith in the dollar resurged. Retail abandoned gold, but institutional buyers quietly accumulated from newly created demand zones.
🚀 Wave iii of III (2015–~2026): The True Price Discovery Phase
This is where we are now. Since 2015, gold has exploded upward, driven by COVID-era QE, negative real interest rates, geopolitical instability, and major central banks accumulating gold for cross-border settlements outside the dollar system.
We are currently in the middle of this wave — micro wave (3) of iii — with price around $4,039. According to Fibonacci projections, this wave is expected to peak near $6,552 , corresponding to the 2.618 extension level . If bullish momentum continues, gold could overshoot toward $22,744 , matching the 3.618 Fibonacci extension and marking the likely top of macro Wave III.
In an extreme scenario where fiat trust collapses entirely, the 4.618 extension projects a possible target of $78,940 . All of these levels align with the upper bounds of the long-term logarithmic channel, validating both structure and projections. But most likely this target is for Wave V TOP .
🟣 Wave IV (Projected: 2026–2033): The Great Shakeout
After the parabolic run of Wave iii, a deep multi-year correction is likely. This correction — Wave IV — may retrace toward the long-term red trendline and could coincide with a temporary return to “faith” in fiat through reforms like CBDC rollouts or aggressive fiscal pivots.
This wave could resemble a WXY pattern or large ABC structure and may unfold alongside capital controls, deflationary pressure, and a resurgent tech or dollar narrative. However, this will likely be the last major buying opportunity before gold enters its final, euphoric revaluation.
🟢 Wave V (2033–2045+): The Final Blow-Off Top
Wave V is expected to be driven by an overt crisis of confidence in the global fiat system. Scenarios could include:
Mass adoption of gold-backed or commodity-tied digital currencies
Loss of global trust in the USD as the reserve currency
BRICS or emerging alliances introducing gold into cross-border settlements
Global central banks returning to physical gold as a monetary base
The upside potential here is monumental. The 4.618 Fibonacci extension already targets $78,940 , but under full systemic collapse or monetary reset conditions, gold could reprice toward $100,000–$250,000 per ounce — not as a bubble, but as a return to its role as sound, base-layer money.
📐 Fibonacci Milestones and Structure Alignment
Each major wave has closely respected its corresponding Fibonacci extension. Wave I topped around the 1.618 level ($1,887) . The ongoing Wave iii appears on track to reach the 2.618 level ($6,552) . From there, macro Wave III could stretch toward 3.618 ($22,744) . If Wave V extends fully, a 4.618 projection leads to $78,940 — all within the bounds of the established logarithmic trend channel. In a full-blown systemic reset, price could break even higher.
These levels are not speculative but grounded in structural alignment with Elliott wave geometry , Fibonacci mathematic s, and long-term institutional order flow .
🧠 Smart Money Concepts & Technical Validations
Smart money activity has left clear fingerprints across this cycle. Each break of market structure (in 2016, 2020, and 2023) confirmed higher time-frame bullish continuation. Institutional demand zones — especially during the 2018–2019 consolidation and 2022 pullback — were respected to the dollar.
This cycle isn’t retail-driven mania — it's a stealth institutional accumulation that’s now evolving into price discovery.
📊 Market Psychology Across the Cycle
Investor sentiment has followed classic psychology stages:
From 1999 to 2004, disbelief reigned: “Gold is dead.”
Between 2005 and 2011 came growing awareness: “Gold might work again.”
The 2011–2015 correction brought denial: “It was just a bubble.”
Hope returned in 2016–2020 as price quietly rallied.
From 2022 to 2026, euphoria dominates: “Gold will never go down.”
Wave IV will likely bring fear and capitulation between 2026 and 2033.
Finally, Wave V will ignite mania: “Gold to the moon!”
🚨 Final Synthesis: What This All Means
We are living through the largest repricing of monetary value in modern financial history. Gold is no longer just an inflation hedge — it’s becoming a hedge against the system itself . The structure on the chart doesn't just map price — it maps the collapse of fiat trust and the return of monetary sanity.
Gold is transitioning from:
A commodity hedge →
To a central bank hedge →
To a currency hedge →
And finally, to a system hedge
The current leg — Wave iii of III — is nearing its climax. After a correction in Wave IV, Wave V could take gold into previously unthinkable territory, not because gold changed — but because everything else did.
📌 Final Position Summary
We are currently in wave (5) of iii of III — the most powerful segment of the bull run
The next Fibonacci target is $6,552
The broader Wave III could peak near $22,744
After a correction (Wave IV), the final wave could send gold toward $78,940 , or even into the $100,000–$250,000 zone under extreme monetary reset conditions
This is not a mere forecast — it’s a macro-monetary blueprint for the coming decades.
🌊 "Those who understand the waves will ride them. Those who don’t will be swallowed by the tide." – FIBCOS
📘 Disclaimer: This is an educational market outlook based on technical and macroeconomic structure. It is not financial advice. Always do your own due diligence and risk management.
#XAUUSD #Gold #GoldAnalysis #ElliottWave #Fibonacci #SmartMoneyConcepts #PriceAction #TechnicalAnalysis #MarketStructure #Commodities #InflationHedge #MacroEconomics #CentralBanks #BRICS #MonetaryReset


Elliott Wave Analysis – XAUUSD (October 24, 2025)
1️⃣ Momentum
D1 Timeframe:
• D1 momentum is closing within the oversold zone → bearish strength has clearly weakened.
• The probability of a bullish reversal is now very high.
• A strong bullish D1 candle close is needed to confirm the reversal.
• Once confirmed, price may enter a 5-day bullish rally.
H4 Timeframe:
• H4 momentum is still declining.
• If the current H4 candle closes as it is now, we may see a main bearish move today (around 5 H4 candles).
• Since today is Friday, a deeper decline remains possible.
→ Therefore, careful observation and analysis are required before entering any trades.
H1 Timeframe:
• H1 momentum continues to decline.
• Price may drop toward the 4098 liquidity zone.
• If this level breaks, the next potential target is 4050.
________________________________________
2️⃣ Wave Structure
D1 Structure:
• Price has been moving sideways for several days.
• In Elliott Wave theory, when price reaches its target, it often needs time symmetry before the wave completes.
• Therefore, this prolonged sideways phase helps maintain time balance.
• It’s still too early to confirm whether this is yellow Wave 4 or just Wave 4 within yellow Wave 3.
H4 Structure:
• There are two possible scenarios:
1. The blue Y wave is still unfolding.
2. The purple Wave 5 has already started forming.
• To determine which scenario is valid, we monitor the current
H4 bearish phase:
o If price does not break the previous low, and H4 momentum enters the oversold zone, it likely indicates purple Wave 5 has begun, with an upside target near 4476.
o If price breaks the previous low, the blue Y corrective wave is still in progress, or a larger corrective structure is unfolding.
o In that case, we’ll watch the lower liquidity zones, with the ideal completion target for Wave Y around 3927.
H1 Structure:
• On the H1 chart, Wave C appears to have completed in the form of an Ending Triangle.
• According to Elliott theory, after an ending triangle, price should drop sharply and quickly.
• However, such a strong drop hasn’t appeared yet, so we continue to observe the price action carefully.
There are two main scenarios to consider:
1. If price declines slowly toward the 4050 liquidity zone, showing overlapping waves while H4 momentum moves into the oversold region, it’s likely that Wave 5 has already started.
→ In this case, we’ll look for buying opportunities.
2. If price falls rapidly and steeply, it suggests that the blue Y wave is still unfolding, or that the market is inside a larger corrective phase.
→ In this case, price may break below 4004, and we will patiently wait for buy setups around 3953 or 3927.
________________________________________
3️⃣ Trading Plan
• Sell Setup:
o Yesterday’s sell zone at 4149 has already reached about +400 pips.
o No new ideal sell zone for now → wait for liquidity breaks to look for the next sell setup.
• Buy Setup:
o Monitor potential buy reactions at:
4050
3953
3927
⚠️ Note:
Price is currently at a sensitive zone, with each candle showing a range over 200 pips.
→ Therefore, limit orders are highly risky at the moment and could easily get stopped out.

XAUUSD (Gold) seeking $4,000 region?As my H4 chart shows, gold did make a double top a few days ago and then crashed. You can give credit for this massive 3,800 points move to profit taking or economic uncertainty or any technical reason, maybe a combination but it really does not matter.
What does matter is that we now have a double or triple top indicating that we have more room to the down side. I am seeing a medium term bearish move followed by a consolidation and now it may be that we will get a breakout (to the down side) to give us a bearish continuation.
How far will we go? I have no idea but the round number 4,000 followed by 3,950 do make sense. If all this works out as I anticipate, it may be a good idea to close a partial position, move the stop to a level of small profit and then trail the price action.
This is not a trade recommendation; it’s merely my own analysis. Trading carries a high level of risk so carefully managing your capital and risk is important. If you like my idea, please give a “boost” and follow me to get even more.

Gold on Support levels / #6,100.80 Medium-term TargetTechnical analysis: This week's huge red Daily candlestick pattern is an indication of increased tension and war / conflict escalation negativity as geopolitical tensions arise which invalidated Buyers intent and comforted Short-term Gold’s Sellers early on. Gold was once again on High demand as Investors used the metal as an traditional safe-haven asset where capital strongly flew into Gold, pushing the Price-action way above the #13-Month High’s however due Profit taking of most Buyers (Long-term Investors) Gold dipped on Friday's session traditional Profit taking and was testing #4,000.80 benchmark and as (by my personal opinion) DX skyrocketed and engaged Short-term Buy-off rally where Selling pressure from DX de-escalated Gold towards June #1 High’s again (currently even Lower) and currently it is the question where market will be headed next. Gold was on hard Resistance levels and current consolidation levels (historical regression analysis) points that when Trading for Long on those levels, strong downside direction comes in form of #100 to 200 point + decline. Besides this, nothing else Supports the downwards argument (except current High Impact factor) since all Charts turned critically Bearish on Short-term. #4,000.80 mark is now new / old Support and by my calculation chances for breaking it again without new news are Technically really impossible (too far fetched and without catalyst to take the Price-action towards those / current High’s).
My position: However, in each market situation, Trader has to adapt. Therefore, do not take strong bets on the market, Buy and Sell current Intra-day timeframe with aggressive Scalps (#3 to #5-points) and close your order, calling it for the week. Expect new instructions with my Monday-session commentary. Also my #6,100.80 benchmark is posing as my new Medium-term Target.

If $GOLD is at its peak, is $BTC next?Gold has been rejected at the 0.618 level of the Fibonacci channel on the 3M chart.
The Stoch RSI demonstrates a striking similarity to past cycles:
The bullish structure, which continued in the overbought region in October 2010, peaked 273 days later in July 2011.
Momentum, which continued in the overbought region again in October 2019, reached its peak 365 days later in October 2020.
Today, history paints a similar picture once again.
The bullish structure, which began in the overbought region in October 2024, may have reached its peak approximately one year later, in October 2025, just as in previous cycles.
Gold appears to be completing its historical rhythm once again.
Note: The Bitcoin / Gold pair is developing in the opposite direction.

Gold — Preparing for an upward move after 2H rejectionBased on the failure to break the 2-hour resistance, we expect the price to start a new bullish move from the highlighted zone, aiming to break the 4-hour high.
This setup offers an attractive 1:5 risk-to-reward ratio, making it a promising and relatively reliable opportunity according to the current chart structure.
As always — stay patient, follow your plan, and trust your analysis.

SELL ASSET GOLD {XAUUSD}🔴 SELL SIGNAL ACTIVE — XAUUSD (GOLD)
Bears are stepping in as price shows signs of exhaustion at key resistance levels.
This setup marks a high-probability short-term downside opportunity, ideal for traders who look to capitalize on momentum reversals and clean structural shifts.
✳️ Market Snapshot
Structure Shift: Price forms a lower high, signaling potential weakness ahead.
Momentum Turn: Sellers are reclaiming control after a failed bullish push.
Entry Zone: A defined area where downside acceleration is likely to begin.
Risk Control: Stop-loss levels remain tight (around 40–50 pips) to safeguard capital.
💰 Trading Outlook
Consider short positions near the highlighted resistance or confirmation candle.
Targets: Short-term take-profits at recent support or liquidity sweep zones.
Tip: Keep position sizing aligned with your risk plan — focus on accuracy, not aggression.
⚠️ Trader’s Note
This signal is intended for short-term momentum trading. Always apply your own analysis, follow strict risk management, and treat this as a trade idea, not financial advice.

GOLD TRAPPED ORDERFLOW OB DAILY TIME FRAME-NEUTRAL BIASMONTHLY-respect candle/rejection candle
WEEKLY-Bullish orderflow
DAILY-trapped orderflow
NB.Wait for one side of the PD-array to be disrespected
NO clear context
H1-LTF entry model
APPLY RISK MANAGEMENT
