GOLD ROUTE MAP UPDATEHey Everyone,
We kicked off the week strong with our bullish targets at 3458 and then 3477 getting hit. Price is now facing rejection at this zone.
If EMA5 breaks above this level and locks, we could see an extension toward 3497.
If not, we may revisit lower Goldturns to test support before the weighted level bounces.
We will keep the above in mind when taking buys from dips. Our updated levels and weighted levels will allow us to track the movement down and then catch bounces up.
We will continue to buy dips using our support levels taking 20 to 40 pips. As stated before each of our level structures give 20 to 40 pip bounces, which is enough for a nice entry and exit. If you back test the levels we shared every week for the past 24 months, you can see how effectively they were used to trade with or against short/mid term swings and trends.
The swing range give bigger bounces then our weighted levels that's the difference between weighted levels and swing ranges.
BULLISH TARGET
3458 - DONE
EMA5 CROSS AND LOCK ABOVE 3458 WILL OPEN THE FOLLOWING BULLISH TARGETS
3477 - DONE
EMA5 CROSS AND LOCK ABOVE 3477 WILL OPEN THE FOLLOWING BULLISH TARGET
3497
EMA5 CROSS AND LOCK ABOVE 3497 WILL OPEN THE FOLLOWING BULLISH TARGET
3513
BEARISH TARGETS
3439
EMA5 CROSS AND LOCK BELOW 3439 WILL OPEN THE FOLLOWING BEARISH TARGET
3417
EMA5 CROSS AND LOCK BELOW 3417 WILL OPEN THE FOLLOWING BEARISH TARGET
3395
EMA5 CROSS AND LOCK BELOW 3395 WILL OPEN THE SWING RANGE
3369
3352
EMA5 CROSS AND LOCK BELOW 3395 WILL OPEN THE SECONDARY SWING RANGE
3336
3315
As always, we will keep you all updated with regular updates throughout the week and how we manage the active ideas and setups. Thank you all for your likes, comments and follows, we really appreciate it!
Mr Gold
GoldViewFX
GOLD trade ideas

Lingrid | GOLD Quick Sell-Off Following Resistance Rejection The price perfectly fulfilled my previous idea . OANDA:XAUUSD is approaching the 3,430 resistance zone following a strong upward leg, showing early signs of exhaustion. The chart structure is forming within an upward channel but facing strong rejection at the red trendline resistance. If sellers maintain pressure, a decline toward 3,386–3,360 support becomes the primary scenario. Broader context suggests bearish momentum could strengthen if this breakdown accelerates since the market at key resistance.
📉 Key Levels
Sell trigger: Rejection from 3,430 resistance
Sell zone: 3,430–3,435 ideal short entry region
Target: 3,386 → 3,360 downside objective
Invalidation: Breakout above 3,440 resistance
💡 Risks
Unexpected weakness in USD could push gold higher instead of lower.
Safe-haven demand from geopolitical or macro shocks may boost gold.
Weak economic data Core PCE Price Index.
If this idea resonates with you or you have your own opinion, traders, hit the comments. I’m excited to read your thoughts!

GOLD 4H CHART ROUTE MAP UPDATE & TRADING PLAN FOR THE WEEKHey Everyone,
Please see follow up update on our 4chart idea which is still valid and in play.
We got our Bullish target 3424 last week and finished off with ema5 cross and lock above this level opening 3499, as a open gap and 3424 is now our support gap. If ema5 fails to lock below 3424 we are likely to see our open gap above at 3499 tested.
We will keep the above in mind when taking buys from dips. Our updated levels and weighted levels will allow us to track the movement down and then catch bounces up.
We will continue to buy dips using our support levels taking 20 to 40 pips. As stated before each of our level structures give 20 to 40 pip bounces, which is enough for a nice entry and exit. If you back test the levels we shared every week for the past 24 months, you can see how effectively they were used to trade with or against short/mid term swings and trends.
The swing range give bigger bounces then our weighted levels that's the difference between weighted levels and swing ranges.
BULLISH TARGET
3424 - DONE
EMA5 CROSS AND LOCK ABOVE 3424 WILL OPEN THE FOLLOWING BULLISH TARGETS
3499
EMA5 CROSS AND LOCK ABOVE 3499 WILL OPEN THE FOLLOWING BULLISH TARGET
3561
BEARISH TARGETS
3347
EMA5 CROSS AND LOCK BELOW 3347 WILL OPEN THE FOLLOWING BEARISH TARGET
3277
EMA5 CROSS AND LOCK BELOW 3277 WILL OPEN THE SWING RANGE
3234
3171
EMA5 CROSS AND LOCK BELOW 3171 WILL OPEN THE SECONDARY SWING RANGE
3089
2996
As always, we will keep you all updated with regular updates throughout the week and how we manage the active ideas and setups. Thank you all for your likes, comments and follows, we really appreciate it!
Mr Gold
GoldViewFX

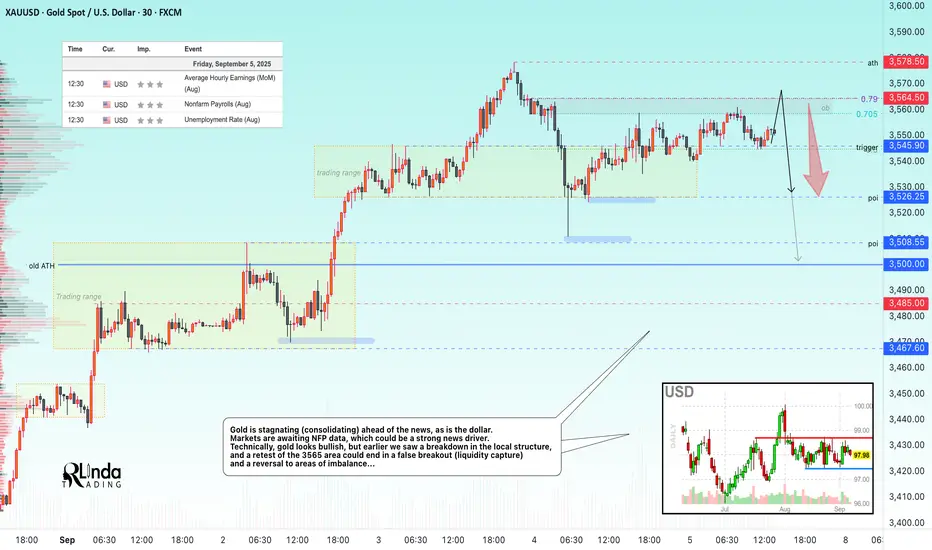
GOLD → ATH retest before NFP. High risk level...FX:XAUUSD remains in a bullish trend, but short-term dynamics depend on NFP. A break above $3578 will open the way to new highs, but profit-taking at record levels could increase volatility.
Gold remains strong ahead of US NFP data, which may confirm the Fed's policy easing. Weak data (forecast: +75K new jobs) will reinforce expectations of a rate cut and support gold. However, the risk of a correction is quite high, and any nuances could trigger liquidation. Weak employment data, namely rising unemployment and low ADP figures, are strengthening bets on a Fed rate cut, which overall only increases interest in the metal.
Resistance levels: 3564.5, 3578.5
Support levels: 3545.9, 3526, 3508
NFP data will determine the short-term trend. A weak report will lead to growth to $3600+, while a strong report will lead to a correction to 3450-3400. Technically, I expect a correction after the local bullish structure breaks down. It is not worth trading on the news; it is better to wait 20-40 minutes after the release to make decisions based on fundamental data.
Best regards, R. Linda!
GOLD DAILY CHART ROUTE MAPDaily Chart Update
Range Break & Gap Confirmation
As anticipated in our previous update, price finally pushed through for a test of 3433, confirming the strength of the upside momentum we discussed. This test has now produced a candle body close gap open for 3564, giving us our next long range target. An EMA5 lock will serve as added confirmation for continuation toward this zone.
Current Outlook
🔹 3433 Tested & Confirmed
Just as we analysed, bulls carried price into 3433. With the ceiling tested, attention now shifts to whether price can sustain above.
🔹 Fresh Gap Toward 3564
The candle close opens a measured long range gap up to 3564. This becomes the new target zone if bullish structure continues to hold.
🔹 EMA5 as Key Confirmation
An EMA5 lock would further solidify momentum and strengthen conviction for follow through toward 3564.
Updated Key Levels
📉 Support – 3272
Remains the pivotal floor. As long as this level holds, downside risk is contained.
📈 Resistance – 3433
Now tested. Bulls will look for a firm hold above to unlock the 3564 gap.
🎯 Next Upside Objective – 3564
Gap target now in play, contingent on EMA5 confirmation.
Thanks as always for your support,
Mr Gold
GoldViewFX

GOLD (XAUUSD): The Next Potential Resistances
As Gold is now trading in a no man's land, here are
2 potentially strong resistances that I spotted.
Psychological Resistance 1: 3550
Psychological Resistance 2: 3600
The price is heading toward Resistance 1.
It will most likely be the next goal for the buyers.
❤️Please, support my work with like, thank you!❤️
I am part of Trade Nation's Influencer program and receive a monthly fee for using their TradingView charts in my analysis.

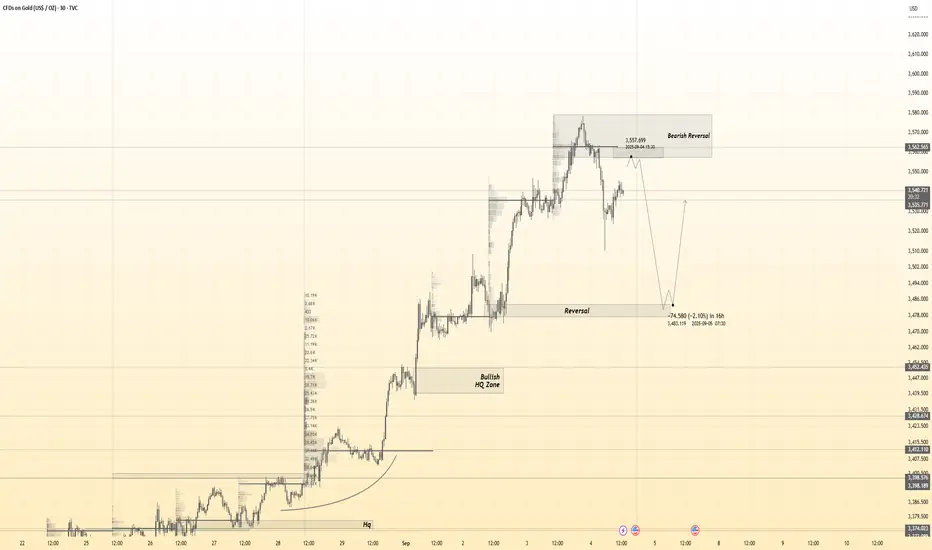
Gold 30Min Engaged ( Buy And sell Reversal Entry Detected )Time Frame: 30-Minute Warfare
Entry Protocol: Only after volume-verified breakout
🩸Bearish Reversal : 3557
🩸Bullish Reversal : 3484
➗ Hanzo Protocol: Volume-Tiered Entry Authority
➕ Zone Activated: Dynamic market pressure detected.
The level isn’t just price — it’s a memory of where they moved size.
Volume is rising beneath the surface — not noise, but preparation.
🔥 Tactical Note:
We wait for the energy signature — when volume betrays intention.
The trap gets set. The weak follow. We execute.
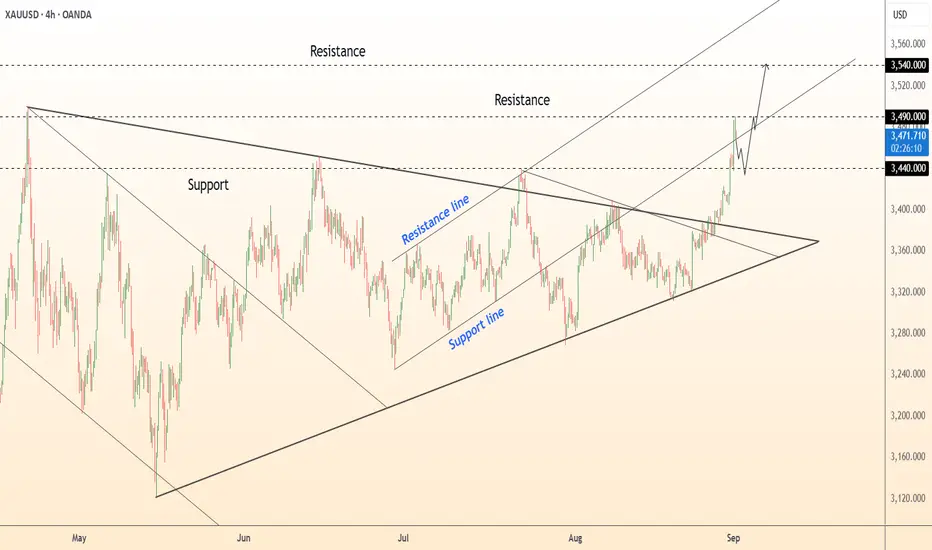
GOLD (XAUUSD): Bullish Confirmation After News
Gold finally turned bullish after US news.
I see a strong intraday bullish confirmation:
a breakout of a resistance line of a horizontal range on an hourly
time frame with a high momentum candle, provide a valid Change of Character.
We can expect growth now.
❤️Please, support my work with like, thank you!❤️
I am part of Trade Nation's Influencer program and receive a monthly fee for using their TradingView charts in my analysis.

XAUUSD Short: Correction from Current HighsHello, traders! The prior price auction for XAUUSD was contained within a horizontal range, bounded by the Demand zone 2 near 3335. A key pivot point low initiated a strong bullish impulse, resulting in a breakout from this range and establishing the current bullish market structure, which transitioned the market into a new directional phase.
Currently, the price action is being guided by a well-defined ascending channel. The most recent impulse wave has carried XAU to the upper boundary of this channel, which represents dynamic resistance. The auction is now testing this ceiling after a strong rally, a key area where sellers may re-emerge to challenge the bullish initiative.
My scenario anticipates a corrective move from the current highs. The expectation is that the channel's resistance line will hold, leading to a rejection and a downward rotation back towards the channel's support. A failure to break higher would confirm that a short-term correction is likely. The take-profit is therefore set at 3410 points, targeting the confluence of the ascending channel's support line and the 3405 - 3415 demand area. Manage your risk!

Lingrid | GOLD Employment Data Play - Long OpportunityOANDA:XAUUSD is climbing inside an upward channel, bouncing steadily from support and pushing through recent resistance with bullish momentum. The structure shows higher highs and higher lows, confirming the trend continuation bias. A clean hold above 3,500 keeps the path open for another push higher. Momentum favors retesting the resistance zone, where a breakout could unlock more upside potential.
📉 Key Levels
Buy trigger: Break above 3,505
Buy zone: 3,500–3,520 support retest
Target: 3,600–3,615 zone
Invalidation: Break below 3,460 support
💡 Risks
Stronger-than-expected NFP data today could fuel USD strength and pressure gold lower.
Failure to hold the 3,505 support may shift momentum to the downside.
Geopolitical or macro shifts driving risk-on sentiment could reduce safe-haven demand for gold.
If this idea resonates with you or you have your own opinion, traders, hit the comments. I’m excited to read your thoughts!

Best Trend-Following Price Model For Gold XAUUSD Trading
In this article, I will show you a powerful chart setup for profitable trend following trading Gold. I will break down how it works with examples.
Here is how this price model looks:
It is based on 5 important conditions that should be strictly met.
1 - Gold should trade in a global bullish trend.
The price should consistently update Higher Highs HH and Higher Lows HL.
2 - Higher Lows should respect a rising trend line, acting as a support.
It should be respected by at least 3 consequent bullish movements from that.
3 - After a formation of a high above a trend line, the price should start a correctional movement in a minor trend in a bullish flag pattern.
It can be a horizontal, parallel or expanding channel.
4 - Correcting, Gold should test a major rising trend line, being within a flag.
5 - A bullish movement should initiate after a trend line test and the price should break and close above a resistance line of a flag.
When all these 5 conditions are met, we can expect a bullish movement on Gold at least to a level of a current high from where a correction started.
A broken resistance line of a flag and a major rising trend line will compose a safe zone to buy Gold from.
The best time frame for this model will be a daily.
Let's study a real example of such a price model on Gold chart on a daily.
Examine a price chart of Gold on a daily time frame above.
All 5 conditions are met, and we can anticipate a rise to the underlined red resistance.
Our buy zone will be based on a broken resistance of the flag and a major rising trend line.
You can see that our goal was successfully reached.
Here is the proof -
This price model will help you to predict strong bullish waves , trading Gold. A simple combination of a trend analysis and a price action are the 2 basic components that you need to study to identify that properly.
❤️Please, support my work with like, thank you!❤️
I am part of Trade Nation's Influencer program and receive a monthly fee for using their TradingView charts in my analysis.

DeGRAM | GOLD exited from the triangle📊 Technical Analysis
● XAU/USD broke out of a prolonged consolidation wedge, surging above 3,440 and validating a bullish continuation setup.
● Price is targeting the 3,490 resistance; a breakout would open the path toward 3,540, with 3,440 now acting as a strong support floor.
💡 Fundamental Analysis
● Softer US inflation metrics and a pullback in yields are pressuring the dollar, while heightened geopolitical risks continue to fuel safe-haven demand for gold.
✨ Summary
Bullish above 3,440; targets 3,490 → 3,540. Invalidation on a close below 3,440.
-------------------
Share your opinion in the comments and support the idea with a like. Thanks for your support!
Hellena | GOLD (4H): LONG to resistance area of 3460.Dear colleagues, the idea is generally simple and clear.
In the upward movement of waves “3”, “4”, “5” the price should update the maximum of waves ‘D’ and “B” 3448.87.
This means that we should expect the price in the area of 3460.
The target is quite close and I think there is reason to believe that it will be reached next week.
Manage your capital correctly and competently! Only enter trades based on reliable patterns!

THE KOG REPORT - UpdateEnd of week update from us here at KOG:
An interesting end to a very interesting month on not just gold but the markets as a hole. Our KOG Report from Sunday worked to a tee but due to it being the last trading day of the month we took the short from yesterday into our Excalibur target and called it a day. What we didn't expect was that target would give us the RIP and then continue to follow the red boxes upside. Having said that, we're glad to have completed all of our daily and weekly targets and our current algo targets.
Now, we've had a slight reaction from the resistance level 3450 which may get a retest again and this time slightly higher unless we break below the 3440 level before the close.
Other than that, I'm pretty sure we're on for another 100% week on LiTE and missed 2 targets this week out of the many posted.
RED BOX TARGETS:
Break above 3375 for 3378✅, 3383✅, 3385✅, 3388✅ and 3392✅ in extension of the move
Break below 3365 for 3355, 3351, 3345 and 3335 in extension of the move
Wishing you all a great weekend ahead and we'll see you on Sunday for the KOG Report.
As always, trade safe.
KOG

XAU/USD 1H | Correction in the Cards… or More Bullish Run Ahead?Have we reached peak gold… or is the rally just taking a rest?
Gold has climbed to record highs, but the charts may be flashing warning signs. With RSI pushing into extreme overbought territory and a rising wedge pattern forming, is this the moment where bulls take a breather… or are we about to see another explosive move?
Technical Overview
Timeframe: XAU/USD – 1H
Trend: Overall Bullish (confirmed on higher timeframes)
Divergence: Significant Bearish Divergence spotted on 1H; no divergence on 4H
RSI Level: At 79.6 — indicates overbought conditions that often precede a pullback at 4H TF.
Pattern: Rising Wedge forming on the 1H
Harmonics: NIL
Bias: Bearish
Strategy: Sell Short Entry at breakout of previous Higher Low (HL)
Trade Setup
Entry: Short Sell @ 3465
Stop Loss: 3512
Take Profit: 3418
Supporting Fundamentals:
All-Time Highs Reached: Gold has surged above $3,500, supported by inflation concerns, Fed rate cut expectations, and safe-haven demand
Institutional Demand: Ongoing central bank accumulation and ETF inflows are fueling price strength
Macro Tailwinds: Heightened geopolitical risks and weakening USD sentiment continue to benefit gold as a refuge asset.
These fundamentals may remain bullish long-term, but with overbought conditions and chart warning signs, a temporary correction looks more probable first.
Will gold finally take a breather from the rally, or is this overbought signal just a minor pause?
Drop your thoughts below!
Like, share, and follow for more high-confluence trade setups.
#XAUUSD #GoldTrading #Forex #TradingView #TechnicalAnalysis #BearishDivergence #RSIOverbought #RisingWedge #SafeHaven #GoldCorrection #HarmonicPattern #CommodityTrading #GoldPrice #TradeSetup #ForexSignals #SwingTrading #MacroTrading #RiskManagement #TradeSmart #MarketAnalysis #SafeHavenAsset #GoldPullback #FedPolicy #Geopolitics #CentralBank #ETFInflows #PriceAction #ChartPatterns #1HChart #TradingStrategy
⚠️ Disclaimer: This is not financial advice. Always assess your own risk before trading.

Trading strategy is still BUYGold has reached Target 3320 and continued to see some profit taking from investors in the Asian session. Today's Gold price may move similarly to yesterday with Asia and Europe falling and the US rising. Continue to wait for corrections to Buy is today's intraday strategy. Today's Target 3328. If broken absolutely do not SELL until there is at least confirmation from the H4 candle selling pressure.
BUY at support zones when there is confirmation from buyers entering the market. Attention support zones 3402-3390-3375

Gold consolidating near resistance as momentumGold is currently consolidating near resistance as momentum tests the critical 3400 level. Despite this resistance zone, the broader technical outlook remains bullish Fundamentally, a deeper corrective move may be limited due to the following factors:
A weaker U.S. Dollar, which continues to support gold prices Increased probability of a Fed rate cut in September, adding pressure to the Federal Reserve and reducing yields, which typically benefits non-yielding assets like gold From a technical perspective, the bullish structure remains intact. A clean break and sustained move above the 3400 level could open the door to further upside, with the next potential resistance seen around 3425 to 3450.
However, short-term movement will likely depend on incoming U.S. economic data. Traders should watch for price reaction at current levels for signs of continuation or rejection.
You May find more details in the chart,
Trade wisely best of Luck Guys.
Ps; Support with like and comments for better analysis.

Gold 30Min Engaged ( Bullish Reversal Entry Detected )Time Frame: 30-Minute Warfare
Entry Protocol: Only after volume-verified breakout
🩸Bullish Reversal - 3455
➗ Hanzo Protocol: Volume-Tiered Entry Authority
➕ Zone Activated: Dynamic market pressure detected.
The level isn’t just price — it’s a memory of where they moved size.
Volume is rising beneath the surface — not noise, but preparation.
🔥 Tactical Note:
We wait for the energy signature — when volume betrays intention.
The trap gets set. The weak follow. We execute.
Gold: Bull Run Fading: Is 3335–3350 Barrier the Turning Point?Gold: Bull Run Fading: Is 3335–3350 Barrier the Turning Point?
Gold may be nearing the end of its bullish run. There’s a strong resistance zone between 3335 and 3350, and price action is already showing signs of weakness—even though it still looks slightly bullish on the surface.
Momentum is fading, and based on the chart, there’s a good chance Gold could start pulling back from the current levels, especially around the 3335 zone.
You may watch the analysis for further details!
Thank you!

Xauusd analysis is ReadyThis analysis shows a bullish setup for Gold (XAU/USD). Price is moving in an ascending channel with entry near 3,407. The first target is set at 3,429 and the second target at 3,471, while the stop loss is placed below 3,379.

SELLSELLSELL📊 Technical Analysis
● XAU/USD failed to sustain above 3,558 after a brief breakout, with rejection confirming resistance and signaling renewed bearish pressure.
● The ascending wedge structure broke to the downside, and a retest of 3,550 could lead to a drop toward supports at 3,540 and 3,527.
💡 Fundamental Analysis
● Renewed strength in the US dollar, supported by firm Treasury yields and cautious Fed rhetoric, is weighing on gold, limiting upside momentum.
✨ Summary
Bearish below 3,558; targets 3,540 → 3,527. Invalidation on a close above 3,560.
If you are a novice trader and cannot achieve perfect profits through trading alone, and always end up losing money, then you must be unable to grasp the perfect buying and selling points! I hope my analysis can help you.

DeGRAM | GOLD reached the $3540📊 Technical Analysis
● XAU/USD surged into the 3,540 zone but shows exhaustion candles near resistance, with the chart projecting a corrective pullback.
● A retest of 3,500 support is likely, and failure to hold risks further downside toward 3,440 within the broader consolidation structure.
💡 Fundamental Analysis
● Hawkish Fed comments and stabilizing US yields are reviving dollar strength, which could cap gold’s upside in the short term.
✨ Summary
Bearish below 3,540; targets 3,500 → 3,440. Invalidation on a close above 3,545.
-------------------
Share your opinion in the comments and support the idea with a like. Thanks for your support!

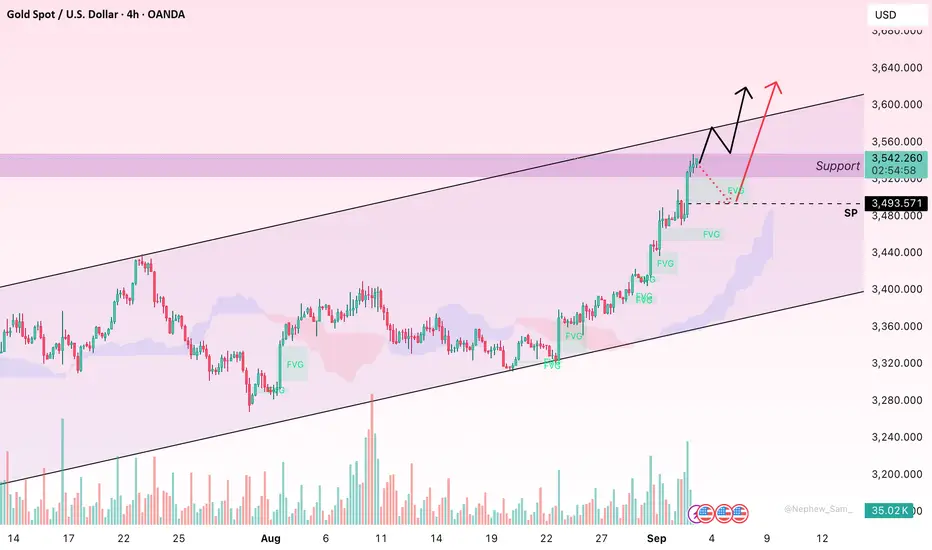
Gold Breaks New Highs, Momentum Still Favouring BullsHello friends, the past week has been quite rewarding for gold as it surged through major resistance levels and printed fresh highs. On the H4 chart, the trend looks very clear: price action is holding firmly above the Ichimoku cloud, with Tenkan sitting comfortably above Kijun, and the cloud slope widening further. Multiple Fair Value Gaps (FVGs) remain unfilled below, showing that buying momentum is powerful and liquidity is being left behind — a signature of a strong rally, not just a short-term move.
In terms of price action, the immediate resistance lies between $3,535–3,560. A clean H4 close above this area may unlock the next natural expansion towards $3,580–3,600. On the downside, layered supports are found at $3,520–3,505, then $3,485–3,470, and deeper at $3,440–3,420, coinciding with the upper edge of the cloud, often tested during medium-term uptrends.
Fundamentally, the environment still favours buyers: safe-haven demand is rising, the Fed is expected to ease policy sooner, and the USD is weakening, all adding fuel to the bullish case. Unless gold closes back into the cloud and loses the $3,440–3,420 zone, the probability of trend continuation remains high.
Do you think gold can stretch further from here? Share your thoughts below!