XAUUSD M30 TIME FRAME CHART ANALYSIS TARGET HIT Gold running 350++pips hit
Xauusd King here
Today 1000+pips hit gold
If you don't know about market don't trade
Trade ideas

XAUUSD: Exploring Potential 30% Upside in Safe-Haven Asset XAUUSD: Exploring Potential 30% Upside in Safe-Haven Asset Amid Geopolitical Tensions – SWOT and Intrinsic Value Insights
📊 Introduction
As of October 28, 2025, XAUUSD (Gold/USD) is experiencing a short-term correction following record highs above $4,300 earlier this month, trading around $3,950 per ounce. This pullback reflects improved risk appetite in equity markets amid stabilizing U.S. economic data and reduced recession fears, with the S&P 500 up 2% week-to-date. However, broader macroeconomic factors, including persistent inflation at 3.2% year-over-year and central bank gold purchases exceeding 800 tonnes year-to-date, underpin a supportive environment. Sector dynamics highlight gold's role as a hedge against geopolitical risks, such as escalating Middle East tensions and U.S.-China trade uncertainties, though volatility is elevated due to a strengthening USD index near 105.
🔍 SWOT Analysis
**Strengths 💪**: Gold serves as a proven inflation hedge and store of value, with central banks accumulating over 900 tonnes projected for 2025 per analyst estimates, driving demand. Its liquidity is unmatched, with daily trading volumes surpassing $200 billion, and physical holdings in ETFs like GLD have risen 15% year-over-year to 1,200 tonnes. Low correlation to equities (0.2 beta) enhances portfolio diversification, while above-ground stocks of approximately 218,000 tonnes ensure scarcity amid annual mine production of just 3,500 tonnes.
**Weaknesses ⚠️**: As a non-yielding asset, gold incurs opportunity costs in high-interest environments, with U.S. 10-year real yields at 1.8% pressuring holdings. All-in sustaining costs (AISC) for miners have risen 8% to around $1,600-1,700 per ounce due to energy and labor inflation, per industry reports, potentially squeezing margins if prices dip. Storage and insurance fees add 0.5-1% annual costs for physical investors.
**Opportunities 🌟**: Heightened geopolitical risks, including potential escalations in Ukraine and Taiwan, could boost safe-haven inflows, similar to the 25% price surge post-2024 elections. Monetary policy easing by the Fed (projected 50bps cuts by year-end) and ECB may weaken the USD, favoring gold, with forecasts targeting $4,500+ by mid-2026. Emerging market demand, led by India and China (combined 1,500 tonnes annual consumption), offers growth amid de-dollarization trends.
**Threats 🚩**: A stronger USD from hawkish Fed pivots or robust U.S. growth could cap upside, as seen in the recent 5% correction. Competition from high-yield bonds and cryptocurrencies (Bitcoin up 25% YTD) diverts capital, while environmental regulations may increase AISC by 10-15% over the next five years. Oversupply risks from recycled gold (1,200 tonnes annually) persist if economic slowdowns reduce jewelry demand.
💰 Intrinsic Value Calculation
Adopting a value investing approach for commodities, we estimate gold's intrinsic value using a monetary backing model, which assesses its role as a reserve asset relative to money supply, incorporating a margin of safety (20% discount). Key inputs from public data: U.S. M2 money supply at $22.195 trillion, U.S. gold reserves at 8,133 tonnes (≈261.5 million ounces), and an assumed fair coverage ratio of 6% (historical average post-Bretton Woods, adjusted for modern dilution; current coverage ≈4.7% at $3,950/oz).
Formula: Intrinsic Value per Ounce = (M2 Money Supply × Coverage Ratio) / Gold Reserves in Ounces
- M2 × 6% = $22.195T × 0.06 ≈ $1.332T
- $1.332T / 261.5M ounces ≈ $5,092
Apply 20% margin of safety: $5,092 × 0.8 ≈ $4,074
At current price ≈$3,950, XAUUSD appears undervalued by ≈3-29% (factoring upside to $5,092 fair value aligned with central bank demand and inflation metrics). No debt flags apply directly, but sustainability relies on demand outpacing monetary expansion. 📈 Undervalued.
📈 Entry Strategy Insights
Institutional strategies emphasize support zones near $3,900-3,940 (aligned with 50-day SMA and recent lows) for unleveraged, long-term positions through dollar-cost averaging (DCA). Scale in during 3-5% dips, leveraging non-repainting volume indicators to validate rebounds from oversold levels. Ideal for building 5-10% allocations over 1-3 months, with targets at $4,200 for partial exits on breakouts. 🚀 Spot zones.
⚠️ Risk Management
Allocate 1-5% of portfolio to gold to buffer against volatility, diversifying with bonds or equities for balance. Implement trailing stops 5-10% below entry (e.g., $3,750) and maintain long-term holds if macroeconomic hedges strengthen, tracking central bank reports and USD trends. Caution on sharp reversals from rate hikes or equity rallies.
🔚 Conclusion
Gold's entrenched role as a monetary hedge, coupled with undervalued metrics and robust demand drivers, supports potential growth to $4,074+, with safety margins embedded. Key takeaways: Prioritize geopolitical monitoring for demand spikes, cross-verify money supply data independently.
This is educational content only; not financial advice. Always conduct your own due diligence.

GOLD XAUUSD IF buyers fails to reclaim 4030 ,it could be a technical sell continuation, however if the break out of 4030 we a heading to 4130 ASAP
DEMAND FLOOR ON 3945-3940 WILL BE WATCHED.
THE RATE CUT ,OR HOLD WILL BE THE NEXT VOLATILITY.
#GOLD

XAUUSD ForecastGold has broken out of the descending wedge pattern, signalling a potential bullish reversal. Price is currently retesting the breakout zone near the 3,980–4,000 support area. A successful bounce from this level could trigger an upward move toward the first target at 4,045 and the second target around 4,100. Holding above the retest zone will confirm bullish momentum continuation.
"Thank you for your support! If you found this idea valuable or learned something new, please consider liking and leaving a comment. I’d really appreciate hearing your feedback and thoughts

XAUUSD M30 TIME FRAME CHART ANALYSIS TARGET COMPLETELGold sell 300++ pips target completel
And FOMC NEWS COMING SOON FOMC CHART aslo coming 📈🔥😎

XAUUSD: Bullish Reversal Setup From Triangle SupportHello everyone, here is my breakdown of the current Gold setup.
Market Analysis
Gold (XAUUSD) continues to trade within a larger bullish market structure, maintaining higher lows above its key ascending Trend Line. After a strong impulsive rally that pushed the price above the 4,200 resistance, the market faced rejection near the top of the Range and entered a corrective phase. This correction evolved into a triangle pattern, with price now testing the Triangle Support Line, aligning closely with the horizontal Support area around 4,020 – 4,000 — a historically important demand zone.
Currently, the price is consolidating near the lower boundary of this structure, showing early signs of stabilization. This region also coincides with the previous breakout point, adding further confluence for potential buyer interest.
My Scenario & Strategy
I expect the price to hold above the Triangle Support Line and form a bullish reversal structure, signaling that buyers are once again defending this level. A confirmed breakout above the Triangle Resistance Line would indicate renewed bullish momentum and a potential continuation of the overall uptrend.
My primary target zone lies around 4,215, where previous resistance and the upper range boundary converge. However, if the support near 4,000 fails to hold, it could trigger a deeper correction toward 3,950, where the next demand zone is located. This setup offers a favorable risk-to-reward opportunity for traders anticipating a rebound from a major technical confluence zone.
That's the setup I'm tracking. Thank you for your attention, and always manage your risk.

Gold Volatility Over? Maybe Not Yet!Gold volatility hit new heights last week when a push from opening levels at 4243 on Monday (Oct 20th) up to a new record high of 4381 was immediately followed on Tuesday (Oct 21st) by a crash back to lows at 4004 as traders were forced to liquidate weak long positions after key short term technical support levels gave way.
If price moves last week were dominated by positioning, moves in the week ahead could be more events driven providing traders with a lot for to focus on and potentially further excessive volatility to navigate.
Weekend news has so far provided positive soundbites on progress towards de-escalating trade tensions between the US and China. President Trump has stated he is confident of a deal after US and Chinese trade representatives concluded a 2-day meeting in Malaysia (Reuters), while US Treasury Secretary Scott Bessant commented that he believes the two negotiating teams have agreed on a successful framework for President Trump and President Xi to discuss when they meet on Thursday (Oct 30th), their first face to face meeting in 6 years. This has already led to a sell-off in Gold prices from Friday’s closing level at 4112 to a low of 4053 this morning.
Geo-politics remains in focus as Ukrainian and Russian forces trade drone strikes in Ukraine, while a Kremlin spokesperson said it was too early to talk about the cancellation of a meeting between President’s Putin and Trump, despite the White House’s blacklisting of Russia’s main 2 oil producers, Rosneft and Lukoil last Wednesday complicating the issue.
Also on Wednesday evening, the Federal Reserve announce their next interest rate decision at 1800 GMT, with the press conference led by Chairman Jerome Powell commencing at 1830 GMT. While a 25bps (0.25%) rate cut is expected from Fed policymakers, the press conference could be the main volatility driver for Gold prices, as Chairman Powell provides traders with an update on whether a further rate cut is likely in December as anticipated, or if an on-going US government shutdown, which has stopped key US economic growth and labour market data releases, has clouded the issue.
Technical trends may also have a significant impact on where Gold moves next.
Technical Update: Is the Bollinger Mid-Average Key?
Gold’s sharp 8.60% sell-off from the October 20th all-time high at 4381 prompted speculation over a possible sentiment shift that could mean an end to the recent strong advance. However, the rising Bollinger mid-average has so far contained the decline as can be seen on the chart below.
This rising Bollinger mid-average, currently at 4069, held the latest Gold decline, suggesting it might be a key support focus again this week. How the Gold price behaves around this level on a closing basis may offer clues to the next directional bias, either marking stabilisation or opening the risk of a deeper phase of weakness.
If the Bollinger Mid-Average Holds Price Weakness:
If the support at 4069 continues to hold on a closing basis, Gold may see renewed attempts at strength. Traders could then be focused on how potential resistance at 4150, which is the 38% Fibonacci retracement of the latest decline, is defended.
While the mid-average support remains intact, a closing break above 4150, could lead to further upside possibilities, shifting focus to 4239, the 61.8% retracement of the recent decline, or even extending toward 4381 the October 20th all-time high again.
If the Bollinger Mid-Average Support is Broken:
While 4069 has so far contained Gold’s recent selling pressure, it may not hold indefinitely. A closing break below this level might raise the risk of a more extended phase of weakness, opening deeper corrective themes.
Closes below 4069 in Gold could shift trader focus to 3957, which is the 38.2% Fibonacci retracement of the July 30th to October 20th rally. If this support gives way, downside risks may in turn extend toward 3825, a level which marks the deeper 50% retracement level.
The material provided here has not been prepared accordance with legal requirements designed to promote the independence of investment research and as such is considered to be a marketing communication. Whilst it is not subject to any prohibition on dealing ahead of the dissemination of investment research, we will not seek to take any advantage before providing it to our clients.
Pepperstone doesn’t represent that the material provided here is accurate, current or complete, and therefore shouldn’t be relied upon as such. The information, whether from a third party or not, isn’t to be considered as a recommendation; or an offer to buy or sell; or the solicitation of an offer to buy or sell any security, financial product or instrument; or to participate in any particular trading strategy. It does not take into account readers’ financial situation or investment objectives. We advise any readers of this content to seek their own advice. Without the approval of Pepperstone, reproduction or redistribution of this information isn’t permitted.

GOLD (XAUUSD): Short Trade Before the FED
I see an intraday pullback trade on Gold ahead of
FOMC & FED Interest Rate Decision today.
The price will likely retrace from the underlined resistance,
following a confirmed bearish imbalance and a formation
of a double top pattern.
Expect a bearish movement at least to 3988 level.
❤️Please, support my work with like, thank you!❤️
I am part of Trade Nation's Influencer program and receive a monthly fee for using their TradingView charts in my analysis.

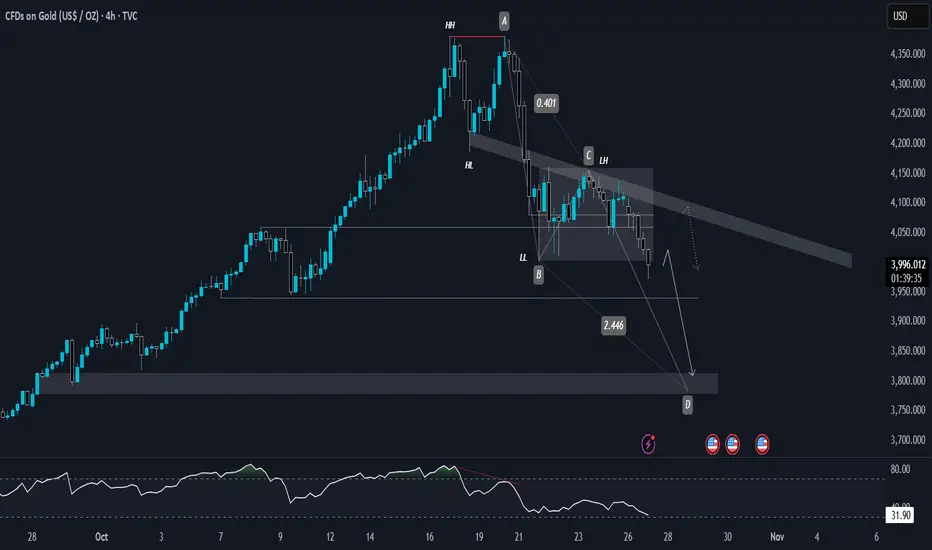
XAU/USD – Triangle Breakdown Potential Toward 3,900 ZoneGold (XAU/USD) has been in a strong uptrend for the past few months, recently reaching new highs above US $4,300 before showing signs of slowing down. In your chart, the price has formed a triangle pattern (labelled A–B–C–D) after a sharp drop from the peak. This pattern usually means the market is taking a pause and preparing for the next move — either a breakout up or down. Based on the structure, momentum, and recent price behavior, the pattern looks more likely to break downward, which could send the price toward the support zone around US $3,900–3,950 (the blue area on your chart).
From a technical view, this makes sense because:
The strong rally lost strength after the sharp fall from the top.
The triangle is getting tighter, meaning volatility is compressing before a breakout.
Indicators like the RSI and Awesome Oscillator (AO) are showing bearish divergence, signaling weaker buying pressure.
If price breaks below US $4,100–4,050, it would confirm a bearish breakout and likely trigger a move to the support area marked in blue.
From a fundamental view, gold recently rallied due to expectations of Federal Reserve rate cuts, high inflation, and strong central bank demand. But in late October 2025, the market is cooling because the U.S. dollar has strengthened slightly and Treasury yields have bounced, causing short-term selling pressure on gold. Many traders are also taking profits after such a strong run.
Putting both sides together, the technical chart and the current fundamentals support a short-term bearish correction — a pullback that could test the US $3,900 zone before the next big move. However, if the price fails to break below the triangle and instead closes above US $4,180–4,250, it would cancel the bearish setup and signal a possible continuation of the uptrend toward new highs above US $4,350–4,400.
In short:
Bias: Short-term bearish correction
Breakdown trigger: Below US $4,050–4,100
Target zone: Around US $3,900
Invalidation: Above US $4,250

Gold Elliott Wave Analysis – Potential Wave (4) Completion ZoneGold (XAU/USD) on the daily chart appears to be completing a classic Elliott Wave 5-wave impulse structure. After a strong rally into the wave (3) high, price is currently retracing toward the projected wave (4) correction zone.
The highlighted support area aligns with key Fibonacci retracement levels:
0.5 retracement: around $3,845
0.618 retracement: around $3,718
This region also coincides with the lower boundary of the ascending channel, adding confluence for potential bullish reversal.
If wave (4) finds support within this zone and maintains structure, a new impulsive rally toward wave (5) could begin — targeting the upper trendline resistance near $4,500–$4,600.

GOLD (XAU/USD): Important Bearish Breakout📉GOLD has a high potential to continue falling
after a breakout of a key daily/intraday horizontal support.
Next supports: 3900

XAU USD Last bullish leg ?Price has broken short-term bearish structure and moved above the moving-average channel with strong momentum, indicating a shift toward bullish control. The rising trendline is holding as support, confirming structural reversal.
Fibonacci levels provide clear upside targets, with 38.2% at 4040–4050 as the first objective, followed by a constrained upper target near 4070, just below the 61.8% retracement and prior supply zone.
As long as price holds above the breakout zone and trendline, continuation toward 4040–4070 remains the most probable outcome.

GOLD 4H | Harmonic AB=CD Bearish Reversal in PlayGold recently formed a clear double top at the all-time high (ATH), accompanied by a bearish divergence on higher timeframes — signaling exhaustion of bullish momentum. That divergence has played out perfectly, aligning with the current bearish market structure.
The price has now broken below the key accumulation range between 4000 and 4149, confirming a shift in sentiment. With the trend consistently printing lower lows (LL) and lower highs (LH), the overall market bias remains bearish.
🔹 Technical Breakdown
We currently have a bearish AB=CD pattern completing near the 3800 zone, which aligns with the Fibonacci golden ratio (0.618) on the D leg.
Although AB=CD is traditionally a bullish harmonic pattern, here it’s being used within a downtrend context to identify a potential reversal or continuation zone — depending on market reaction at D.
Key Zone to Watch:
🟡 3800 – 3840 → Major potential reaction zone (Fib confluence + AB=CD completion).
If sellers hold this level, we could see further downside momentum.
🔹 Daily Chart View
On the daily timeframe, bullish momentum looks weak — every recovery candle is smaller, and volume favors sellers. With the AB=CD pattern confirmation and price failing to reclaim the 40050 zone, the bias stays bearish.
🔹 Weekly Chart Insight
Historically, gold tends to retrace after 9 consecutive straight bullish weekly candles.
From 1990 to 2025, each 9-week rally phase has been followed by a notable correction ranging from 6% to 14%, showing that extended rallies often precede profit-taking phases.
This current rally phase mirrors that same behavior patterns — making a corrective move toward 3800–3700 highly probability.
🧭 Final BIAS
The technical confluence between the bearish structure, double top + divergence, and AB=CD D-leg near golden ratio and 9 week rally gives a high-probability bearish setup.
If 3940 fails to hold, next potential downside target lies near 3900-3775, aligned with long-term structure support.
GOLD SELLERS WILL DOMINATE THE MARKET|SHORT
GOLD SIGNAL
Trade Direction: short
Entry Level: 4,027.15
Target Level: 3,890.12
Stop Loss: 4,118.76
RISK PROFILE
Risk level: medium
Suggested risk: 1%
Timeframe: 2h
Disclosure: I am part of Trade Nation's Influencer program and receive a monthly fee for using their TradingView charts in my analysis.
✅LIKE AND COMMENT MY IDEAS✅

Gold holds gains but faces strong resistance at $3975📊 Market Overview:
Gold prices remain steady around $3960–$3965, sustaining upside momentum after breaking above the key $3950 resistance. The market is supported by expectations that the Fed may cut rates sooner, while a weaker USD continues to bolster gold. However, profit-taking pressure around $3970–$3975 is slowing the rally ahead of the U.S. session.
📉 Technical Analysis:
• Key Resistance: $3975 – $3985 – $4000
• Nearest Support: $3955 – $3948 – $3935
• EMA: Price is above EMA 09 & EMA 20 (H1) → short-term trend remains bullish.
• Candlestick & Momentum: H1 candles are holding above the $3950 breakout zone, confirming ongoing buying strength, though RSI nearing overbought may trigger a minor correction.
📌 Outlook:
Gold remains in a short-term uptrend above $3955. A clear break above $3975 could open the door to $3985–$4000, while a drop below $3955 may trigger a pullback toward $3948–$3935 before any rebound.
💡 Trading Strategy Suggestion:
🔺 BUY XAU/USD at: $3935 – $3932
🎯 TP: 40 / 80 / 200 pips
❌ SL: $3929
🔻 SELL XAU/USD at: $3975 – $3978
🎯 TP: 40 / 80 / 200 pips
❌ SL: $3981

XAU/USD – Gold Faces Key RejectionXAU/USD – Gold Faces Key Rejection Zone Near 4,050 Ahead of Month-End
Gold prices (XAU/USD) are attempting a short-term rebound from the 3,900 support area after an extended bearish leg last week. However, the recovery momentum is now testing a critical resistance zone around 4,020–4,050, which previously acted as a major breakdown point.
From a technical standpoint, the overall structure remains bearish as long as price stays below 4,050. The recent move appears to be a retracement toward the 38.2% Fibonacci zone, aligning with the EMA dynamic resistance and prior supply area. A clear rejection from this region could trigger renewed selling pressure toward 3,908–3,880, while a confirmed breakout above 4,050 would open the door for a corrective push toward 4,180 and 4,390.
Key Levels:
Resistance: 4,050 / 4,180 / 4,390
Support: 3,908 / 3,880 / 3,792
Trading Strategy:
Scenario 1 (Bearish bias): Watch for bearish reversal signals at 4,020–4,050. A rejection candle or RSI divergence could validate short entries toward 3,908.
Scenario 2 (Bullish breakout): If gold closes firmly above 4,050 on H1–H4 timeframe, short-term buyers may target 4,180 before reassessing momentum.
Overall, sellers still hold control unless bulls reclaim 4,050 convincingly. Traders should monitor today’s U.S. data releases and Fed commentary for volatility triggers.
Remember to follow for more daily trading setups and technical insights.
