XAU/USD: Strong Rebound After Testing $3,720 SupportHello everyone, let’s take a closer look at gold (XAU/USD) after the latest market moves.
At present, gold is undergoing a mild pullback from $3,748, though the primary trend remains bullish after testing the key support area at $3,720. Following the strong upward rally, profit-taking emerged as price touched resistance around $3,750, making this a natural correction.
The $3,720 support zone, reinforced by a Fair Value Gap (FVG), strengthens the likelihood of a rebound. Price action remains above the Ichimoku Cloud (Kumo), confirming that the main bullish trend is intact and the cloud continues to act as a dynamic support in case of further corrections.
On the macro side, persistent economic and geopolitical uncertainty supports safe-haven demand, which could drive gold prices higher if volatility increases.
After testing $3,720, gold is expected to recover strongly towards $3,750 and $3,800. A decisive break above these levels may open the path to $3,850.
Do you think gold will be able to break $3,800 in the coming sessions?
GOLD trade ideas

GOLD (XAUUSD): More Growth is Coming?!
Gold was very bullish on Friday.
A formation of a buying imbalance candle accompanied by a confirmed
breakout of a significant intraday resistance suggest a strong bullish pressure.
With a high probability, the market will update the ATH again and will aim at 3800 psychological level.
❤️Please, support my work with like, thank you!❤️
I am part of Trade Nation's Influencer program and receive a monthly fee for using their TradingView charts in my analysis.

Gold Price may test the support after Rebound Gold (XAUUSD) has reached a new resistance zone as the U.S. dollar shows signs of recovery from its recent decline. Despite mixed JOLTs job data, weaker hiring trends, and ongoing fiscal risks weighing on the USD, gold’s bullish momentum appears to be pausing for a consolidation phase.
After a modest rally during the European session, the market is now entering a corrective consolidation. A short-term pullback is likely before any further upward continuation.
Key Technical Outlook:
Watch the current support area closely. If bulls can maintain price above this zone, it will strengthen the bullish case If buyers hold control above support, the next upside resistance to watch is near 3900.
You may find more details in the chart.
Trade wisely Best Of Luck.
Ps; Support with like and comments for better analysis.

DeGRAM | GOLD held the support line📊 Technical Analysis
● XAU/USD is trading within an ascending structure, holding support near 3,855 and showing steady higher lows.
● Price is testing short-term resistance at 3,891, with bullish candles suggesting momentum toward the 3,900 level.
💡 Fundamental Analysis
● Gold is supported by softer U.S. Treasury yields and increased demand for safe-haven assets amid persistent economic uncertainty.
✨ Summary
● Bullish bias intact: support at 3,855 holding, price eyeing breakout toward 3,891–3,900 zone with safe-haven flows adding strength.
-------------------
Share your opinion in the comments and support the idea with a like. Thanks for your support!


Gold Watching 3,850 Support as Dollar Weakens on UsGovt ShutdownHey Traders, in today’s trading session we are monitoring XAUUSD for a potential buying opportunity around the 3,850 zone. Gold is trading in an uptrend and currently in a correction phase, with price approaching this important support/resistance level.
Structure: Gold remains within an overall bullish structure and is also trading inside an ascending channel.
Key level in focus: 3,850 — a key support zone where buyers may look to step in.
Upside target: 3,930 — aligning with the channel resistance and potential area for bullish continuation.
Fundamentals: The ongoing US government shutdown is adding bearish pressure on the US Dollar. Given Gold’s negative correlation with DXY, this environment continues to support the bullish bias for Gold.
Trade safe,
Joe.

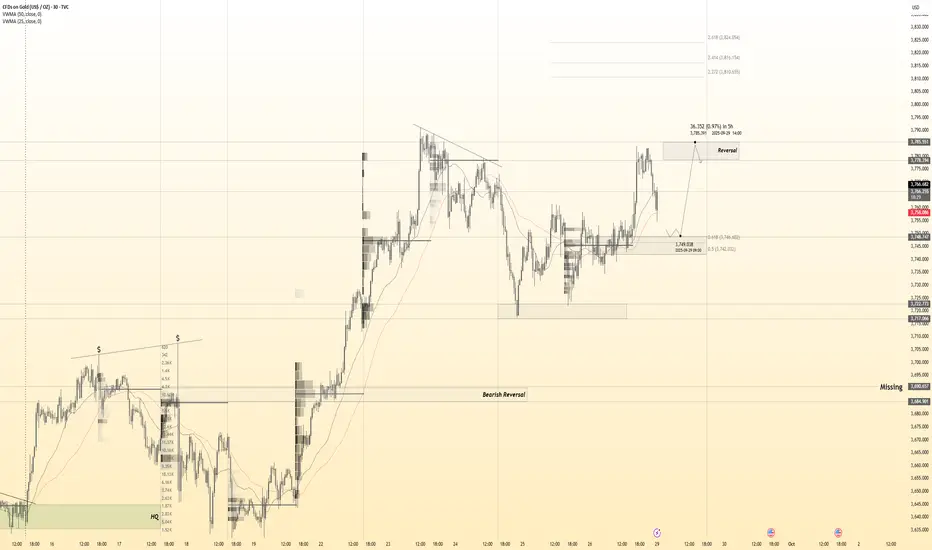
Gold 30Min Engaged ( Bullish Reversal Entry Detected )Time Frame: 30-Minute Warfare
Entry Protocol: Only after volume-verified breakout
🩸Bullish Reversal - 3749 Zone
➗ Hanzo Protocol: Volume-Tiered Entry Authority
➕ Zone Activated: Dynamic market pressure detected.
The level isn’t just price — it’s a memory of where they moved size.
Volume is rising beneath the surface — not noise, but preparation.
🔥 Tactical Note:
We wait for the energy signature — when volume betrays intention.
The trap gets set. The weak follow. We execute.
Symmetrical Triangle Pattern on XAUUSDIt forms when price makes lower highs and higher lows, squeezing into a tighter range.
This shows market indecision: neither buyers (bulls) nor sellers (bears) are in full control.
Volume usually decreases as the triangle develops, then spikes when a breakout happens.
📈 Trading Implications
• Continuation or reversal: A symmetrical triangle is generally a neutral pattern — it doesn’t predict direction by itself. Instead, it signals that a big move is coming soon.
• Breakout direction matters:
• If price breaks above the upper trendline with strong volume → bullish breakout (possible rally continuation).
• If price breaks below the lower trendline with strong volume → bearish breakout (possible sell-off).
⚖️ Confirmation
• Wait for a clear breakout candle (closing outside the triangle).
• Stronger signals if breakout aligns with overall trend and high volume.

XAU/USD Intraday Analysis – October 1, 2025Gold (XAU/USD) is currently trading around 3,887 USD/oz, showing strong bullish momentum on the hourly timeframe. The price action indicates a clear uptrend, with higher highs and higher lows forming since mid‑September.
Technical Overview:
Trend: Uptrend confirmed by consecutive bullish candlesticks and ascending trendline.
Support Levels:
3,760 – 3,750 USD/oz: Major intraday support zone, tested multiple times and held strongly.
Resistance Levels:
3,890 – 3,895 USD/oz: Immediate resistance zone where recent price action paused before breaking higher.
Key Observations:
The recent breakout above the previous resistance indicates strong buying pressure.
Price is currently respecting the ascending trendline (blue line on chart), which may act as dynamic support for the next bullish leg.
Pullbacks toward the trendline could offer high-probability buying opportunities for intraday traders.
Short-term traders should watch for reversals near 3,910 USD/oz, which could temporarily cap upside movement.
Trading Strategy:
Buy Strategy: Enter on pullbacks to 3,875 – 3,880 USD/oz with stop-loss below 3,865 USD/oz. Target near 3,905 – 3,910 USD/oz.
Sell Strategy: Consider shorting only if a strong bearish reversal candlestick pattern forms near the 3,910 USD/oz resistance.
Conclusion:
Gold remains in a strong intraday uptrend. Momentum favors the bulls, and the next leg higher could push prices toward 3,910 USD/oz. Traders should focus on trend-following entries while monitoring key resistance for potential profit-taking.
Follow for more intraday gold strategies and high-probability setups, and bookmark this analysis if you find it useful for your trading decisions.

Gold (XAU/USD) Intraday Technical Analysis – Sep 26Technical Overview
Gold recently broke out of the previous consolidation zone (3,620 – 3,680 USD) and surged to a new resistance area around 3,780 – 3,790 USD. Following this rally, price has retraced and formed a short-term corrective pattern marked as A-B-C on the chart.
Key Levels
Level 3,720; Short-term intraday support, point A of corrective move
Support Zone 2
Level 3,620; Strong historical support, bottom of prior consolidation
Resistance Zone
Level 3,780 – 3,790; Major swing high, key supply area
Immediate Pivot
Level 3,750 Current market congestion, potential short-term indecision
Price Structure & Behavior
Uptrend Momentum: The red arrow highlights the strong bullish move from 3,640 to 3,780, fueled by buyers breaking the previous consolidation.
Corrective Pattern: After hitting resistance, price retraced to point A (3,720 area) and bounced to point B (~3,755), forming an ABC corrective structure.
Potential Continuation: The chart suggests a possible C leg down toward 3,720 if resistance holds at B, completing the corrective move before the next bullish attempt.
Indicators & Confluence
EMA: Price is currently hovering around the 20 EMA, signaling near-term indecision. Watch for rejection or clean break for confirmation.
RSI: Approaching 60, showing slight bullish bias but not overbought. A downward move would confirm C leg continuation.
Fibonacci: The retracement from 3,640 → 3,780 aligns with 38.2% – 50% Fib retracement for point C (~3,720), supporting this corrective target.
Trading Strategies
1. Aggressive Short (Countertrend)
Entry: Around 3,755 – 3,760 (near point B resistance)
Target: 3,720 (point C)
Stop Loss: Above 3,780
Notes: High probability intraday short, but risk if breakout occurs.
2. Trend Continuation Long
Entry: Break above 3,780 with strong 1H candle close
Target: 3,810 – 3,820
Stop Loss: 3,760
Notes: Only enter if resistance at 3,780 is decisively broken.
3. Range/Scalping
Buy near 3,720 – 3,725
Sell near 3,755 – 3,760
Quick scalps within ABC correction zone, ideal for 1H intraday traders.
Summary
Gold is consolidating after a strong rally, forming a classic ABC correction. The 3,720 support zone and 3,780 resistance zone are critical levels. Traders can look for a short-term C leg drop before continuation, or wait for a break above 3,780 for trend-following long setups.

XAUUSD: A Golden Opportunity to Buy TodayHello everyone, Kilian here!
Gold is looking very attractive. After a strong surge, the price has come back to test and confirm the strong buying pressure, and this has been confirmed beautifully.
The price is currently at an important level where the sellers pushed the price down. If the buyers manage to break through this level and repeat the same pattern (coming back to test and confirm), this indicates strong buying pressure, meaning the price is likely to continue rising.
Wish you happy trading and profitable results!

XAU/USD | GOLD Breaking Records – $4K Target Loading…!By analyzing the TVC:GOLD chart on the 1-hour timeframe, we can see that nothing seems to be stopping its series of new record highs — it almost feels like the $4,000 target isn’t too far away! Every small correction in gold is simply gathering more liquidity and demand to push toward higher levels.
At this very moment, gold has printed a new ATH at $ 3,734 , and I expect the rally to continue. The next possible upside targets are $3,740, $3,780, and $3,800.
THE MAIN ANALYSIS :
Please support me with your likes and comments to motivate me to share more analysis with you and share your opinion about the possible trend of this chart with me !
Best Regards , Arman Shaban

GOLD (XAU/USD): Trend Following TradingIt appears that the price of 📈GOLD has completed a correctional phase following a strong bullish trend.
The price has shown good respect for a significant intraday horizontal support level, subsequently establishing a cup and handle pattern.
The breakout above the neckline, accompanied by a strong imbalance candle, offers substantial confirmation of a bullish trend continuation.
Therefore, an increase to 3770 - 3785 is anticipated.

XAU/USD 4H Chart – Bullish Pullback Setup to Key Support ZoneAnalysis Overview:
📈 Trend:
The price is currently moving in an ascending channel, indicating a bullish trend.
Price has recently touched or slightly exceeded the upper boundary of the channel, suggesting a potential pullback.
🟦 Support Zone (Buy Zone):
Marked in blue, between 3,764.828 (Trade Entry) and 3,718.674 (Stop Loss).
This zone aligns with a previous consolidation area, which now acts as a strong support.
✅ Entry Plan:
Wait for price to retrace into the blue support zone.
Ideal entry around 3,764.828, possibly after a bullish signal (e.g., pin bar, bullish engulfing).
❌ Stop Loss:
Placed just below the support zone at 3,718.674, protecting the trade in case the structure fails.
🎯 Target (TP):
3,975.534 — This is labeled as the LABA TARGET POINT, near the upper boundary of the ascending channel.
Risk-reward ratio appears favorable, roughly 4:1 if using the full range between entry and stop loss.
🧠 Trade Idea Summary:
Setup Type: Pullback to Support in Bullish Channel
Bias: Long/Bullish
Entry Zone: 3,764.828 (support)
Stop Loss: 3,718.674 (below structure)
Target: 3,975.534 (channel top)
Conditions to Watch:
Confirm reversal within the buy zone before entering.
Monitor for bearish breakdown if price closes below stop loss zone.
⚠️ Risk Management Tips:
Use proper position sizing based on your account size and stop loss.
Do not enter early; wait for confirmation (e.g., bullish candle pattern) in the support zone.
Keep an eye on macroeconomic news (e.g., NFP, interest rate updates) as gold is very sensitive to these events

Gold: Technical Pause Before US Data StormHello everyone, gold has just marked a new peak at $3,890/oz before pulling back slightly, a common pause in an ongoing uptrend. But the story is not just about technicals – this week the spotlight is on a series of major news releases from the US. Is this merely a “technical landing” or a preparation for another bullish wave?
News Context:
US Shutdown: For the first time in nearly seven years, the US government faces a shutdown. This not only disrupts public services and risks delayed federal salaries, but it could also postpone key economic data such as the NFP if the closure drags on. With fewer data points, markets tend to price in more uncertainty, putting pressure on the USD and Treasury yields – factors that usually support gold.
Economic Data & the Fed: On the calendar, indicators like Unemployment Claims, JOLTS, and ISM will be critical in shaping policy expectations. If numbers weaken, the Fed has more reason to soften its stance, which supports gold. However, if the Fed reverts to a “hard anti-inflation” tone, gold could see sharper swings.
Flows & Sentiment: The profit-taking after gold touched $3,890 is perfectly normal within a bull trend. Importantly, there are no signs of large-scale distribution – suggesting that big money continues to hold long positions.
Technical Analysis:
The uptrend remains intact as gold keeps its Higher High – Higher Low structure. The fresh peak at $3,890 confirms the bullish pattern, while the current pullback is just a retracement.
Key Supports: The shallow FVG zone at $3,855–3,845 is the first line of defence, with deeper support at $3,821–3,819. In strong trends, gold often rebounds from the shallow zone.
Main Scenario: A test of $3,855–3,845 followed by a rebound toward $3,878–3,885, then $3,895–3,905, and possibly extending to $3,915–3,925.
Invalidation Point: A H1 close below $3,814 would call the bullish scenario into question.
So what do you think: will gold bounce right from the shallow support, or does it need a deeper test before breaking above $3,900?

XAUUSD-Sell Setup Forming Below ResistanceThe chart indicates a bearish reversal setup:
Resistance Zone: Around 3,784 USD – price has tested this level and shows signs of rejection.
Target Zone: Around 3,700 USD – expected downside move if rejection holds.
Trading Plan: Consider a SELL position near resistance with stop-loss just above 3,784 USD.
Confirmation: If price fails to break and close above resistance, bearish momentum is likely to continue.

Gold will hit $4K in October!
Gold performed exceptionally well in September, breaking through $3,500 and repeatedly reaching new highs, reaching a high of $3,791 and approaching the $3,800 mark.
So, how will gold perform next week? Where will October lead? Has gold reached a peak? Where will it peak?
First, the overall trend is undoubtedly upward, as we've discussed in detail before. I personally believe reaching $4,000 by the end of the year is not a problem, with only a little over $200 remaining. Based on the current trend, it will likely reach $4,000 in one go. Therefore, two scenarios are possible:
First, a direct surge to $4,000 followed by a deep correction;
Second, a deep correction followed by a further push to $4,000.
The deep correction mentioned here refers to a peak decline of $200-250. Therefore, I believe the first scenario is more likely for three main reasons:
First, the overall trend remains strong, with rising prices more likely than falling prices. The daily chart shows mostly single-line corrections, which do not alter the overall bullish trend and upward momentum.
Second, there are two more interest rate meetings this year, one in October and one in December. The market is highly skeptical of another 25 basis point rate cut in October. The close timing leaves little time and space for gold to correct. The October Fed rate decision will be on October 30th, at the end of the month. As long as expectations of a rate cut persist, October is likely to continue its upward trend, with a peak decline and a deep correction likely in November.
Third, gold's overall trend this year is very similar to last year's. The second surge in the second half of last year continued until the end of October, followed by a deep correction on October 30th and 31st, with a drop of $254 from $2790 to $2536. This year, the overall trend at the same point in time and within the same cycle is largely the same. So, I think the probability of a repeat of last year's trend in the coming months is very high.
In short, don't expect a significant correction in gold prices right now. The recent significant increase in holdings of the world's largest gold ETF may confirm this. Therefore, follow the trend and don't blindly speculate on the top. Strategically, there won't be any major mistakes; the rest is a matter of tactical approach.
Tomorrow, Monday, we should still focus on an uptrend. A retracing to the support line of the converging triangle structure could signal a second continuation, around 3753. For a bullish outlook, the best scenario is intraday strength; the sooner the momentum builds, the stronger the market. Once it breaks through the 3783-3791 highs, a breakout above 3800 becomes highly likely.

Gold → May rise and then fallToday's day is in a state of slow upward fluctuation, but the short-term bullish performance is not strong. Yesterday's daily line closed with an inverted line. Today, we can see a decline based on the high point of 3895. In the New York market, gold may rise and then fall. The support below is 3862-3852, and the strong support is 3828 to see the rise! If it unexpectedly breaks above 3895, consider going long with a small position!
Resistance levels: 3895, 3925
Support levels: 3853, 3828
For specific trading decisions, please follow my live updates. I update my trading ideas and strategies daily. If you don't have a plan or strategy for gold trading and are struggling to achieve consistent profits, you can refer to and follow my updates for guidance and help avoid mistakes.

GOLD's Situation, A Comprehensive Analysis ! (XAUUSD)In my opinion, the price will rise to around $4000 and then enter a corrective wave. Currently, the price is forming the third upward wave, which I have estimated using technical analysis. These upward waves will continue up to around $4000, and after this rise, the price could decline toward the PRZ (Potential Reversal Zone). However, this price correction depends on the breakout of the wedge pattern.

Sorry, gold is about to crash.Hello traders, I want share with you my opinion about Gold. The broader market context for Gold has been decidedly bullish since the price reversed and broke out from a prior descending channel. This structural shift established a new uptrend, which has since been neatly contained within a well-defined ascending channel, guiding the price action of XAU higher through a series of higher highs and higher lows. After breaking two key levels, the price has completed another full rotation and is now at a critical inflection point. Currently, the asset is trading very close to the resistance line of this ascending channel. My strategy is based on the expectation that the price will reach this line and then be rejected, initiating a corrective decline. I think that after such a strong run, a pull-back is a probable scenario. A confirmed reversal from this upper boundary would validate the short idea. Therefore, I have placed my TP at 3715 points. As noted, this is an intermediate target not located at a major support zone, designed to capture the initial phase of the anticipated downward correction. Please share this idea with your friends and click Boost 🚀
Disclaimer: As part of ThinkMarkets’ Influencer Program, I am sponsored to share and publish their charts in my analysis.

Gold 30Min Engaged ( Buy & Sell Reversal Entry Detected )Time Frame: 30-Minute Warfare
Entry Protocol: Only after volume-verified breakout
🩸Bullish Reversal - 3784
🩸Bearish Reversal - 3821
➗ Hanzo Protocol: Volume-Tiered Entry Authority
➕ Zone Activated: Dynamic market pressure detected.
The level isn’t just price — it’s a memory of where they moved size.
Volume is rising beneath the surface — not noise, but preparation.
🔥 Tactical Note:
We wait for the energy signature — when volume betrays intention.
The trap gets set. The weak follow. We execute.

Don't think it's ridiculous, 3500 is coming soonAs shown in the chart gold will continue to fall. The first target is to look at 3700 first. I believe that many of my friends who followed me have made money during this gold rally. However, some new friends may have had their orders trapped or their accounts wiped out due to a single surge! This market is like this: it can bring both wealth and disaster! So, don't lose heart if you've lost your account. I can assure you that everyone who enters this market has experienced this, and I haven't either! Life requires some failures to become better. This gold trend K-line is like every rise, which will experience a bottoming out.

Gold's All-Time HighAfter 4 years of consolidation, gold began a Bullrun with 2 upward cycles in the year 2025, reaching the most relevant historical high mark in history, driven by the Tariffs imposed by Trump and tensions of a possible war.
We are already experiencing a sharp rise of more than 15% after the last crash, since then we are going for the seventh consecutive week of growth.
It should still test 4000 thousand. If it fails to break through and is a strong barrier, we believe it can consolidate for a good period in the range of 3600 to 4000.
