Detailed Technical Analysis Description (XAUUSD, 1H)
## 📈 Detailed Technical Analysis Description (XAUUSD, 1H)
### 1. **Overall Price Action and Trend**
The chart covers the period from roughly **October 1st to the beginning of November**.
* **Early October Rally:** The price starts low (around 3,930 to 3,940) and experiences a **strong, sustained bullish trend** throughout the first half of October, peaking around **4,350-4,375**. This rally is characterized by frequent **"BUY" signals** and a prominent green-shaded indicator area.
* **Mid-October Reversal and Downtrend:** After the peak, the market undergoes a sharp reversal and enters a significant **downtrend**. This correction is marked by a large red-shaded indicator area, a **"SELL" signal** near the high, and continuous price drops, breaking through the previous structure.
* **Late October/Early November Consolidation:** The downtrend finds a temporary low around **3,940**. The most recent price action (late October/early November) shows the price attempting to recover, moving sideways-to-up within a **defined, short-term range** (roughly 3,975 to 4,025).
### 2. **Key Indicator Overlay (The Shaded Area)**
The most prominent feature is the shaded, ribbon-like indicator (green for up-trend, red for down-trend), which likely represents an adaptive moving average or a custom trend-following tool:
* **Bullish Phase (Green):** The **green ribbons** are spread out and consistently below the price, indicating strong upward momentum and serving as dynamic support. Frequent "BOS" (Break of Structure) labels suggest the upward trend is continuously creating higher highs.
* **Bearish Phase (Red):** The **red ribbons** dominate the second half of the chart, running consistently *above* the price. The ribbons start very wide, showing strong downward momentum, and then contract as the price starts to flatten, suggesting momentum is slowing.
* **Current State:** The current price action is hovering around the transition point, with a small green ribbon beginning to appear again.
### 3. **Identified Trading Ranges and Structures**
The chart features several labeled structures:
* **High-Volume/Wide Trading Range (Labeled "Wide Trading Range"):** This box (around 4,000-4,350) covers the peak and the initial, volatile drop, suggesting a major area of distribution and reversal.
* **Recent Trading Range (Labeled "VL&D Trading Range"):** A smaller, red-bordered box (around 4,000-4,200) highlights a key consolidation period during the mid-to-late October drop.
* **Current Structure (Late October/Early November):** The very recent price action is contained within a **small, blue-lined upward-sloping channel or flag pattern**. This is an **ascending wedge or channel** that typically suggests a continuation of the previous trend (down) or a potential short-term breakout.
### 4. **Signals and Labels**
* **BUY/SELL Signals:** These markers indicate specific entry/exit points generated by the custom indicator system. They appear strategically, often at key turning points, though not all lead to sustained moves.
* **BOS (Break of Structure):** Appears often in the uptrend, confirming the establishment of new higher highs, a classic sign of a strong trend.
* **LL (Lower Low):** Appears during the downtrend, confirming the progression of the bearish move.
* **Current Key Price Levels:**
* **Resistance:** The recent high around **4,030-4,035** and the level where the blue channel's upper line sits.
* **Support:** The bottom of the blue channel, currently around **3,980**, and the horizontal green line around **3,975**.
In summary, the chart shows Gold moving from a **strong parabolic rally** to an **aggressive bearish correction**, and is now attempting to **consolidate and potentially reverse** within a tighter, short-term ascending pattern.
---
Trade ideas

XAU/USD – Selling Opportunity Near Resistance ZoneGold is currently approaching a strong resistance level after an extended bullish move.


Gold Consolidating chance for Growth Gold prices are currently consolidating ahead of the Federal Reserve’s decision. The fundamental background remains mixed — with uncertainty surrounding monetary policy and global trade developments.
During the second half of the European session and into early U.S. trading, the market may enter a phase of stagnation. A soft or dovish tone from the Fed could trigger renewed bullish momentum, while progress in trade negotiations or a hawkish surprise from the Fed may extend the ongoing correction.
If the bulls manage to defend support above 4000, this level could act as a strong base, potentially pushing prices toward the 4054–4078 range in the short term. A break below this key zone, however, would likely invite further downside pressure.
You may find more details in the chart.
Trade wisely best of Luck buddies.
Ps; Support with like and comments for better analysis Thanks for Supporting.

Continue to accumulate along the 4058 trend line⭐️GOLDEN INFORMATION:
Gold (XAU/USD) faces renewed selling pressure after an early Asian uptick toward $4,046, pausing this week’s rebound from its lowest level since October 6. The US Dollar (USD) holds near a three-month high following the Federal Reserve’s hawkish stance, weighing on the non-yielding metal.
Additionally, optimism over easing US–China trade tensions dampens safe-haven demand. Still, lingering worries about the prolonged US government shutdown could limit USD strength and offer some support to gold prices.
⭐️Personal comments NOVA:
market accumulation time, sideways around 4000. ended october with volatility
⭐️SET UP GOLD PRICE:
🔥SELL GOLD zone: 4058 - 4060 SL 4065
TP1: $4050
TP2: $4040
TP3: $4020
🔥BUY GOLD zone: 3887 - 3885 SL 3880
TP1: $3900
TP2: $3910
TP3: $3925
⭐️Technical analysis:
Based on technical indicators EMA 34, EMA89 and support resistance areas to set up a reasonable sell order.
⭐️NOTE:
Note: Nova wishes traders to manage their capital well
- take the number of lots that match your capital
- Takeprofit equal to 4-6% of capital account
- Stoplose equal to 2-3% of capital account

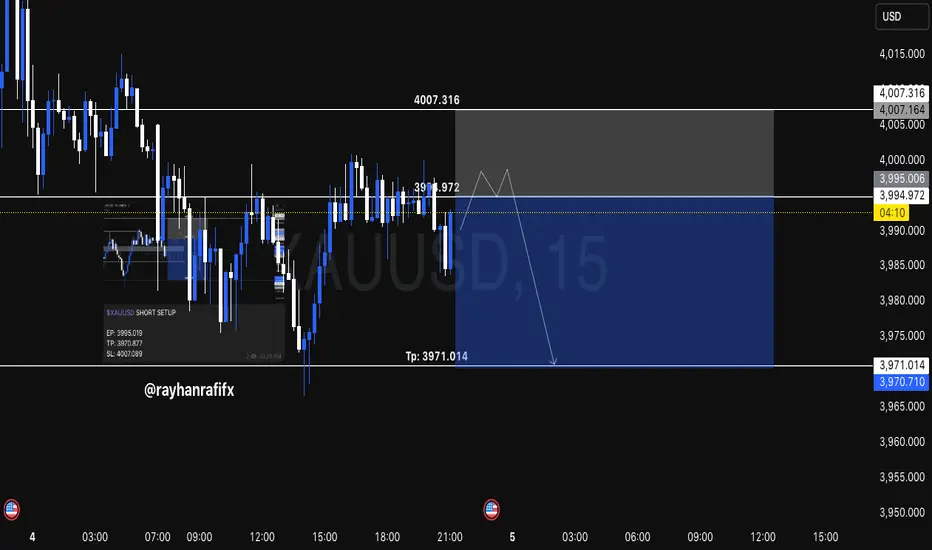
XAUUSD SHORT SETUP INTRADAY ( NOV 04, 2025 )If you have doubt on our trades you can test in demo.
OANDA:XAUUSD SHORT SETUP
EP: 3995.019
TP: 3970.877
SL: 4007.089
Trade Ideas:
Idea is clearly shown on chart + we have some secret psychologies and tools behind this.
Trade Signal:
I provide trade signals here so follow my account and you can check my previous analysis. So don't miss trade opportunity so follow must.
Gold LongBreak and Retest
Technicals
we closed above 4000 and the CPI news release the USD was weaken which was the first sign of the bullish pressure

Gold Price Tests $4020 ResistanceGold Price Tests $4020 Resistance
Today's Trading Strategy: Continue to buy on dips.
1. Market expectations for a December rate cut by the Federal Reserve have cooled, causing the dollar index to retreat from its highs. Neutral to slightly bearish: The high-interest-rate environment is suppressing gold prices.
2. However, the ongoing US government shutdown and escalating international geopolitical tensions are a significant positive factor: safe-haven demand is the main force supporting gold prices.
Technical Analysis: Gold prices are currently facing strong resistance in the $4020-$4050 range.
As shown in the 4-hour chart: Gold prices are in a triangle consolidation pattern and need to break through key resistance or support levels to determine the next move.
Upside Target: If gold prices successfully break through $4020, the next target is $4110.
Downside Support: The first short-term support level is around $3960-$3980.
The more critical support area is at $3890. As long as gold prices remain above this area, the long-term uptrend structure remains valid.
Aggressive Strategy:
Buy: 3990-4000
Stop Loss: 3970
Target Price 1: 4050
Target Price 2: 4110
Conservative Strategy:
A more conservative strategy is to wait for gold prices to break through $4020 effectively, then establish long positions on a slight pullback, with a stop loss set in the $4020-4000 range, and a target price of $4070-4110.
Risk of Failed Breakout: If gold prices repeatedly attempt to break through $4020 but fail, and subsequently fall below the $3980 support level, it indicates that this upward move may have failed, and prices may fall back to the $3930-4000 trading range.

XAUUSD – 15-Minute Technical AnalysisThe 15-minute chart of Gold (XAUUSD) reveals a potential bearish reversal setup following a completed corrective structure within an intraday uptrend.
After establishing a swing high at 4018.84, price retraced to the 0.618 Fibonacci retracement level (4002) of the prior impulsive leg, where a rejection and structural break occurred. The subsequent price action confirms a transition from bullish momentum to early bearish structure, validated by a break below the ascending trendline.
Currently, the market is forming a potential lower high within the retracement zone (green area), suggesting a continuation of the bearish leg.
Entry Zone: 4000 – 4005
Stop Loss: Above 4020 (structural high / invalidation level)
Take-Profit Target: 3928 – 3930 (measured move and prior liquidity zone)
Fibonacci Confluence: 0.618 retracement aligning with internal structure breakdown
Market Structure Bias: Bearish, pending confirmation from lower high formation
The projection indicates a possible continuation toward the downside, targeting the 3928 support region, provided that price maintains rejection below 4005 and does not invalidate the swing high at 4020.

Gold breaking through this signal could see it reach the $4,000 Gold experienced a sharp drop in the short term, retreating to the support area of 3928 and reversing. The current upward pressure is in the 3977-3989 USD area, which is the key area for short-term gains. If this area is broken, it will once again stand above the 4000 USD mark.

Gold will test the zone between 4014 and 4009📊 Gold Analysis – CMP Zone Setup
I’m expecting Gold (XAUUSD) to test the 4014–4009 zone, based on my CMP (Current Market Price) technique — a method I use to identify potential reaction areas in the market.
🔍 Technical Outlook:
Price is approaching a key CMP zone that often acts as a reaction point.
I’ll be watching closely for a bearish engulfing pattern to confirm a potential reversal entry.
🎯 Trade Plan:
Stop Loss: 50 pips
Take Profit: 1:2 or 1:3 R:R
Setup Type: CMP Reaction + Engulfing Confirmation
I’ll remain patient and wait for a clear confirmation before executing any position.
⚠️ Disclaimer:
This analysis is based on my personal technical view and is not financial advice. Always do your own research before taking any trade.

1H trend has shift now it can go till 4100+ After 1H trend shift in up side no it has given engulf here. It has the potential to to go 4100 price, 7000+ pips up from here.
It would revisit it's low later. But right now it's 4100.

Gold Trade Plan 05/11/2025Dear traders,
Gold is fluctuating within the 3900–4000 range. As long as the 4000 zone is not broken strongly, we expect further correction.
Regards,
Alireza!

There are shorting opportunities in gold prices today.There are shorting opportunities in gold prices today.
International gold prices are currently fluctuating around $4,012 per ounce, mainly influenced by both bullish and bearish factors.
On one hand, a stronger dollar and the Federal Reserve's hawkish stance are putting pressure on gold prices; on the other hand, long-term factors such as geopolitical risks and central bank gold purchases are providing support.
---------------------------------------- Key technical levels: Resistance levels: $4030-$4050, $4090-$4110.
A break above these resistance levels could unlock further upside potential.
Support levels: $3950-$3900, $3850-$3820.
A break below these support levels could trigger a larger pullback.
💡 Specific trading strategy:
Currently, gold prices are below the key resistance zone ($4030-$4050), and the short-term trend leans towards consolidation.
If gold prices fail to break through $4,050, consider establishing a small short position with a stop-loss order above $4,070 and a target price around $3,960.

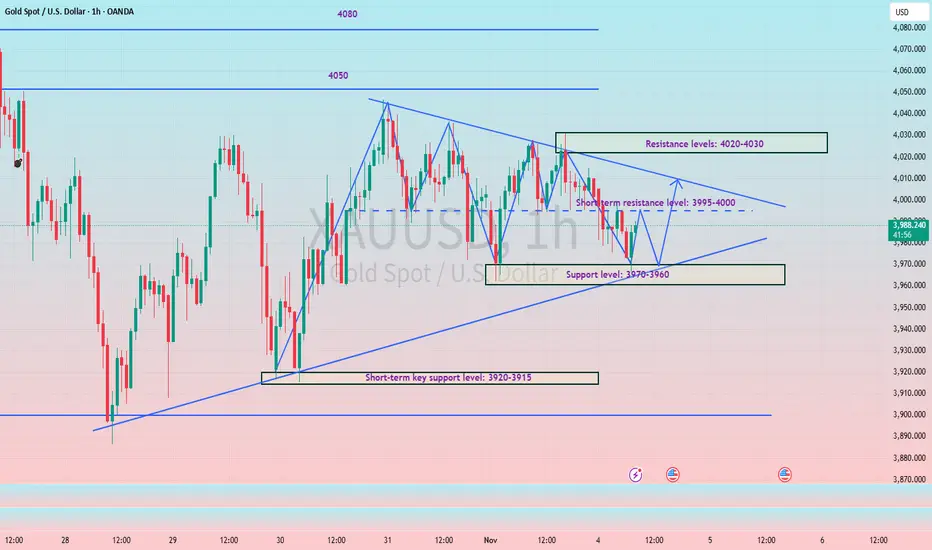
How to keep up with the rhythm of triangle pattern consolidation#XAUUSD OANDA:XAUUSD TVC:GOLD
Gold prices stalled at higher levels yesterday, mainly due to Federal Reserve officials' cautious stance on a December rate cut, which boosted the dollar and dampened enthusiasm for gold's rise. Judging from the current trend, the market is in a converging triangle pattern. The daily MA5 is around 3987, and the MA10 is around 4021. It can be seen that the range between these two points is very small, indicating that the market is also preparing to break out and choose a major direction. Once the gold price breaks out of the triangle pattern and chooses a direction, the daily chart's trendline will widen. Therefore, the key resistance level to watch is 4020-4030, while the key support level is 3970-3960. The European session is expected to trade within a range in the short term. Before a successful breakout, pay attention to the resistance level of the middle band on the hourly and 4-hour charts at 3995-4000. If the price touches the resistance level on the first attempt and fails to break through, a small short position can be considered.
Gold New idea for gold, whait for break and re- test
Yesterday idea hit TP and today is retesting the ENTRY POINT one more time, if gold goes down on NY session it will brake the high od tokyo session and probably yesterdays high

GOLD – When the Market “Whispers” About the Weakness of Buyers1️⃣ Market Structure – When the Bullish Rhythm Slows Down
After a series of CHoCHs and BOSs, the short-term bullish structure has clearly broken. The zone around 4,027 – 4,030 now acts as a Strong High, where smart money likely absorbed most of the buy-side liquidity.
Each retracement has become weaker, forming a sequence of Lower Highs — a classic sign of a distribution phase. The market is currently trading within the premium zone of the current range, where any reaction could be the “last kiss” before a potential drop toward lower demand areas.
2️⃣ Supply & Demand Zones – Footprints of Smart Money
Zooming into price behavior, the Sell Zone 4,010 – 4,015 stands out as a key Bearish Order Block formed after the most recent BOS — a zone Karina is watching closely.
If price retests this area and shows a clear rejection (e.g., bearish engulfing or upper-wick rejection), it could mark the beginning of a smart-money-aligned short setup.
Below, the 3,938 – 3,920 zone remains the untested liquidity pocket — a Weak Low where buy-side positions are likely resting. Smart Money may target this area to complete the distribution cycle before generating a potential accumulation reaction.
3️⃣ Liquidity Context – Silence Often Speaks the Loudest
Above the 4,020 – 4,030 area lies buy-side liquidity — a cluster of stop-loss orders from retail longs. A small liquidity sweep into this region followed by a strong bearish reaction would be a classic SMC pattern: grab liquidity, then move in the true direction.
Once that liquidity is absorbed, price could accelerate toward the 3,938 – 3,920 zone to clear sell-side liquidity, finalizing the redistribution phase.
4️⃣ Trading Scenario – Following the Smart Money Flow
Given the current structure, Karina favors short opportunities if price reacts decisively at the 4,010 – 4,015 zone, confirmed by bearish price action (such as a rejection wick or engulfing pattern).
Entry: 4,012 – 4,015
Stop Loss: 4,030
Take Profit: 3,938 – 3,920
This offers an approximate 1:4 R:R ratio, aligning with a high-probability, structure-based setup. It’s not a trade signal, but rather a perspective — a way to understand how Smart Money moves and leaves its traces.
5️⃣ Conclusion – Patience Is the Quiet Strength of a Trader
The market often speaks through behavior, not noise. Gold is currently in a quiet state — a moment of balance where Smart Money prepares for its next move. For Karina, silence itself can be the strongest signal when you know how to listen.
This analysis reflects Karina’s personal view and is not financial advice.
What do you see in Gold’s current structure? Could this minor push toward 4,015 be the start of a deeper move down? Let’s discuss in the comments 💬.

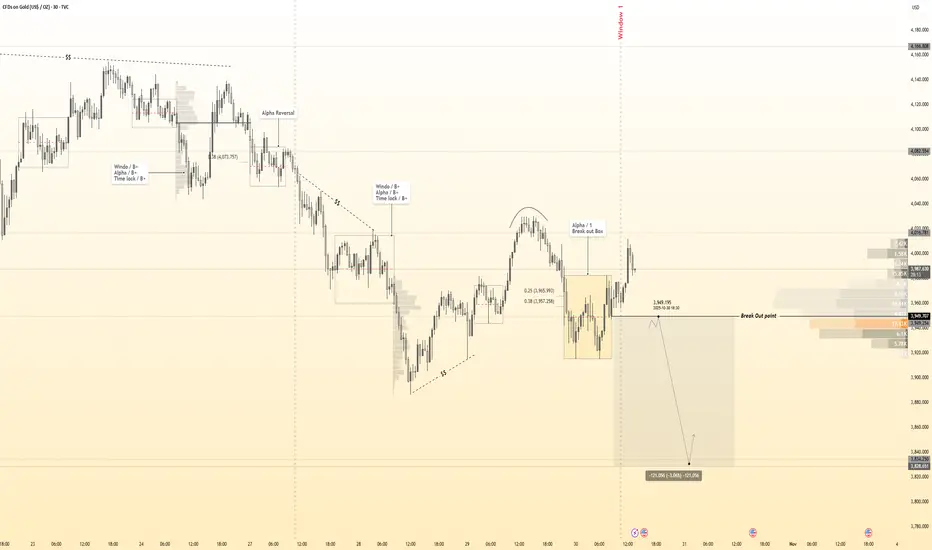
( Gold Protocol ) Bearish After Break Detected( Gold Protocol ) Bearish After Break Detected
Status: Active Reversal Protocol
Symbol: Gold
Session: London–New York Overlap (Smart Exit Window)
Confidence Level: ★★★★★ ( Hanzo Volume Detected )
☄️ Bearish After Break Out 3948
Reasons
1. Alpha Sequence Engaged — Smart flow detected within Hanzo precision range.
2. Volume Window Synced — Session energy aligns with internal volume pulse.
3. Liquidity Cycle Active — Engineered sweep confirms smart money transition.
4. Time Lock Confirmed — Market phase locked with directional intent.
5. Volume Map Aligned — Cluster balance reveals real directional flow.
6. Hanzo Wick Detected — Manipulation wick verified under Alpha filter.
⤵️Every like & comment on our TradingView posts helps us grow. More engagement means more exposure, which benefits everyone in the community!
Gold: High VolatilityYesterday, gold’s main structure followed a consolidation path, with the focus of its short-term structure edging slightly higher. The risk of price volatility today has increased. Combining the daily and hourly chart trends, the risk of volatility for gold will be very high in the next two days. Subjectively, we temporarily maintain the expectation of a technical correction pullback. Gold’s bullish performance has not been particularly strong, and with heavy resistance above, the trend has not reversed.
From the 4-hour chart, focus on the short-term resistance at the 4010 level, with secondary resistance at 4020-4025. For support, watch the short-term level at 3960-3970 and the key previous low support at 3888-3890. The bull-bear dividing line remains the 4040-4055 range. As long as this resistance range is not broken, I believe the trend has not reversed,on the contrary, any rebound presents opportunities to enter short positions.
We can enter short orders when rebounds encounter pressure. Operationally, it is recommended to continue shorting as long as rebounds fail to break key resistances.
Trading Strategy:
Sell 4010 - 4020
TP 3970 - 3960 - 3950
Buy 3920 - 3930
TP 3950 - 3960 - 3970

XAU/USD – Bearish Continuation Outlook (Smart Money Framework)XAU/USD – Bearish Continuation Outlook (Smart Money Framework)
🧭 Market Structure Overview
The major structure is bearish — confirmed by a Market Structure Break (MSB) after the last swing high.
Every bullish move since then is viewed as a retracement into premium price for better short entries.
Smart Money likely accumulating shorts above internal liquidity levels before driving price lower.
🟩 Premium Supply Zones (Sell Areas)
1️⃣ Be-BB (Bearish Breaker Block) → 4,180 – 4,240
💣 Main shorting area
Price expected to tap this level to mitigate sell-side imbalance.
Watch for liquidity grab above 4,060 before reversal.
Confirmation: bearish engulfing or BOS on lower timeframes (LTF).
2️⃣ Be-OB (Bearish Order Block) → 4,260 – 4,320
🚫 Last line of defense for bears
If price reaches here, expect a strong rejection due to trapped buyers and institutional orders.
Perfect “last tap” zone before deep markdown.
🟥 Discount Demand Zones (Targets)
🔻 Primary Demand Zone Area → 3,820 – 3,870
Previous accumulation zone (high-volume node).
Take-profit target for swing shorts.
Potential re-entry area for Smart Money to reload buys later.
🎯 Expected final destination if bearish pressure sustains.
📉 Bearish Scenarios
⚔️ Scenario 1 – Textbook Smart Money Setup
Price retraces to 4,060–4,180 zone (Be-BB).
Liquidity grab above 4,060 (previous high).
Bearish rejection → BOS → Sell continuation.
Targets: 3,939 → 3,870 → 3,820.
💥 Most probable scenario.
⚔️ Scenario 2 – Deep Retracement Then Dump
Bulls push higher into 4,260 (Be-OB).
Liquidity sweep and institutional fill.
Massive rejection → sell-off continuation.
🔥 Deeper pullback = bigger sell move later.

Gold (XAU/USD) Sell Opportunity as Stronger U.S. Manufacturing D
The latest ISM Manufacturing PMI came in at 49.4, beating the forecast of 49.1, signaling a modest but meaningful improvement in U.S. manufacturing activity. This better-than-expected data indicates the U.S. economy remains resilient despite global headwinds, which in turn strengthens the U.S. dollar (USD).
As the dollar gains traction, gold (XAU/USD) typically comes under pressure due to their inverse relationship. With the stronger USD outlook, we could see further downside movement in gold in the near term.
Trade Setup:
Instrument: XAU/USD
Bias: Sell
Entry Zone: Near 2,380 – 2,385 (adjust based on intraday resistance)
Take-Profit Targets:
TP1: 2,360
TP2: 2,340
Stop Loss: 2,395 (above recent swing high)
Reasoning:
Stronger-than-expected ISM Manufacturing PMI supports the USD.
Improved U.S. economic sentiment reduces safe-haven demand for gold.
Technical resistance aligns with fundamental USD strength.

GOLD READY TO BUYPROJECTION (BULLISH)📈📉👀🗞️
1. Fill out the IMB @ discount zone.
2. A sweep of EQL
3. A sweep of of SSL
4. A bullish BOS above IDM
5. A sweep of EQH
6. Fill out the IMB @ Premium zone
7. Asweep of BSL

GOLD BUYYGold skyrocketing after OB validation 🚀 🔥. I bought from order block 🚫 highlighted in green and it went to the moon since Asian sessions 😀
