Gold Under Pressure Sell Setup Near 3975XAU/USD is positioned near 3975, showing potential for a downside move as selling pressure builds and short term bullish momentum fades. If the current resistance holds, the pair could test the next support zone.
Key Levels:
Sell Entry: 3975
Take Profit: 3950
Stop Loss: 3995
Reasoning:
Technically, Gold has stalled near 3975, forming a local ceiling. Price action suggests that sellers may push the pair lower toward 3950.
Fundamentally, gold is facing headwinds from a firm U.S. dollar and rising interest rate expectations. Diminished haven demand and improving market sentiment in risk assets further limit upside potential.
Disclaimer:
This analysis is for educational purposes only and does not constitute financial advice.
Trade ideas

technical analysis of your provided XAU/USD (GoldTimeframe: 15 minutes
Current Price: $3,963.81
Trend Structure: Price recently broke out from a descending channel.
Key Levels:
Support Zone: $3,920 – $3,940
Immediate Resistance: $3,980
Target Zone: $4,142
📉 Technical Breakdown
Descending Channel Breakout
The chart shows gold had been moving in a clear downward channel.
The recent candles show attempts to break above the upper trendline, suggesting potential bullish momentum building up.
Support Level
A strong demand zone is visible around $3,920 – $3,940.
This zone has been marked as a possible retest area before continuation to the upside.
Price Projection
The chart projects a bullish scenario, where price may retrace slightly to support before targeting the $4,142.60 level.
This suggests a swing-buy setup, with confirmation depending on a strong bounce from the support level.
Market Structure
The formation of higher lows near the lower boundary of the channel signals momentum reversal.
A confirmed breakout with volume above $3,980 will lik TVC:GR10Y TVC:GR02Y EURONEXT:PSI1! EURONEXT:EV6X2025 EURONEXT:GE8Z2025 EURONEXT:PO6X2025 ely validate the bullish continuation.
🎯 Trading Plan Suggestion (Analytical View)
Buy Zone: $3,940 – $3,950 (after confirmation candle)
Take Profit Target: $4,142
Stop Loss: Below $3,915 (to protect against false breakout)
⚠️ Notes
Watch for price rejection near $3,980, as it could form temporary consolidation. EURONEXT:PO6X2025 EURONEXT:SNAX2025 EURONEXT:EV8Z2025 EURONEXT:PSI1! EURONEXT:XA8Z2025 EURONEXT:XA6X2025 EURONEXT:PO8Z2025
If price closes below $3,920, bearish momentum may resume.

XAUUSD – GOLD PREPARING FOR A POTENTIAL BOUNCE FROM SUPPORTXAUUSD – GOLD PREPARING FOR A POTENTIAL BOUNCE FROM SUPPORT
🧲 1. Overview
After sweeping liquidity around 4016, gold is moving back toward the rising trendline on the M15 chart, likely building momentum for a potential rebound. The market structure suggests a possible bullish reaction targeting the upper Order Block zone.
📊 2. Technical Breakdown
Market structure remains mildly bullish in the short term.
The liquidity zone around 4000–4004 aligns with the ascending trendline – a key area to watch for reactions.
A small FVG is being filled, which may complete the price rebalancing before a push higher.
The bearish OB around 4038–4055 is the next logical target if buyers regain control.
The OTE zone (0.618–0.705) at 4004–4006 overlaps with liquidity and trendline support, creating a strong ICT confluence.
🎯 3. Trade Scenario (for reference only)
Buy: 4004–4006
Stop Loss: 3998
Take Profit: 4022 – 4038 – 4055 – 4080
⚠️ 4. Key Levels
4015–4018 → Short-term resistance / FVG zone
4004–4006 → Entry zone + liquidity + trendline support
4038–4055 → Main OB target
4080 → Extended target if momentum builds

At the moment, D1 and H4 are synchronized — bearish bias. Target
Analysis at 09:00 (UTC +2)
At the moment, D1 and H4 are synchronized — bearish bias.
Target: D1 Fractal.
The continuation of the bearish structure looks logical, but there’s a caveat.
The W1 IMB has been mitigated, and on D1 a lot of liquidity has already been taken.
Considering the aggressive rally since August and the current correction on W1, there’s a high probability that a bullish setup may start forming from the current price level.
However, we have a problematic zone — FTA / D1 IMB.
For confident longs, the price needs to secure a close above this zone.
Until that happens, the short scenario remains valid.
For today:
There’s an H4 bearish BPR, from which we can expect confirmation for a move lower; inside it there’s an AH, which could be a potential entry point.
Asian session narrative: it swept its own liquidity and built a bullish sentiment. The upward move looks strong, so to confirm a short we need bearish confirmation on H1, since the long may still continue.
A local long from the H1 IMB toward AH is possible if the zone gets tested and AH remains intact.
If the price closes above PDH, the bearish scenario will start to lose strength — we’ll need to wait for more information.
Every zone I’ve marked requires additional confirmations on lower timeframes (LTF).
Concept: Smart Money

Gold Buy Limit on SupportGold is about to test its support... Let's take a 1:1 Buy-Limit trade here.

Gold (XAUUSD) – 30 Oct | Key OB (3937.9 – 3930.3) in Focus🟡 Gold (XAUUSD) Analysis – 30 October
Hello Disciplined Traders,
Welcome to the Chart Is Mirror Community 👋
Market Context
• After the recent H4 bearish structure shift , the M15 structure has turned bullish , indicating that H4 is currently in a pullback phase while M15 remains in an active bullish trend.
• Following the M15 bullish CHoCH yesterday, the market pulled back to retest the key demand zone 3916.5 – 3905.7 , which has been respected multiple times.
• Today morning, the Asian session also took support twice from this demand zone , holding the day’s low level and showing internal structure shift to the upside , suggesting that the market is likely aiming to break the 4030.5 previous day high .
Key Observations
• The 3916.5 – 3905.7 demand zone remains a strong intraday base for buyers.
• As per current price action, we will look for a short-term long setup from the buy zone 3937.9 – 3930.3 OB .
• If the market pulls back to this zone and shows LTF bullish confirmation , we will execute our buy setup accordingly.
• A sustained move below 3905.7 will invalidate the current internal bullish structure.
Execution Plan
• Wait for price to retest the 3937.9 – 3930.3 OB zone .
• If the zone is respected and LTF confirmation aligns , we will execute our long setup accordingly .
• If price fails to hold above 3905.7, stand aside and reassess the structure before taking new positions.
• The market remains volatile — manage position size and risk carefully .
Stillness between confirmation and execution defines discipline.
📘 Shared by @ChartIsMirror

Gold Breakdown Alert! Bears Aiming $3980 NextGold is currently showing a descending triangle / bearish channel pattern on the 15-minute chart. After testing the upper trendline resistance around 4113–4115, price has started to reject, indicating potential downward pressure.
The trendlines show clear lower highs and lower lows, confirming a short-term bearish structure. Volume is also decreasing on upward moves, suggesting weakening buying momentum.
📉 Trade Setup (Scalping / Intraday)
Signal: 🔻 SELL XAU/USD below 4105
Entry Zone: 4105 – 4110
Target 1: 4050
Target 2: 3980
Stop Loss: 4135
Risk/Reward Ratio: ~1:2
⚙️ Technical Indicators
Trendline Resistance: 4115
Support Zone: 4050 / 3980
Momentum: Bearish bias
Structure: Lower highs forming under descending resistance
💬 Analyst View
Gold may continue its short-term correction phase if it fails to hold above the 4110 resistance zone. A breakout below 4100 could trigger a fresh wave of selling pressure targeting the 4050 area initially.
If bulls reclaim 4135, this analysis becomes invalid and could shift bias to neutral.

Gold price analysis October 29✳️ XAUUSD Update – 29/10
The early Asian session saw some buying pressure, but the overall trend is still unclear. The 4015 zone is currently acting as an important resistance – buyers need to break this zone decisively to expect the uptrend to be restored.
On the contrary, if the price continues to be rejected at 4014–4015, there is a high possibility that the downtrend will be extended and the price may return to test deeper support zones around 383x.
📉 Trading strategy:
SELL when the price rejection signal appears at the 4014 zone
Target: 3930
If the price closes above 4015, switch to the BUY plan following the uptrend.

XAUUSD support and resistance AOI (SHORT AND WHY)Strong support and resistance AOI (Area of interest) on 4H.
Wait for price to break under the AOI and retest it before entering. Big potential 1:3 to 1:4 RR if tight stop loss.
Weekly is bearish, Daily is bearish and and 4H is bearish for the moment. In 30 min chart 50 EMA has also ben tested twice so big confluence.
Beautiful head and shoulder on the 15M chart that the neckline has been broken. Wait for the restest again before entering short.
So I believe the break and retest of the zone is going to happen anytime market opens.

gold is not gold nowevery thing is clearon chart
gold will fall down in next 6 month to 3800 and then 3400
we will see this
not a good situation for holders

"Gold (XAU/USD) Rebound from Support: Short-Term Bullish Setup"This TradingView chart shows the Gold Spot (XAU/USD) on the 1-hour timeframe. The current price is around $3,993.99, up +1.04%. The chart highlights a potential bullish setup, with a support zone marked in purple around $3,985, and a target zone near $4,015. The blue arrow indicates an expected upward move from the support area toward the resistance zone, suggesting a possible buy opportunity within this range.

GOLD (XAUUSD) — Market Sitting Below 3,980… What’s Next?Gold finally filled the Daily Fair Value Gaps below and we’re now sitting around 3,976 after a heavy pullback. Trend is still bullish overall, this looks like a normal correction after that vertical move up.
I’m watching the current Daily FVG support between 3,950 – 3,980.
If buyers defend this area → I’m looking for long entries.
Buy Plan (Only if we see bullish reaction):
• Entry zone: 3950 – 3980
• TP1: 4050 (small bounce liquidity)
• TP2: 4150 (upper FVG)
• TP3: 4250 if momentum is strong
• SL: below 3930 (clean invalidation)
Bearish invalidation:
If 3,930 breaks and closes below FVG → gold likely continues down to 3,880 next demand area .

[XAUUSD] Market OutlookThe previous Market Outlook is still valid.
In the current situation, we could see a liquidity grab before a reversal .
Otherwise, it would be nice to see the price reach that Daily inefficiency before starting a bullish move.
Wait for chart confirmations such as CHoCH and BoS.
No rush, just patience.

Gold Price Outlook – Trade Setup (XAU/USD)📊 Technical Structure
Gold price (XAU/USD) is trading near $3,965, with the upside capped at the $3,981–$3,990 resistance zone. The chart shows a recent rejection at resistance and sellers stepping in. Unless bulls break above $3,990, the bias remains bearish with a retest of $3,923–$3,915 support zone likely.
🎯 Trade Setup
Entry: $3,81–$3,989 (near resistance)
Stop Loss: $3,993
Take Profit: $3,930 / $3,915
Risk-Reward Ratio: ≈ 1 : 4.53
🌐 Macro Background
Gold is under renewed pressure as US–China trade optimism undermines safe-haven demand. U.S. President Trump said a trade deal with China could be finalized this week, which boosted market sentiment. As Kitco’s senior analyst Jim Wyckoff noted: “The U.S.-China trade tensions have really diminished, with a possible trade deal later this week after a summit meeting between Presidents Xi and Trump. That’s bearish for safe-haven metals.” 【FXStreet】
On the monetary policy side, the Federal Reserve is expected to cut interest rates by 25 bps, lowering the Fed Funds Rate to 3.75%–4.00%. CME’s FedWatch tool shows markets have priced in nearly a 100% probability of this move, with further easing expected in December. While this provides some support to gold, trade optimism currently outweighs Fed dovishness.
🔑 Key Technical Levels
Resistance: $3,981 – $3,990
Support: $3,923 – $3,915
Psychological Level: $4,000
📌 Trade Summary
Gold remains capped below $3,990 and is at risk of further declines toward $3,930–$3,915. Short positions near resistance are favoured, unless Fed surprises with a deeper cut or US–China trade talks collapse, which could flip sentiment.
⚠️ Disclaimer
This analysis is for reference only and does not constitute trading advice. Trading involves significant risk, and proper risk management is essential.

Weekly Gold Analysis As you can see I expect the 2 Fair value gaps to be tested before the market makes another move towards the downside

Gold 4H — Bearish Control With FVG Above
Gold continues to trade under bearish structural dominance, currently ranging between 4,161.535 (local supply) and 4,004.280 (structural support).
The market remains in compression, forming a potential redistribution range within a broader downtrend.
If price breaks below 4,004.280, it confirms a bearish BOS, opening the path toward the 4H Demand Zone (3,960–3,944) — where a reaction or further continuation could occur.
Above, two unmitigated Fair Value Gaps (FVGs) remain at 4,240–4,320, serving as potential retracement targets if the market shows a corrective pullback after internal CHoCH.
However, as long as 4,161 holds as resistance, bearish dominance stays intact.
Range → Break → Mitigation → Continuation → Expansion.
Until structure shifts, rallies are just liquidity grabs.
Technical Outlook Summary:
Dominant Bias: Bearish
Range: 4,161 – 4,004
FVGs Above: 4,240–4,320
Demand Zone: 3,960–3,944
Break Below 4,004: Bearish continuation
Break Above 4,161: Temporary retracement, not reversal
NFA | AI generated | Educational Purpose Only
OANDA:XAUUSD FXOPEN:XAUUSD

XAUUSD: Exploring Potential 30% Upside in Safe-Haven Asset XAUUSD: Exploring Potential 30% Upside in Safe-Haven Asset Amid Geopolitical Tensions – SWOT and Intrinsic Value Insights
📊 Introduction
As of October 28, 2025, XAUUSD (Gold/USD) is experiencing a short-term correction following record highs above $4,300 earlier this month, trading around $3,950 per ounce. This pullback reflects improved risk appetite in equity markets amid stabilizing U.S. economic data and reduced recession fears, with the S&P 500 up 2% week-to-date. However, broader macroeconomic factors, including persistent inflation at 3.2% year-over-year and central bank gold purchases exceeding 800 tonnes year-to-date, underpin a supportive environment. Sector dynamics highlight gold's role as a hedge against geopolitical risks, such as escalating Middle East tensions and U.S.-China trade uncertainties, though volatility is elevated due to a strengthening USD index near 105.
🔍 SWOT Analysis
**Strengths 💪**: Gold serves as a proven inflation hedge and store of value, with central banks accumulating over 900 tonnes projected for 2025 per analyst estimates, driving demand. Its liquidity is unmatched, with daily trading volumes surpassing $200 billion, and physical holdings in ETFs like GLD have risen 15% year-over-year to 1,200 tonnes. Low correlation to equities (0.2 beta) enhances portfolio diversification, while above-ground stocks of approximately 218,000 tonnes ensure scarcity amid annual mine production of just 3,500 tonnes.
**Weaknesses ⚠️**: As a non-yielding asset, gold incurs opportunity costs in high-interest environments, with U.S. 10-year real yields at 1.8% pressuring holdings. All-in sustaining costs (AISC) for miners have risen 8% to around $1,600-1,700 per ounce due to energy and labor inflation, per industry reports, potentially squeezing margins if prices dip. Storage and insurance fees add 0.5-1% annual costs for physical investors.
**Opportunities 🌟**: Heightened geopolitical risks, including potential escalations in Ukraine and Taiwan, could boost safe-haven inflows, similar to the 25% price surge post-2024 elections. Monetary policy easing by the Fed (projected 50bps cuts by year-end) and ECB may weaken the USD, favoring gold, with forecasts targeting $4,500+ by mid-2026. Emerging market demand, led by India and China (combined 1,500 tonnes annual consumption), offers growth amid de-dollarization trends.
**Threats 🚩**: A stronger USD from hawkish Fed pivots or robust U.S. growth could cap upside, as seen in the recent 5% correction. Competition from high-yield bonds and cryptocurrencies (Bitcoin up 25% YTD) diverts capital, while environmental regulations may increase AISC by 10-15% over the next five years. Oversupply risks from recycled gold (1,200 tonnes annually) persist if economic slowdowns reduce jewelry demand.
💰 Intrinsic Value Calculation
Adopting a value investing approach for commodities, we estimate gold's intrinsic value using a monetary backing model, which assesses its role as a reserve asset relative to money supply, incorporating a margin of safety (20% discount). Key inputs from public data: U.S. M2 money supply at $22.195 trillion, U.S. gold reserves at 8,133 tonnes (≈261.5 million ounces), and an assumed fair coverage ratio of 6% (historical average post-Bretton Woods, adjusted for modern dilution; current coverage ≈4.7% at $3,950/oz).
Formula: Intrinsic Value per Ounce = (M2 Money Supply × Coverage Ratio) / Gold Reserves in Ounces
- M2 × 6% = $22.195T × 0.06 ≈ $1.332T
- $1.332T / 261.5M ounces ≈ $5,092
Apply 20% margin of safety: $5,092 × 0.8 ≈ $4,074
At current price ≈$3,950, XAUUSD appears undervalued by ≈3-29% (factoring upside to $5,092 fair value aligned with central bank demand and inflation metrics). No debt flags apply directly, but sustainability relies on demand outpacing monetary expansion. 📈 Undervalued.
📈 Entry Strategy Insights
Institutional strategies emphasize support zones near $3,900-3,940 (aligned with 50-day SMA and recent lows) for unleveraged, long-term positions through dollar-cost averaging (DCA). Scale in during 3-5% dips, leveraging non-repainting volume indicators to validate rebounds from oversold levels. Ideal for building 5-10% allocations over 1-3 months, with targets at $4,200 for partial exits on breakouts. 🚀 Spot zones.
⚠️ Risk Management
Allocate 1-5% of portfolio to gold to buffer against volatility, diversifying with bonds or equities for balance. Implement trailing stops 5-10% below entry (e.g., $3,750) and maintain long-term holds if macroeconomic hedges strengthen, tracking central bank reports and USD trends. Caution on sharp reversals from rate hikes or equity rallies.
🔚 Conclusion
Gold's entrenched role as a monetary hedge, coupled with undervalued metrics and robust demand drivers, supports potential growth to $4,074+, with safety margins embedded. Key takeaways: Prioritize geopolitical monitoring for demand spikes, cross-verify money supply data independently.
This is educational content only; not financial advice. Always conduct your own due diligence.

Gold 1H - Intraday Trading Plan
📅 Date: October 29, 2025 | Session Update: 13:00 VN Time
📈 Market Context
Gold remains under pressure after yesterday’s failed recovery above the $4,030 mark.
Stronger U.S. economic data and firm Treasury yields continue to weigh on the metal, while investors await upcoming inflation expectations data for further direction.
Despite short-term bearish sentiment, the $3,975 – $4,000 region continues to act as a key liquidity and accumulation zone, where large orders from institutional players may still be positioned.
For today’s session, expect choppy movement within $3,970 – $4,040, with possible liquidity sweeps around both ends before the next impulsive leg forms.
🔎 Technical Outlook (1H / Smart Money Concept)
Overall market structure: Corrective, following a failure to hold above $4,050 in the previous session.
Liquidity grab: Below $3,980 and above $4,030 has created short-term imbalance zones.
Discount demand zone: $3,975 – $3,985
Premium supply zone: $4,035 – $4,050
A confirmed BOS (Break of Structure) above $4,015 on the 15M timeframe would signal a potential bullish intraday reversal.
🟢 Buy Setup (Reversal / Accumulation Bias)
Entry Zone: 3,975 – 3,985
Stop-Loss: 3,968
Take-Profit Targets:
→ TP1: 4,015
→ TP2: 4,035
→ TP3: 4,060
Rationale:
Price continues to respect the psychological level at $4,000, suggesting possible accumulation.
Wait for BOS or ChoCH confirmation on M15 before executing buy positions.
A push above $4,015 could signal the start of a reaccumulation phase toward the premium zone.
🔴 Sell Setup (Continuation Scenario)
Entry Zone: 4,035 – 4,050
Stop-Loss: 4,062
Take-Profit Targets:
→ TP1: 4,010
→ TP2: 3,980
→ TP3: 3,950
Rationale:
The $4,035 – $4,050 area aligns with a premium pricing zone, where short-term sellers may defend liquidity.
Look for bearish ChoCH confirmation on the lower timeframe to confirm rejection.
This setup favors continuation trades in case gold fails to reclaim the intraday structure.
⚠️ Risk Management Tips
Avoid entries during major U.S. data releases — high volatility can trigger fakeouts and wide spreads.
Always wait for clear market structure confirmation before execution.
Take partial profits at near-term liquidity pools and trail stop-loss as the trade progresses.
Keep your risk per position below 1% — volatility remains elevated within this tight range.
✅ Summary
Gold is consolidating near the $4,000 key support zone, showing early signs of reaccumulation but still lacking confirmation.
A break and hold above $4,015 could ignite a short-term bullish move toward $4,050 – $4,060.
Conversely, a clean break below $3,970 would likely expose $3,950 and extend the bearish correction.
Patience and structure confirmation remain the key — liquidity traps are likely before any clear directional move.
FOLLOW KHANG_TRADER for precision market insights ⚡

When the market was confused, I shorted at 3975#XAUUSD OANDA:XAUUSD TVC:GOLD
Yesterday's short profit marked a good start to this week's trading. Today we will continue this good habit and continue to make profits.
First, the weekly MA5 moving average has broken below and is moving closer to the MA10 moving average. Secondly, through the hourly chart and 4H chart, we can find that the bears still dominate the market. Then our trading idea is very clear, which is to focus on shorting on rebounds.
Gold has already fallen below 3950, so it is likely to hit the 3900 integer mark next, or even 3880-3870, or even the weekly MA10 around 3835. However, in the short term, I still recommend not blindly chasing shorts and be wary of a possible rebound in the short term. Conservative traders can wait for a rebound to 3960-3975 before attempting to continue shorting gold.

Gold the safe haven Good morning fams, Gold is showing some sign of not going down further in the triangle respecting the trend line hopeful if it doesn't break and stay below 4055 we may see more bullish movements back to 4158 - 4160 but if it breaks 3954 is the next target... let keep observing as will sit on our and wait patiently ( Remember the market takes from the inpatient and give to the patient.)

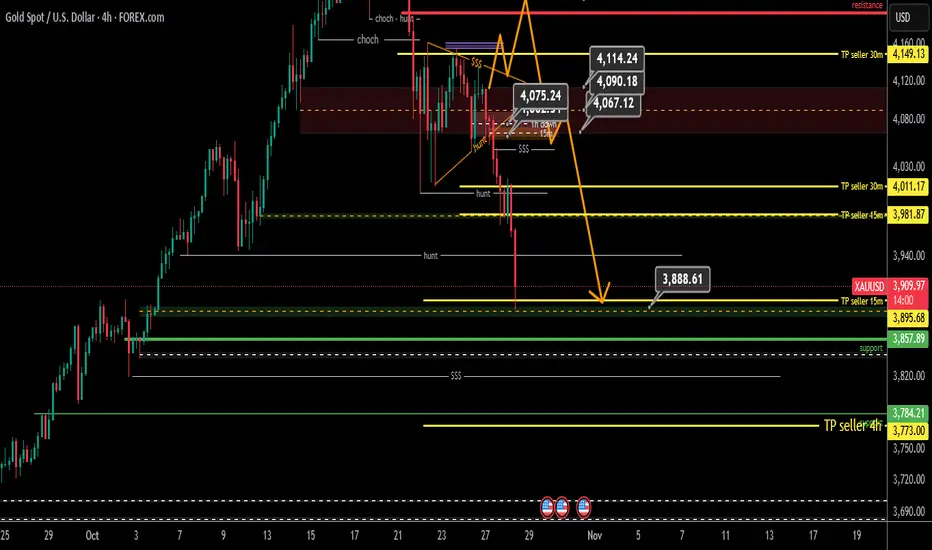
Update Two 4-Hour Gold Analysis
Hello Traders
So far, yesterday's analysis target has been touched, but the seller is still present in the market, and today the 4-hour seller entered the market, and the long-term 4-hour analysis that we had last week gained more strength, the 4-hour sellers target was defined as 3773, which was explained in the relevant post about the entry of sellers. So, every pullback will still have more sellers in the market. For the sell, all the yellow lines of the TPs settled by the candlestick failure act as current resistance and are considered the pullback zone.
Good luck.
Links to the two analyses:
Update on gold trading strategies during the US trading session.Gold has been volatile recently, with large fluctuations. Today's price swings approached $100, making it difficult for non-professional investors. The current pullback is primarily due to the smooth progress of US-China trade negotiations, with both sides releasing positive signals. This has significantly alleviated some economic risks and geopolitical dynamics. Optimism in global stock markets reflects this view, which has become a key factor weakening demand for safe-haven precious metals. Short-term market sentiment is driven by news, with buying retreating and selling intensifying, overshadowing the positive interest rate outlook and putting pressure on gold prices.
Technically, after forming a double top at $4,380 last week and then retreating, the gold market is currently consolidating at the bottom, with a short-term structural bias favoring the bearish trend. The short-term trend of the one-hour chart suggests a converging triangle pattern, suggesting continued corrections in gold. The overall bias remains bearish. Currently, the upper resistance is in the $4050-4060 area, while the lower support is in the $4000-4010 area. If it falls below $4000, it could potentially trigger a downward trend towards $3800, the target level previously calculated from the ascending triangle pattern. As of the time of publication, the recommended short-term trading strategy for gold is to primarily buy on dips after rebounds. Buying on the long side is not recommended for non-experts, as it carries significant risk.
US Trading Strategy: SELL: 4050-4060, TP: 4030-4040, SL: 4000-3990
Recent market volatility has been high, posing certain risks. We should find appropriate methods to address these shortcomings and seize opportunities to make our investments more successful.

GOLD READY TO BUYPROJECTION (BULLISH)📈📉👀🗞️
1. Fill out the IMB @ discount zone.
2. A sweep of EQL
3. A sweep of of SSL
4. A bullish BOS above IDM
5. A sweep of EQH
6. Fill out the IMB @ Premium zone
7. Asweep of BSL
