Gold bullish surge With weekly high pierced I'm looking to take a buy around 3423.5 - 3430 area where there is previous support, I should be targeting 3467.03 area. i will not jump on the shorting band wagon, will observe price action and will take it from there. but initial bias is long
But if the price does not respect my buy area, I have another zone to take a long from, the area is 3414.871 - 3420 respectively. The market does whatever it wants so let's observe and be patient.
GOLD trade ideas

XAUUSDRisk warning, disclaimer: the above is a personal market judgment based on published information and historical chart data on Tradingview, all analysis is only subjective. Hope investors consider, that I am not responsible for your investment decision.
Thank you.
Good luck

DeGRAM | GOLD fixed above the support zone📊 Technical Analysis
● XAU/USD rebounded from the 3,310–3,320 support zone, breaking short-term resistance and confirming a higher low within the structure.
● The move opens the way toward 3,374, with a breakout above this level exposing 3,402 and 3,433 as the next resistance targets.
💡 Fundamental Analysis
● Softer US PMI data and moderating yields have eased USD strength, reviving gold’s safe-haven bid. Recent IMF comments on slower global growth add to demand for protective assets.
✨ Summary
Bullish above 3,320; targets 3,374 → 3,402 → 3,433. Invalidation below 3,310.
-------------------
Share your opinion in the comments and support the idea with a like. Thanks for your support!

XAUUSDUpdate:
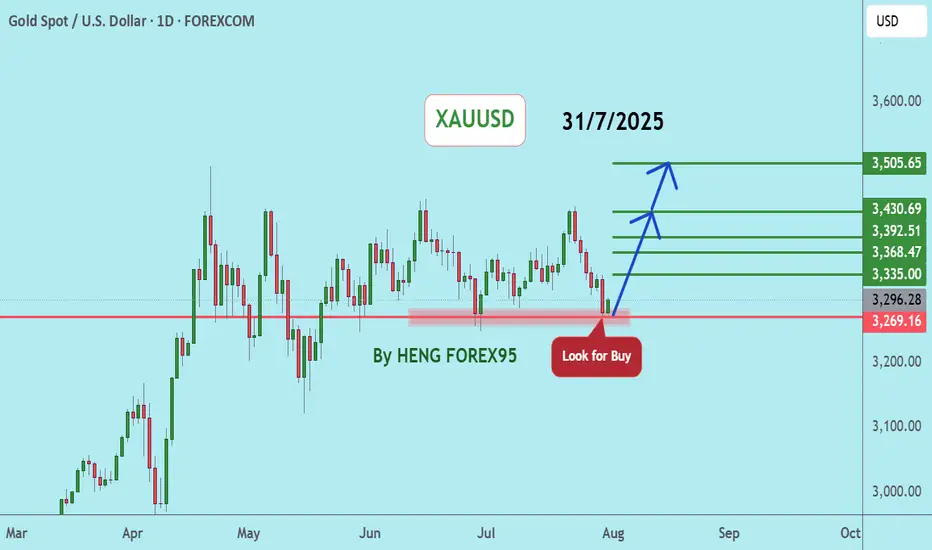
Gold Price Trend: As per our previous analysis on July 28, 2025, the price has now tested the support at 3,269. We expect that if the gold price can hold above 3,249, the gold price trend will remain bullish. We recommend considering buying in the red zone.
🔥Trading futures, forex, CFDs and stocks carries a risk of loss.
Please consider carefully whether such trading is suitable for you.
>>GooD Luck 😊
❤️ Like and subscribe to never miss a new idea!
Long on GoldFor the past years, Gold has been longing. However, it has been ranging in Aug using the daily or 4 hrs time frame. But, tracking down to the smaller time frame, using your support and resistance level, and chart patterns, you can easily identify the next movement. Also, on the lower time frame, it is easy to identify the higher highs and higher lows and lower highs and lower lows.

Gold (XAUUSD) Technical OverviewPrice is currently moving within the 3445–3450 range, showing short-term bearish pressure. The area around 3430 is an important level to watch.
A sustained H4 close below 3430 could open the way toward the next support zone near 3405–3390.
If price instead shows a bullish reversal from the 3430 region, upside retests toward the 3460 resistance area may follow.
This setup highlights 3430 as a key pivot for short-term directional bias. Traders should monitor how price reacts around this zone before planning the next steps.

Is gold about to surge higher again?Gold opened at 3438 today, then began a volatile pullback to build momentum. It hit a low of 3437 before rebounding. So far, the bulls have retreated after reaching 3490.
We're focusing on support at 3467-3465, and we'll continue to buy if it breaks down.

Gold Plan (28/08) – Captain VincentXAU/USD – Gold at Storm Breaker 3400: Consolidation before breaking ATH?
1. Market Waves 🌍
Throughout last week, gold consistently formed BOS (Break of Structure) , confirming that buyers remain dominant.
Currently, price is moving around 3,394 – 3,400, right at Storm Breaker 🌊 – the critical barrier before aiming at the previous ATH 3,424.
The big question: Will gold consolidate and then smash through ATH, or does it need a pullback towards key support before surging stronger in September?
2. Technical Outlook ⚙️
Storm Breaker 🌊 (Major Resistance): 3400 – 3424 (previous ATH). This is the gateway gold must conquer to unlock a new bullish trend.
Golden Harbor 🏝️ (Key Support): 3375 – 3355 – 3330. Confluence of FVG + Fibonacci 0.5/0.618 , likely to attract liquidity if price corrects.
Short-term scenario: Price may pull back to Golden Harbor before breaking higher.
3. Captain Vincent’s Map – Trade Scenarios 🪙
🔺 Quick Boarding 🚤 (BUY Scalp – pullback priority)
Entry: 3353 – 3355
SL: 3349
TP: 3356 → 3359 → 3361 → 33xx
🔻 Storm Breaker 🌊 (SELL reaction – previous ATH)
Entry: 3422 – 3424 (if tested)
SL: 3430
TP: 3419 → 3415 → 3410 → 3405 → 33xx
4. Captain’s Note ⚓
“The gold ship is now approaching Storm Breaker 🌊 3400 – 3424 .
If it breaks through, a vast ocean opens with a new bullish trend.
But if rough waves push it back, patience at Golden Harbor 🏝️ will secure the anchor and prepare for September’s big wave.”

Gold Trade Plan 19/08/2025Dear Traders,
The market is Consolidate between the 3320-3360 areas. There is no specific analysis except selling at the top and buying at the bottom.
Regards,
Alireza!

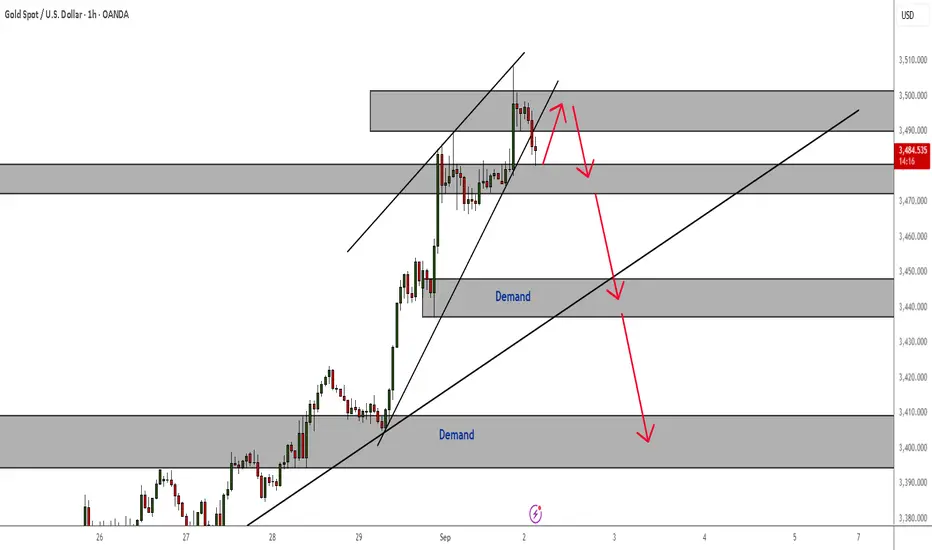
XAU/USD 1HOUR Chart Pattern...XAU/USD 1H Chart – Bearish Setup
Trend Context: Price reached an all-time high inside an ascending channel and showed rejection at the top.
Entry Zone: Short entries can be considered near the channel resistance / recent rejection area around 3485 – 3495.
Target Point: Bearish projection suggests a decline toward the support zone / channel base around 3440 – 3450.
Stop Loss: Above recent swing high (3500+) to protect against false breakouts.
Risk–Reward Ratio: Approx. 1:2 (risking ~15 points for a potential 30–40 points).
Summary: After forming a new high, Gold shows signs of exhaustion and reversal pressure. A breakdown toward the marked target zone is likely if momentum stays bearish.

XAUUSD – Medium-Term Trading OutlookXAUUSD – Medium-Term Trading Outlook
Hello traders,
Gold is now entering the final stage of its flag formation. Medium-term traders are watching closely for a clear breakout confirmation, as this will define the next medium- to long-term move. Once price confirms the break, the plan is to enter immediately in the direction of that breakout.
In the meantime, short-term and intraday traders can continue trading within the flag, taking advantage of scalping opportunities inside the range.
From my perspective, the probability of an upside breakout and continuation of the broader bullish trend is fairly high after such a long consolidation. To optimise entries, it makes sense to buy near the lower boundary of the trendline, with stop-losses placed immediately if the pattern breaks down. The key level to watch is the Fibonacci retracement 0.5 at 3354 – an area that acts as both dynamic and static support, as well as a critical Fibonacci level. This is a strong zone for long-term buy setups.
Additionally, an earlier entry can be considered around 3372, where the previous candle showed strong buying momentum. Traders entering here should keep stops tight, just below the nearest support.
This bullish outlook would only be invalidated if price breaks below the lower trendline and closes firmly underneath it, confirming a reversal.
Wishing you success with this trading plan. If you share a similar outlook, feel free to drop your thoughts in the comments and let’s discuss further.

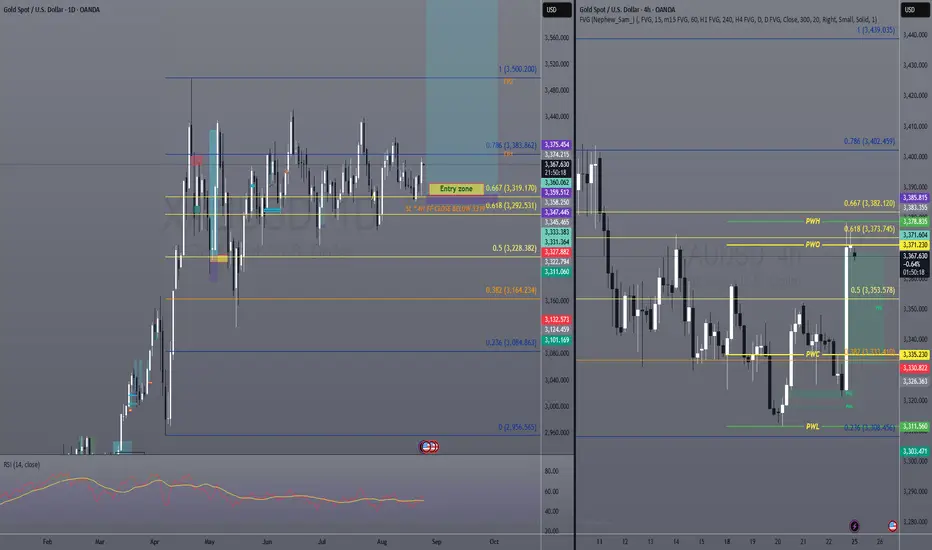
Unlocking Gold’s $3,600 Rally Before the Crowd /Best Entry Point1️⃣ General Overview
Gold remains in a corrective phase. Unless we see a clear 4H close above 372, bearish corrective pressure will stay stronger. However, certain zones may trigger bullish reactions if respected.
2️⃣ Key Levels
353 → First potential reversal area.
364 – 373 → Upside targets if 353 closes above this price on the 4H timeframe.
378 → Breakout level; above it price opens the way to higher targets.
382 – 392 – 402 → Next resistance levels if price closes above 378 on 4H timeframe.
335 → Strongest potential weekly buy zone if tested.
329 – 335 (ideal 35–29 range) → Ideal buy zone, though less likely to be visited this week.
3️⃣ Trade Scenarios & Setups
🔹Bullish Setup:
4H close above 353 → look for a move toward 364 → 373 → swing/open target.
4H close above 378 → momentum extends to 382 → 392 → 402.
Above 402 → new analysis will be required.
🔺 Bearish Setup:
4H close below 353 → decline toward 335 (strong weekly buy zone).
An extended drop into the 35–29 range = an ideal buy setup, but the probability is low.
Gold analysis Through the recent movement of gold and the incoming buying signals, we conclude that it will certainly continue to rise to target 3410, then 3440, and after that to our final target before the next analysis, 3485. Then we will see where gold is heading, and it is also expected to break through the 3500 areas!

Waiting for goldGold has showed some down movement since the asia high, right now i am patiently waiting for gold to frop to support zones for further buys.
Support zones: 3362, 3352
Have a nice day trading and remeber to stay patient and don't risk your capital

XAUUSDThere is a high chance as we can see the accumulation that gold will breakout. and hit 3501.
The key reasons for this trade.
1. Chart displays signs of bullishness,
2. FED seems to cutting rate in september
3. Donald trump has fired Lisa cook
4. before long FED gives in trump demands.

XAUUSD IDEAS AND OUTLOOK FOR NEXT WEEK Xauusd Has Succsesfully rejection from higer timeframe at h4 and daily trendline and divergence at h1 timeframe

GOLD SHORTExpecting Gold to go short after manipulation of Asia high/high of the day.
Entry ONLY if there will be a candle confirmation engulfing M15 or H1 and must close below Asia high.
Note: Short might go from current prices as it is testing supply H4. The entry might be after closing current M15.
SL - Above engulfing candle or 100 pips.
TP - TP1 - 1OO pips, TP2 - 200 pips, TP3 - H1 demand zone.
IMPORTANT!
NO CONFIRMATION = NO ENTRY!
GOOD LUCK!

Completing wave 4 We are currently in the 4th wave and correcting from the third wave rise soon we will be bullish but for now we are selling

Gold Break of All Time Highs May Lead to A RetracementNow that ATHs have been claimed, it might be time for a pullback.
Wait for a retest of that broken trendline support or a break of that support structure highlighted on the H1 time frame and begin to target demand zones as price steadily moves to the downside.

XAUUSD UPWARNING: Do not enter until you see clear signs of exhaustion. This market is showing extraordinary institutional strength that transcends traditional technical analysis.

Gold XAUUSD Buy SetupGold is forming a potential buy setup.
If price reaches the FVG zone and the M15 candle closes above the 50% level, a buy entry can be considered.
⚠️ Always wait for candle confirmation and manage risk properly.
Entry Zone: FVG 50% level
Trade: 3430+
Stop Loss: Below FVG zone
Risk/Reward: High probability setup"

Is the gold price squeeze coming to an end?Is the gold price squeeze coming to an end?
Gold prices continued their upward trend in early Asian trading on Tuesday, reaching a near two-week high of $3,386 per ounce. The bullish market sentiment stems primarily from two factors: growing concerns about interference with the Federal Reserve's independence and strengthening expectations for a September rate cut. The CME FedWatch tool currently shows that the market's expectation of a 25 basis point rate cut in September has risen to 84.3%, significantly higher than the 61.9% seen a month ago. Rising expectations of a rate cut have further boosted gold's appeal as an interest-free asset.
However, this week will see the release of several key data, including the US Consumer Confidence Index, Durable Goods Orders, and the Richmond Fed Manufacturing Index on Tuesday, as well as revised second-quarter GDP and the July Core PCE Price Index on Thursday. Strong data or unexpected inflation could strengthen the US dollar and put pressure on gold prices.
From a medium-term perspective, I remain cautiously bearish on gold. Four consecutive upper shadows on the monthly chart indicate significant upward pressure, and the technical outlook remains bearish. From a fundamental perspective, the impact of tariffs has been fully priced into the market. Even if new measures are introduced in the future, they are unlikely to replicate the impact seen in the early days of Trump's presidency. While geopolitical turmoil continues, the lack of substantive participation from major powers has limited its impact on gold prices. Market expectations of a Fed rate cut have been repeatedly hyped for nearly two years, and the "crying wolf" effect is gradually emerging. Especially during the current Trump policy cycle, the Fed's independence is under scrutiny, and the actual impact of its policies may be less than before.
Based on the above logic, I believe gold will continue to decline in the medium term, eventually testing the 3150-3120 range, or even retesting the 3000-2950 level—the starting point of this round of tariff activity. Key support currently lies at 3350, with significant intraday support at 3330-3335. Upward, attention should be paid to the 3400-3410 resistance zone and whether a successful breakout of the upper boundary of the daily triangle pattern is possible. If gold can hold above 3380, it could potentially challenge resistance above 3400. Conversely, if continued pressure persists, a direct, sweeping decline cannot be ruled out.
In terms of trading, we recommend a cautious bullish stance today, relying on support near 3365. Conservative investors can look for dip opportunities near 3350. For short positions, we can wait for price to test the 3400–3410 resistance zone or the upper boundary of the daily triangle. This month's closing is crucial and will provide important guidance for the medium-term trend.
In short, despite gold's short-term strength, I still believe the medium-term bearish trend remains intact. Amidst the market frenzy, we need to remain calm. After all, only when the tide recedes do we discover who's been swimming naked.
