GOLD Buy and Sell Zones for the next few weeksLong term bullish gold, short term bearish.
If we break the sell zone then we might see a new bullish momentum short term.
Trade ideas

XAUUSD - Sell Setup (Risky)Hi All,
I have entered SELL as per the setup. Hope this will give us Green Pips.
Thanks & Best Of Luck

Poteential bullish reversal?The Gold (XAU/USD) is reacting off the pivot, which is a pullback support and could bounce to the 50% Fibonacci resistance.
Pivto: 3,952.85
1st Support: 3,800.21
1st Resistance: 4,148.52
Disclaimer:
The above opinions given constitute general market commentary, and do not constitute the opinion or advice of IC Markets or any form of personal or investment advice.
Any opinions, news, research, analyses, prices, other information, or links to third-party sites contained on this website are provided on an "as-is" basis, are intended only to be informative, is not an advice nor a recommendation, nor research, or a record of our trading prices, or an offer of, or solicitation for a transaction in any financial instrument and thus should not be treated as such. The information provided does not involve any specific investment objectives, financial situation and needs of any specific person who may receive it. Please be aware, that past performance is not a reliable indicator of future performance and/or results. Past Performance or Forward-looking scenarios based upon the reasonable beliefs of the third-party provider are not a guarantee of future performance. Actual results may differ materially from those anticipated in forward-looking or past performance statements. IC Markets makes no representation or warranty and assumes no liability as to the accuracy or completeness of the information provided, nor any loss arising from any investment based on a recommendation, forecast or any information supplied by any third-party.

Gold up correction wave X Gold price is currently in wave X of correction WXY. Today, 06-11-2025, wave 2 is expected to correct to 3958. Buying from 3960, targeting 4072 as wave 3. Stop loss at 3945.

Gold bulls are strong; is 4100 still far away?
News:
Gold rallied after testing the 3915 area again, breaking through resistance levels at 3975-80 and 4030 throughout the day, closing with a large bullish candlestick and forming a bullish engulfing pattern.
This morning, it rose to around 4046 before falling back and breaking below the key support/resistance level of 4005-10.
Technology manifestation:
From the 1-hour chart, the current short-term resistance level to watch is 4035-4030, with a key resistance level at 4060-4055. If this area is broken, the gold price may reach 4100. The short-term support level to watch is 3960. The recommended strategy is to buy on dips, and to observe more and trade less in the middle, avoiding chasing the market and patiently waiting for key entry points.
I will provide specific operational strategies in the channel, so please pay attention.
Trading strategy:
Buy:3989-3986, SL: 3975, TP: 4010-4020-4030

GOLD LONDONGOLD LONDON TIME layer by layer on 15 min is a sniper strategy developed by shavyfxhub .
we combine EMA+SMA+TIME + STRUCTURE
on intraday hourly candle dont give sniper entry,our aim is sniper or nothing.
4000-3990-3985 will be watched
#gold

Xauusd - Support Retest Before Bullish Continuation to 4014Price has been moving within a defined range, rejecting the resistance zone around 4000–4020 several times. After failing to break higher, it pulled back and is now heading toward the highlighted support zone near 3960–3970.
This support area has shown strong buying interest previously, with multiple long-wick rejections. If price taps this zone again and shows bullish confirmation (e.g., rejection wicks or bullish engulfing), a potential reversal toward the upper resistance zone becomes likely.
A clean bounce from support may drive price back toward the 4014 target inside the resistance band.
Key Levels
• Support: 3960–3970
• Resistance: 4000–4020
• Bullish Target: 4014
Bias: Bullish if support holds; bearish only on a confirmed breakdown below 3960.

SET A SELL LIMIT ORDER ON GOLD!!!!!Gold made a strong bearish bias on the hourly time frame am looking forward to see price made a pull back into my ob level at 3,982 area for another sell off entry....
Lets know your views on this.....

ANFIBO | XAUUSD - Stuck in Sideway channel [11.6.2025]Hi guys, Anfibo's here!
XAUUSD Analysis – Daily Trading Plan
Overall Picture:
At present, OANDA:XAUUSD is moving sideways within a well-defined H1 channel, showing signs of short-term consolidation after recent volatility. The market is currently lacking a clear directional bias, as both buyers and sellers are testing the upper and lower bounds of this intraday structure. Such conditions often favor range-trading strategies, where precision and timing become crucial for capturing short bursts of momentum.
In this context, our plan today remains straightforward and tactical — trade directly off the trendlines of the channel. In other words, we will look to buy at the lower boundary of the range and sell near the upper boundary, while also being prepared to switch positions if a breakout occurs in either direction.
Trading Plan for Today:
>>> SELL ZONE:
(1) ENTRY: 4015 - 4025
SL: 4030
TP: 4050
(2) ENTRY: 4060 - 4080
SL: 4090
TP: 4000 - 3955
Risk Management:
- Stick to small-to-medium positions within the range; increase size only on confirmed breakouts.
- Keep stops tight, as sideways phases tend to trigger false signals.
- Maintain Risk:Reward ≥ 1:2 and avoid overtrading in choppy conditions.
- Reassess bias once the H1 channel is clearly broken.
Conclusion:
Gold is currently in a sideways consolidation phase within its H1 channel, awaiting fresh catalysts to determine direction. Until a decisive breakout occurs, the most effective approach is range trading — buying near support, selling near resistance, and reacting dynamically to any confirmed breakout.
The plan today is simple yet strategic:
Patience and discipline will be key to capitalizing on this quiet yet potentially explosive setup.
HAVE A NICE DAY, GUYS!

Beware of a reversal during gold price fluctuations.
News:
On Tuesday (November 4), spot gold fell 1.7% to close at $3,931.78 per ounce, while December U.S. gold futures also declined 1.3%, settling at $3,960.50. Increased internal divisions among Federal Reserve officials and a cooling of market expectations for a December rate cut helped the dollar index break through the 100 mark, reaching a more than three-month high, significantly pressuring gold prices.
However, concerns about a U.S. stock market bubble and the longest government shutdown in history continue to provide safe-haven support for gold prices. In the short term, gold bears have a slight advantage, and gold prices face the risk of further correction. However, if Wednesday's ADP private sector employment data is disappointing, gold prices could see a dramatic reversal.
Specifically:
Gold maintains a long-term bullish tone, with prices continuing their upward trend today, holding above key moving averages. The daily chart shows that the long-term bullish outlook remains solid as gold prices hold above the key technical level of the 100-day exponential moving average (3675.95).
However, in the short term, given that the 14-day Relative Strength Index (RSI) is hovering near the midline, a further consolidation phase cannot be ruled out, reflecting that gold is currently in a neutral momentum phase.
On the upside, the first resistance level to watch is the psychological level of $4000. If upward momentum continues, spot gold is expected to retest the October 31 high of $4045. A further break above this level would target the October 23 high of $4155.
On the downside, initial support for gold is located at the lower Bollinger Band at $3850. The emergence of more bearish candlestick patterns could indicate continued downward pressure, potentially dragging prices to the next support level – the September 25 low of $3720. The bullish outlook for gold remains unchanged.
Trading strategy:
Buy:3955-3950, SL: 3945, TP: 3985-4010-4030
Gold Rebuilds Structure Above $3940, Eyeing $4030 Liquidity Pool
🔍 Market Context
Gold is attempting to regain bullish momentum as safe-haven demand remains supported by rising geopolitical tensions and uncertainty around the upcoming US ADP employment data.
The market continues to oscillate between risk aversion and rate expectations — with the Fed’s hawkish tone keeping the Dollar capped but steady.
At the same time, capital flow rotation from equities into defensive assets is quietly supporting the metal’s structural recovery, with gold holding above key liquidity levels despite intraday volatility.
📊 Technical Analysis (H1–H4)
After forming a double-bottom structure near $3,938, XAU/USD has reclaimed the 38.2% retracement zone (3,974–3,975) from its previous bearish leg.
This area now acts as a pivot zone, separating short-term bullish continuation from potential retracement.
The chart reveals a classic liquidity cycle shift:
Phase 1: Sweep of downside liquidity below 3,930, marking an internal structural low.
Phase 2: Expansion leg reclaiming short-term FVGs, signaling a potential smart money accumulation phase.
Phase 3: Repricing toward upper liquidity targets aligned with Fibonacci extensions.
Key Technical Zones:
• 💎 Liquidity Base: 3,938 – 3,950 (recent demand re-entry area)
• 🎯 Rejection Zone 1: 3,974 – 3,999 (previous inefficiency block)
• ⚙️ Target Zone: 4,033 – 4,045 (1.272–1.618 Fibo extensions, liquidity pool)
• ⚠️ Invalidation: Break below 3,920 would shift structure back to distribution.
🎯 MMFLOW Scenario
If gold sustains above the 3,950 support cluster, buyers are likely to extend the retracement toward 3,999–4,033 where resting liquidity sits.
A clean rejection from 4,000 could trigger an intraday pullback — but as long as price holds above the 3,938 OB base, the bullish recovery structure remains intact.
The short-term narrative favors controlled accumulation, suggesting that smart money is building positions into liquidity zones before the next impulsive move.
⚜️ MMFLOW Insight:
“Liquidity isn’t random — it’s engineered. Every move leaves a footprint, and gold is tracing its next one above $3,950.”

Gold Technical Outlook: Bearish Wedge Formation Signals Potenti
The four-hour chart of gold (XAU/USD) shows price action developing within a rising wedge pattern, which typically indicates a potential bearish reversal if a breakdown occurs. The price is currently hovering around $3,995, near the 50-period exponential moving average that acts as dynamic resistance, while the 200-period EMA below provides structural support for the broader trend.
From a technical perspective, the bias remains bearish as long as the price stays below the upper boundary of the wedge and under the $4,060 resistance level. A confirmed break below the wedge’s lower trendline could trigger a decline toward $3,950 and $3,890, with further downside potential extending to $3,820 and $3,730.
Conversely, a breakout above $4,025–$4,040 could lead to a temporary corrective rally toward $4,160 before sellers potentially regain control. Overall, gold maintains a downward bias in the short term, with momentum favoring further weakness unless the price stabilizes above $4,060.

gold🪙 Gold (XAU/USD) – Controlled Accumulation in Motion
After reaching the $4,000 psychological zone, gold entered a
structured
accumulation
phase
around $3,970 not weakness, but a liquidity reset before the next leg.
The price behavior along the velocity curve suggests that buyers are quietly repositioning before testing the upper friction level near $4,320.
This isn’t a drop it’s the market breathing before expansion.
Thoughtful Observer

Gold continued to fluctuate, with an upward trend still brewing.
News:
Gold prices narrowed their losses on Tuesday (November 4) as investors awaited upcoming U.S. economic data for further clues about interest rate trends.
Significant internal divisions exist within the Federal Reserve.
Federal Reserve Chairman Jerome Powell delivered a hawkish speech, stating that a December rate cut should not be taken for granted. This reduced the probability of a December rate cut, which dampened safe-haven buying of gold and supported a rise in both the US dollar and US Treasury yields. In particular, the dollar's rise to a three-month high put significant pressure on gold prices. However, due to the ongoing US government shutdown and international geopolitical instability, the uncertainty surrounding the Fed's monetary policy continues to support gold and limit its short-term downside.
Specifically:
Gold is showing a converging pattern on the 1-hour chart, with moving averages clearly intertwined and failing to establish a strong directional trend. Gold is currently facing resistance around the 4000 level and has not yet broken through to the upside.
If gold breaks through and holds above 4000 again, then during the US session, pay attention to the resistance level in the 4020-4030 area. Overall, gold is still trending upwards in a volatile manner.
Market conditions are constantly changing. Pay attention to the current range-bound market rhythm. Without a clear directional trend in the short term, avoid chasing the market.
Trading strategy:
Buy:3950-3950, SL: 3960, TP: 3980-4000-4020

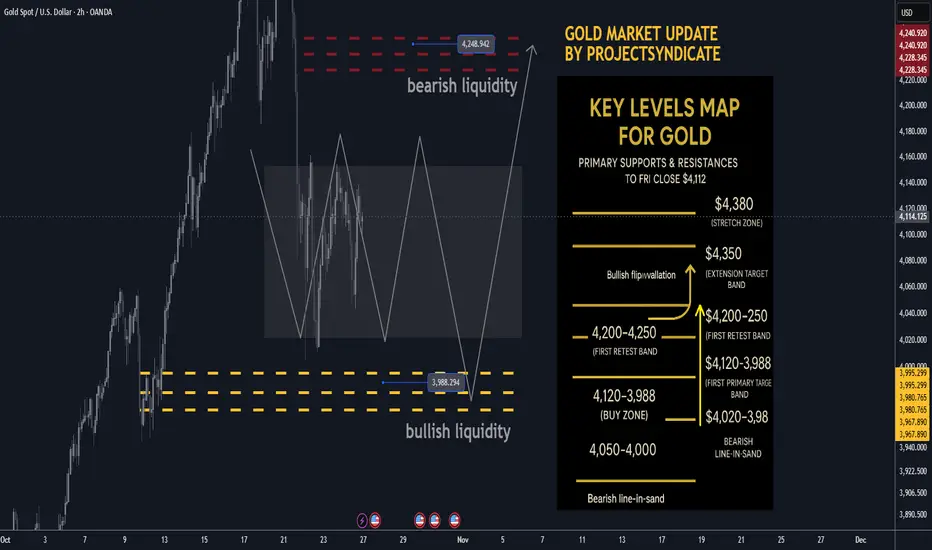
Gold next week Key S/R Levels and Outlook for Traders🔥 GOLD WEEKLY SNAPSHOT — BY PROJECTSYNDICATE
🏆 High/Close: $4,380 → ~$4,112 — lower close within range; momentum cooled but holding the $4,000 handle.
📈 Trend: Uptrend intact > $4,000; oversold into $4.1k—setup favors reflex bounce.
🛡 Supports: $4,120–$4,080 → $4,020–$3,988 (bullish liquidity) → $4,000/3,980 must hold.
🚧 Resistances: $4,200 / $4,250 (bearish liquidity) / $4,300 → stretch $4,350–$4,380.
🧭 Bias next week: Buy-the-dip $4,020–$3,988; momentum regain above $4,200 targets $4,250 → $4,300–$4,350. Invalidation < $3,980 risks a deeper flush to $3,950.
🌍 Macro tailwinds:
• Policy: Easing real yields supportive on dips.
• FX: Softer USD tone = constructive backdrop.
• Flows: Central-bank buying + tactical ETF interest underpin $4k.
• Geopolitics: Trade/tariff & regional tensions keep safety bids alive.
🎯 Street view: Select houses still float $5,000/oz by 2026 on policy easing & reserve-diversification narratives.
________________________________________
🔝 Key Resistance Zones
• $4,200–$4,230 immediate supply from the weekly close
• $4,250 bearish liquidity / primary target
• $4,300–$4,350 extension band
• $4,380 prior spike high / stretch
🛡 Support Zones
• $4,120–$4,080 first retest band below close
• $4,020–$3,988 buy zone (bullish liquidity)
• $4,000 / $3,980 must-hold shelf
________________________________________
⚖️ Base Case Scenario
Expect pullbacks into $4,120–$4,080 and $4,020–$3,988 to attract buyers, rotating price back toward $4,200 then $4,250. Acceptance above $4,250 invites a drive into $4,300–$4,350.
🚀 Breakout Trigger
A sustained push/acceptance > ~$4,250 unlocks $4,300 → $4,350, with room toward $4,380 if momentum persists.
💡 Market Drivers
• Real-yield drift lower (supportive carry backdrop)
• USD softness aiding metals
• Ongoing CB accumulation; ETF flows stabilizing on dips
• Headline risk (trade/geopolitics) sustaining safe-haven demand
🔓 Bull / Bear Trigger Lines
• Bullish above: $4,020–$4,100 (buyers defend pullbacks)
• Bearish below: $3,980 (risk expands; threatens $3,950)
🧭 Strategy
Buy low from bullish liquidity (~$3,988) with a target at $4,250; oversold conditions favor a strong bounce. Add on strength above $4,200 toward $4,300–$4,350. Keep risk tight below $3,980–$4,000 to invalidate.
XAUUSD Crashes 1500 Pips — Key Supports Gone!Gold started the week poorly, dropping around 1500 pips and, more importantly, breaking three key support levels:
• the rising trendline that started back in August,
• the 4020 horizontal support zone,
• and even the psychological 4000 level.
Overnight, the price attempted to reclaim 4000, but failed — currently trading around 3965.
The next immediate support sits at 3945, and even if we see a rebound from here, bulls will need to hold the price firmly above 4000 to have any chance of a reversal.
If this level also fails, the next obvious medium-term target is the 3720–3750 zone.
I m bearish for now, but there isn’t a clean or logical entry point at the current levels — I will wait until a clearer setup forms.

GOLD → Price stuck in range after Fed speech FX:XAUUSD continues to battle for the $4,000 zone. The fundamental backdrop has a hint of unpredictability following the Fed's statement. Technically, the range of 3,915-4,015 is developing
Key factors: US shutdown (4th week): Weighs on the economy and the dollar, supporting gold as a safe haven. However, the Fed toughened its tone yesterday: It cut rates by 25 basis points, but Powell ruled out guarantees for a cut in December. Trump and Xi meeting: Agreements reached on soybeans and rare earths, reducing demand for defensive assets.
Gold balances between shutdown risks and monetary policy tightening. Growth is only possible if macro statistics deteriorate or geopolitics escalate.
Resistance levels: 4015 - 4050
Support levels: 3980 - 3960 - 3915
Gold may continue its correction from the 4015 - 4050 zone to 3950 - 3900 if the bulls are unable to keep the price within the upper range. However, if the market continues to buy the metal (there are no fundamental reasons for this yet) and the price closes above 4015, there may be a chance for growth to 4050 - 4085.
Best regards, R. Linda!

If You're Not Just Hearing About Options —But Actually Diving InYou’ve moved beyond indicators and noise.
You’re stepping into the world where smart money operates.
Because options are not just tools for betting.
They’re a mirror of institutional intent — of hedges, positioning, and hidden signals.
And if you learn to listen to this market, you gain a real edge — even if you never trade an option yourself.
You’ll see what’s coming on spot Forex, gold, or indices — before the crowd notices anything.
This isn’t theory from a textbook.
It’s a practical guide forged from over 5 years of daily analysis of CME reports, exchange data, and real-world observation.
Let’s break it down — step by step.
🔍 Step 1: Can You Identify the Player by Option Delta?
Yes — and it starts with understanding delta.
Delta = Sensitivity of an option’s price to changes in the underlying asset.
0.05–0.10 (5–10%) → Deep out-of-the-money (far OTM)
0.15–0.30 (15–30%) → Moderately OTM
~0.50 (50%) → At-the-money (ATM)
>0.50 → In-the-money (ITM)
Now — who trades what, and why?
0.05–0.10 ->Tail-risk hedgers, "lottery" traders
Protection against black swans or cheap speculative bets
0.10–0.20 ->Aggressive speculators, potential insiders
Betting on explosive moves — possibly with inside conviction
0.20–0.35 -> Regular speculators, funds
Expecting moderate rallies — balanced risk/reward
0.40–0.60 - >
Institutions, hedge funds
Portfolio hedging, delta-neutral strategies
>0.60
Arbitrageurs, hedgers
Deep ITM options as synthetic positions
⚠️ Important Nuance:
Delta is not absolute.
Large players may use deep OTM options — but not for speculation.
These could be tail-risk hedges (e.g., protection against crash scenarios).
🔮 Predictive Power Isn’t Just About the Trade — It’s About the Timing
The forecast value of an individual option increases dramatically when you ask:
When did this position appear — relative to price action?
✅ Before a move? → High predictive power
❌ After a big rally? → Likely FOMO or profit-taking
✅ On a pullback? → Could signal support/resistance
IMPORTANT! Timing turns noise into signal.
📌 To be continued in the next update…

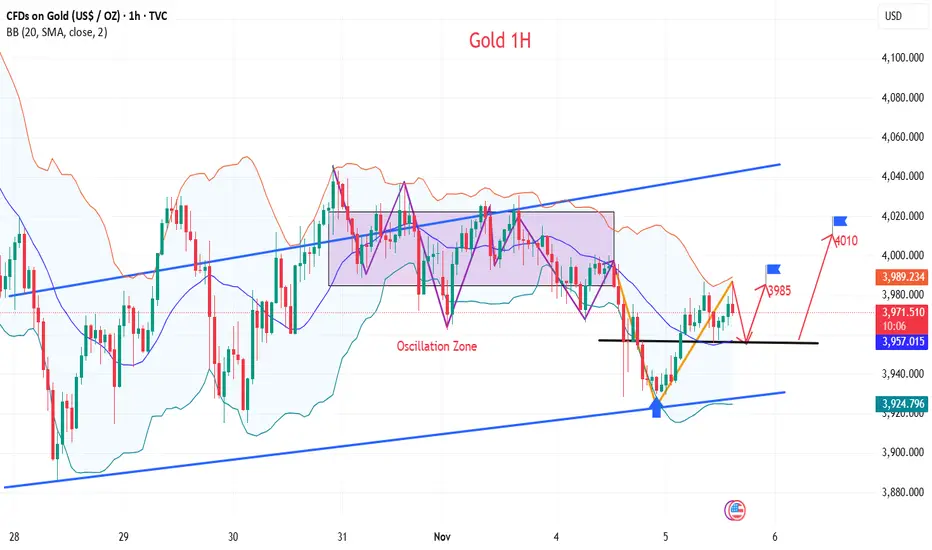
XAUUSD $4025 RESISTANCE NEXT?This chart displays the price action of **Gold Spot / U.S. Dollar (XAU/USD)** on an **Hourly (1h)** timeframe.
## 📈 Technical Analysis: XAU/USD
The price has been in a **consolidative or choppy phase** following a significant prior downtrend, primarily trading within a larger range defined by a **Support zone** around the **\$3,918 - \$3,925** area and a **Resistance zone** near **\$4,020 - \$4,030**.
Within this range, price action appears to have formed a **Descending Channel** (indicated by the dashed lines), suggesting a short-term bearish bias or continued correction within the broader consolidation. However, more recently, the price has broken out of the upper boundary of this descending channel.
Following the channel breakout, the price has entered a **tight, upward-sloping consolidation**, possibly forming a small **bullish flag or pennant pattern** (indicated by the solid, inner trendlines). The current candle is breaking above the upper trendline of this smaller pattern, suggesting a potential continuation move to the upside.
---
## 🎯 Price Projection
Given the breakout from both the descending channel and the smaller bullish consolidation pattern, the immediate projection is **bullish**. The target for this move is the test of the main **Resistance zone** established at **\$4,020 - \$4,030**.
* **Potential Target:** The analysis highlights a specific target around **\$4,040.5**, which represents a **1.17%** move from a breakout point and aligns with the upper boundary of the key resistance zone.
* **Validation:** Continued strength and sustained trading above the breakout level (around **\$3,980**) would reinforce this bullish projection.
* **Invalidation:** A decisive move back below the current consolidation area and the upper line of the descending channel (roughly below **\$3,960 - \$3,970**) would invalidate the immediate bullish bias and suggest a return to the broader ranging behavior or a retest of the support zone.
The overall context remains range-bound, meaning a successful test of the $\mathbf{\$4,020}$ $\mathbf{-}$ $\mathbf{\$4,030}$ **Resistance** could lead to another move back down unless there is a strong, sustained breakout above it.
Would you like me to search for fundamental news that might be impacting the price of Gold right now?

GOLD A Fall Expected! SELL!
My dear subscribers,
GOLD looks like it will make a good move, and here are the details:
The market is trading on 3995.7 pivot level.
Bias - Bearish
My Stop Loss - 4003.2
Technical Indicators: Both Super Trend & Pivot HL indicate a highly probable Bearish continuation.
Target - 3983.4
About Used Indicators:
The average true range (ATR) plays an important role in 'Supertrend' as the indicator uses ATR to calculate its value. The ATR indicator signals the degree of price volatility.
Disclosure: I am part of Trade Nation's Influencer program and receive a monthly fee for using their TradingView charts in my analysis.
———————————
WISH YOU ALL LUCK

GOLD: Bearish Continuation & Short Signal
GOLD
- Classic bearish pattern
- Our team expects retracement
SUGGESTED TRADE:
Swing Trade
Sell GOLD
Entry - 4001.7
Stop - 4011.35
Take - 3985.2
Our Risk - 1%
Start protection of your profits from lower levels
Disclosure: I am part of Trade Nation's Influencer program and receive a monthly fee for using their TradingView charts in my analysis.
❤️ Please, support our work with like & comment! ❤️

Gold Remains Range-Bound — Focus on Selling ReboundsAs time passes, the 4-hour moving average resistance continues to shift lower, with the key resistance area now around 4004/4030. From the current candlestick structure, bearish momentum still dominates. On the daily chart, the MA30 serves as the crucial pivot level, while MA20 can be used to gauge broader trend direction. In other words, only a firm hold above the MA30 would give bulls a chance to compete, and a full trend reversal would require a confirmed breakout above the MA20.
Key short-term support remains at 3948-3921, followed by the previous low near 3885. If these levels fail to hold, attention should shift to the 3800 psychological level and support from the daily MA60.
On the news front, geopolitical tensions continue to escalate, which has provided some safe-haven demand for gold. However, given the strong rally over the past two months, gold’s traditional safe-haven appeal has weakened, and volatility has increased, giving it characteristics closer to a risk asset at times. Therefore, geopolitical factors should be referenced cautiously, with primary focus remaining on core price structure and trading logic.
Meanwhile, uncertainty around whether there will be a rate cut in December also contributes to the current consolidation. Until there is clear direction, trading should remain cautious—focus on opportunities you clearly understand and avoid greed. When the market structure becomes unclear, stay patient and reduce unnecessary trades to manage risk.

GOLD (XAUUSD): Support & Resistance Analysis for Next Week
Here is my structure analysis for Gold for next week.
Support 1: 3868 - 3927 area
Support 2: 3766 - 3830 area
Support 3: 3690 - 3736 area
Resistance 1: 4023 - 4109 area
Resistance 2: 4187 - 4245 area
Resistance 3: 4357 - 4383 area
Consider these structures for pullback/breakout trading.
❤️Please, support my work with like, thank you!❤️
I am part of Trade Nation's Influencer program and receive a monthly fee for using their TradingView charts in my analysis.
