Trade ideas

If gold pulls back,it is an opportunity to enter a long positionGold saw a significant rise after opening this week, with an increase of more than $100. The main driving factors are as follows: Trump announced a 100% tariff increase on exports from several Asian countries and planned to implement new software export control measures. Meanwhile, the U.S. federal government shutdown has entered its third week, and Congress has yet to reach an agreement on budget appropriations, leaving thousands of federal employees facing unpaid wages. The above situation has exacerbated market concerns about economic slowdown and significantly increased investors' demand for safe-haven assets. In terms of geopolitics, Trump said he might provide Ukraine with long-range Tomahawk missiles to enhance strategic deterrence against Russia, which once again escalated regional tensions. These multiple factors have combined to form the core support for this round of gold price increases. Against this backdrop, gold has strong upward momentum, and there is ample reason to maintain a bullish stance.
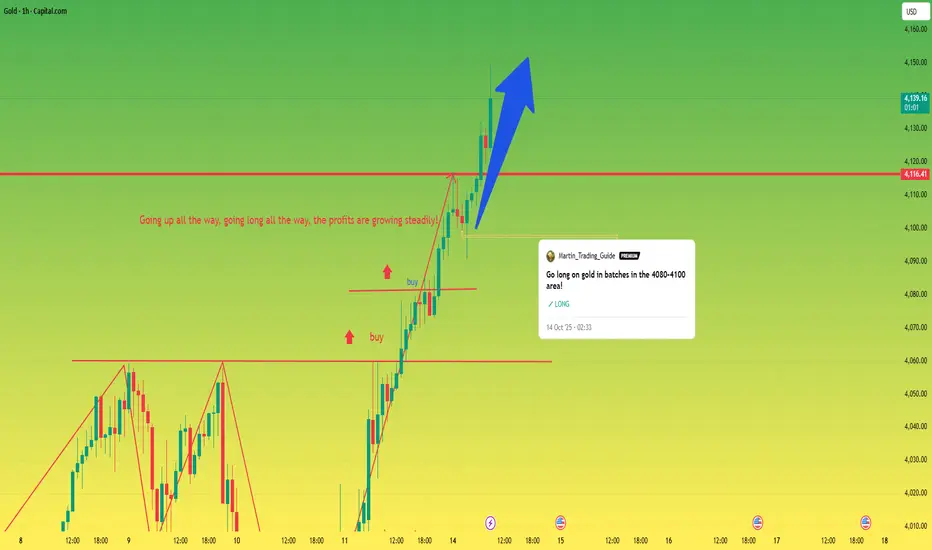
The recent view is clear: buying on dips is the appropriate strategy at this time. The long positions established in the 3950 to 3970 range last Friday have not been closed so far, and the market continues to strengthen; after the opening of this week, a new round of long order recommendations were issued in the 4090 to 4100 range. The overall operation is highly consistent with the market trend. This series of decisions is based on clear and consistent trading logic, reflecting an accurate grasp of trend direction. For investors who haven't yet established a position, we recommend placing long positions in batches between 4095 and 4115. Importantly, given the rapid market fluctuations, trading strategies are time-sensitive. It should be noted that the market fluctuates rapidly and trading strategies are time-sensitive. If there are major changes in the subsequent market conditions, they will be adjusted and notified in a timely manner based on the latest market dynamics.
The above content is personal investment analysis and is for reference only. Welcome to continue to pay attention, gold trading strategies will continue to be updated, I'm waiting for you in the channel.
Backtest Market Structure #1Backtest Market Structure #1 (9 month)
Trading Code: XAUUSD
Timeframe: 1H
ENTRY BUY
Trend: Forming a Higher High (BoS or ChoCh)
Trade Quality: Price retraces to the Discount zone (≥ 50%)
Trigger: Bullish confirmation candle closes above EMA200
Filter:
☐ The confirmation candle does not break the previous high — if it does, wait for the next wave.
☐ Try to catch the bottom a maximum of 2 times — if both fail (2 stop losses), wait for the next wave.
ENTRY SELL
Trend: Forming a Lower Low (BoS or ChoCh)
Trade Quality: Price retraces to the Premium zone (≥ 50%)
Trigger: Bearish confirmation candle closes below EMA200
Filter:
☐ The confirmation candle does not break the previous low — if it does, wait for the next wave.
☐ Try to catch the top a maximum of 2 times — if both fail (2 stop losses), wait for the next wave.
Stop Loss: Below the low or above the high (+/- SPREAD)
Take Profit: 1.5 : 1
Capital: 10,000 USD cent
Risk: 2% per trade = 200 USD
Order Type: Market
Maximum Drawdown (MDD): 10% per week

Gold trading plan!BUYS:
1) Retest the 1h Bullish FVG at the 4157.33 level.
2) Create a 3/5m Bullish CHOCH with a body candle close (with a FVG).
3) Retest the 3/5m Bullish CHOCH level to capitalize on BUYS towards the 4200.00 level.
SELLS:
1) Body candle close below the 4134.60 level.
2) Retest the 1h bearish CHOCH at the 4134.60 level.
3) Create a 3/5m Bearish Engulfing Candle to capitalise on SELLS toward the 4090.70 level.

XAU - USD / Wait until take de Pullback in Demand ZoneLet's see this trade until take the first pullback and just check your entry to Sell.

XAUUSD SUPERWAVE: Gold Battles at $4,200 🎯 Macro Summary & Bias: Historical Highs and the Pause of the Bulls
Gold is the center of attention as it fights fiercely at the $4,200 level during the European session.
Strength Drivers: Gold recently hit a fresh all-time high near $4,220. This record rally is sustained by ongoing geopolitical tensions, economic risks, a dovish Federal Reserve (Fed), and a weak USD.
Current Pressure: Bullish speculators are taking a breather, creating pressure on the price at the $4,200 mark.
Economic Signal: Although the IMF raised its 2025 global growth forecast, it simultaneously warned that a rekindled US-China trade war could significantly slow output—a factor that continues to support Gold as a safe-haven asset.
📊 Technical Analysis (M30/H1): Defining the Fibo BUY/SELL Battlefield
Based on the Ascending Channel structure and the identification of Fibo Reaction Zones (Referencing image_49085d.png), we have the following key strategic trading areas for today:
1. Strategic SELL Reaction Zones:
These are crucial Fibo resistance zones where we will look for SELL SCALP signals if buying momentum falters:
Zone Price Range Description & Action
SELL ZONE 1 (FIBO) 4208 - 4212 Key Fibo resistance zone. A potential area to consider a SELL SCALP if bearish confirmation emerges.
SELL ZONE 2 (Extension) 4225 - 4250 The FIBO Extension 1.5 - 1.618 zone. This is the TP target for Longs and a stronger strategic SELL zone if Gold breaks above 4212.
2. Strategic BUY Reaction Zones:
These are vital Fibo support zones where we will look for Long entries (BUY) following the primary trend:
Zone Price Range Description & Action
BUY ZONE 1 (FIBO Retest) 4162 - 4158 The crucial Fibo 0.618 support zone. Ideal area to catch the BUY wave if price corrects here.
BUY ZONE 2 (Deeper Support) 4144 - 4140 A deeper, stronger support area. If BUY ZONE 1 fails, this is the next key accumulation point.
📈 TODAY'S OPTIMAL ACTION PLAN
Primary BUY Scenario: Wait for Gold to correct to the REACTION FIBO BUY ZONE 4162 - 4158. Upon seeing a strong bullish reversal candle signal (H1/M30), confidently enter a Long trade.
TP: Target SELL ZONE 1 (4208 - 4212) or SELL ZONE 2 (4225 - 4250).
Scalp SELL Scenario: If Gold fails to breach 4200/4212 and shows clear reversal signs, a quick SCALP SELL can be considered.
⚠️ Risk Warning (SL): Always place a safe Stop Loss (SL) below the nearest active BUY ZONE to protect your capital.
Wishing all FranCi$$_FiboMatrix traders a disciplined and highly profitable day!

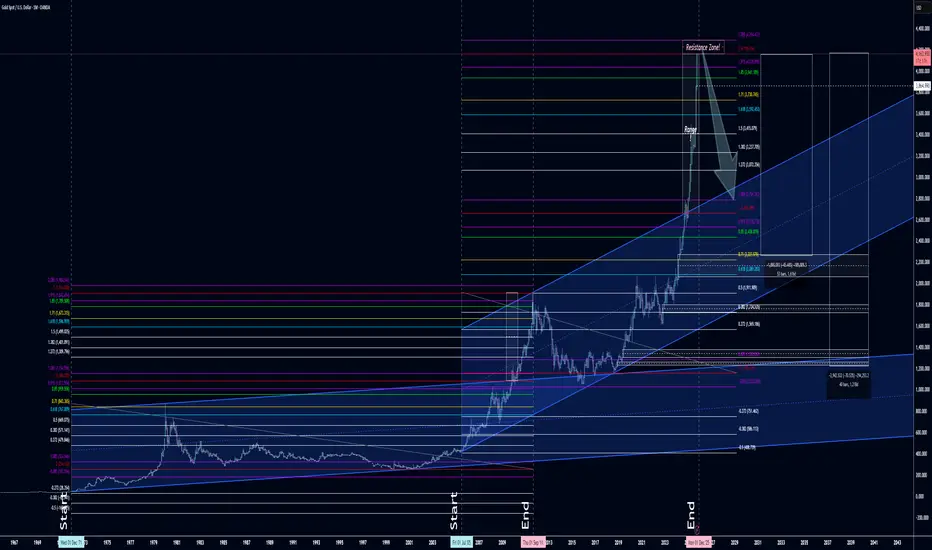
Gold Reached Its Final Peak? A 50-Year Cycle May End Here!🟡 Gold Macro Structure — The End of a 50-Year Bullish Epoch
Symbol: XAU/USD (OANDA Data)
Timeframe: 1M (Monthly Candles)
Published by: Ping Tech Academy
🕰️ The Story of Gold — Faith, Fear, and Cycles
Gold has always been more than a commodity — it’s the mirror of human belief.
When trust in paper fades, gold rises. When euphoria returns, gold retreats.
Since the U.S. dollar detached from gold in December 1971, every major swing has reflected the balance between fear and faith.
Today, after more than five decades, gold may be reaching the final chapter of its generational bull cycle.
🔹 Historical Structure (1971–2009)
From December 1st, 1971, gold has moved within a long-term ascending price channel,
anchored between $43.50 (bottom) and $1,195.40 (top).
That upper boundary was broken and retested on November 2nd, 2009,
marking the transition into a new bullish macro channel — the one that has guided us for the past 16 years.
🔹 The Second Channel (2005–2024)
The base of this channel formed on July 1st, 2005, at $417.90,
while its upper boundary expanded to around $2,663.50, reached on September 2nd, 2024.
This level was broken and retested — a classical continuation signal —
and from there, gold surged into the $4,165 region (October 2025).
⚠️ Critical Zone: The Completion of the Macro Channel
According to price behavior symmetry and channel geometry,
gold has now fulfilled the structural target of its multi-decade bullish channel:
📍 $4,166.66 (OANDA XAU/USD)
Accounting for margin of deviation, the potential final resistance zone is estimated between:
📉 $4,166.66 – $4,294.43
This area is expected to represent the macro peak of this cycle,
after which a multi-year corrective phase could begin.
🧭 Projected Downside Path (Long-Term Correction Targets)
If price confirms rejection within this resistance cluster,
these levels are projected as sequential macro targets:
$3,940
$3,730
$3,415
$3,072
$2,791 → Key Structural Level
Breaking below $2,791 could unlock the next leg toward:
• $2,438
• $2,227
• $2,089 → Final Macro Target
🧠 Market Psychology & Cyclic Behavior
Every gold supercycle follows a rhythm of human emotion and institutional logic:
Accumulation (Smart Money Phase):
Institutions buy quietly when the world stops caring — at undervalued extremes.
Expansion & Public Awareness:
The trend becomes “obvious,” and narratives such as inflation, rate cuts, or war become convenient justifications.
Euphoria (Public Participation):
Retail capital floods in at all-time highs. Media coverage peaks.
Institutions distribute into optimism, slowly unloading into retail demand.
Distribution → Correction:
Price action weakens, volatility expands, and the illusion of “new paradigms” fades.
Fear replaces greed — and the cycle resets.
Gold is currently showing late-euphoria behavior on the monthly timeframe —
the classic footprint of a distribution phase in motion.
🧩 Conclusion
Gold may be closing the final leg of a 50-year macro expansion,
completing a structure that began in 1971 — an era that redefined global value systems.
While an overshoot beyond $4,294 remains possible,
the reward-to-risk profile now shifts decisively toward defensive positioning.
This could mark the beginning of a generational correction before a new cycle of accumulation emerges.
⚖️ Disclaimer
This analysis is for educational and informational purposes only and does not constitute financial advice.
All projections are derived from long-term historical modeling and price structure analysis.
Financial markets carry risk; always perform your own research or consult a licensed advisor before making investment decisions.
📘 Ping Tech Academy
“Trade Smart. Trade Fearless.”
© 2025 – All Rights Reserved.
October 9 Gold AnalysisOctober 9 Gold Analysis
Looking back at this week's performance, gold, driven by rising expectations of rate cuts and geopolitical risks, has performed exceptionally strongly, breaking through the $3,900 and $4,000 levels in succession and reaching new all-time highs. Despite a sharp drop in Thursday's Asian session due to the sudden news of a ceasefire agreement, gold prices quickly found strong support at the key psychological level of $4,000 and rebounded, having largely recovered the lost ground. This clearly demonstrates that the core driving forces of the current market remain unchanged, with strong buying appetite on dips and the overall upward trend remaining intact.
Analysis of Core Drivers
1. Expectations of Federal Reserve rate cuts: This is the fundamental driving force behind this surge in gold prices. Market expectations of further Fed rate cuts in October and December continue to build, reducing the opportunity cost of holding non-interest-bearing gold and providing a solid underlying support for gold prices.
2. Spreading risk aversion: The US government shutdown entered its second week, with bipartisan negotiations repeatedly breaking down, and market concerns about a prolonged shutdown intensified. This political risk has triggered widespread panic, driving continued safe-haven flows into the gold market.
3. Strong Technical Breakout: After breaking through $4,000, gold prices have confirmed entering a new price range. Although technical indicators suggest short-term overbought conditions and correction potential, the moving averages are bullish, and the upward trend remains solid.
Trading Strategy
Downward Support:
Primary support: $4,022 (the intraday low of the European session). A breakout here would indicate that market sentiment remains positive.
Core Support: $4,000. This is a key level that has been tested and successfully stabilized multiple times in the past two days and is the lifeline for determining the continuation of this upward trend. As long as gold prices hold above this level, the overall bullish outlook remains unchanged.
Upward Resistance:
Near-term resistance: $4,045 (the morning opening price and the rebound high in the Asian and European sessions). A breakout here would confirm the end of the short-term correction and reassert buying momentum.
Key Resistance: $4,060 (near the all-time high). A successful breakout above this level will open up further upside potential, with the next target likely reaching $4,100.
Trading Recommendations:
We recommend a volatile bullish outlook. Focus on stabilizing signals near the support area.
I've shared strategies earlier on my channel. Profitable traders can continue to increase their positions at lower levels, targeting 4,060-4,100.
Trade with caution and manage risk! Best of luck!

Gold Holds 3,900 Support Amid Dollar Slowdown and Global TensionHey Traders, in today’s session we’re closely monitoring XAUUSD for a potential buying opportunity around the 3,900 zone. Gold continues to trade within a strong uptrend, and the current pullback appears to be a healthy correction approaching key trend support.
Structure: The broader trend remains bullish, with price consolidating after its recent highs. The 3,900 level stands out as a technical pivot where buyers could regain control.
Macro context: The US Dollar Index is approaching major daily resistance around 98.300, suggesting potential exhaustion in the current USD rebound. Meanwhile, political and fiscal developments in Japan where a notably dovish administration has just taken power could further support demand for safe-haven assets like Gold.
Market sentiment: A combination of fiscal expansion abroad and rising uncertainty surrounding the ongoing US government shutdown is fueling risk aversion. If these pressures persist, Gold could retest the 4,000 zone sooner than expected.
Key focus: Watching how price reacts around 3,900 for potential bullish continuation in line with the broader trend.
Trade safe,
Joe.

Gold surged and then retreated. Latest Analysis.On Wednesday, gold continued its recent record-breaking run, finding buying support for the fourth consecutive trading day. Against a backdrop of favorable fundamentals, gold prices hit a new all-time high of $4,218.19.
Persistent geopolitical tensions, escalating trade frictions, and market concerns about a prolonged US government shutdown have all contributed to the key factors supporting this surge in safe-haven assets. It is important to note that despite technical indicators indicating overbought conditions, gold bullish momentum has not weakened, suggesting that the path of least resistance remains upward and the recently established upward trend is likely to continue.
In early Asian trading, gold bulls stabilized in the 4,140 area and re-energized, breaking through the record high of $4,200. Until there is a clear signal of a peak, do not blindly guess the top location. In the short term, a buy-on-low approach is recommended, with key support focused on the intraday low and the short-term uptrend support from 4,090.
The first resistance level to watch is around 4210-4215, followed by 4240. Support is expected to be around 4180-4160. For gold, a short-term strategy is to buy on pullbacks.
Trading strategy:
Buy gold in batches on pullbacks between 4180-4160, with a stop-loss of $10. Profits are expected to be above 4200.

When Charts Collide with Reality: Powell’s Speech and the Real-Once upon a time, a certain trader glued to chart patterns – head buried in Bollinger Bands, RSI blips, and Fibonacci retracements – decided to ignore “fundamentals” altogether. On October 9, 2025, that hero learned a hard lesson. Fed Chair Jerome Powell’s “welcoming remarks” at a community banks conference proved anything but earth-shattering – he avoided all mention of interest rates or the economy. The markets’ reaction was accordingly muted but telling: U.S. indices drifted lower (S&P 500 –0.3%, Nasdaq –0.1%, Dow Jones –0.5%), while Bitcoin and commodities moved on cues from deeper currents. The moral? No chart of a winding stochastic oscillator can capture a government shutdown, a Fed minutes report, or – as traders soon learned on October 10 – a sudden tariff shock.
Oct 9, 2025: Powell’s Murmurs, Markets’ Moves
By 8:30 am EDT on Oct 9, Chair Powell had spoken – and delivered nothing dramatic. He stressed the importance of community banks and scotch-filtered praise for Fed policy, but did not explicitly mention interest rates. In market terms, this was Fed-speak for “status quo until further notice.” Risky assets mostly shrugged. The S&P 500 and Nasdaq, fresh off record highs the day before, inched down a hair (–0.3% and –0.1% respectively).
In equities, the tech-and-AI rally simply paused, not reversed. Nvidia (NVDA) actually hit a new intraday high, closing up +1.8%. Tesla (TSLA) only slipped ~0.7% (to about $405 from ~$408). Momentum traders briefly panicked before shrugging. Meanwhile, currencies and commodities did most of the heavy lifting. Gold fell back ~2%, relinquishing its perch above $4,000 to around $3,990. Oil cooled too, with WTI crude dropping about 1.7% to $61.50/bbl as global demand jitters outweighed tariff threats. Bonds yawned (10-year yields only ticked up to ~4.14%).
Cryptocurrencies provided the day’s juiciest contrast to technical charts. Bitcoin quietly fell ~2%, settling near $121,000. Ethereum, which had flirted with $4,555 intraday, ended up around $4,350. In short: a benign Fed talk and some global calm gave traders little excuse to keep piling on risk. The chart-gobbling skeptic would note: despite all the pattern-bashing and bullish RSI, it was real-world news (fiscal brinksmanship, global politics) that dictated gold’s drop and Bitcoin’s small selloff – not any “sell” signal on a moving-average ribbon.
Oct 10, 2025: Tariff Turbulence Hits the Wires
Then came the next day – October 10. The U.S. Trade Representative’s office announced a surprise tariff escalation on select Chinese electric vehicle components and semiconductor materials, effective immediately. The move rattled supply chain darlings and sent a tremor through risk markets.
By midday, Nvidia dropped 3.6%, Tesla tumbled 4.1%, and AMD shed 2.9%. The S&P 500 sank 1.1%, and the Nasdaq fell nearly 1.8% as traders digested implications for the AI and EV sectors. Bitcoin dipped to $118,500 (–2%) and Ethereum slid below $4,200. Gold, the perennial crisis comforter, jumped 1.5% back above $4,040, while oil reversed earlier losses to climb 2.2% to $62.90/bbl. In one trading day, tariff headlines flipped market sentiment from calm to chaos – and all without a single moving average crossover to foretell it.
The episode underlined what the October 9 non-event hinted at: markets are narratives in motion, not lines on a screen. Macro policies, geopolitical decisions, and institutional utterances move them in ways pure chart logic never predicts.
Institutions at Work: IMF, World Bank, ECB, SEC, and Friends
The Fed is just one club in the financial orchestra. A savvy trader must know the other conductors. In the halls of power – from Washington to Brussels – policy events routinely send ripples through markets. Recall: at the IMF/World Bank annual meetings this past week, IMF head Kristalina Georgieva warned of “exceptional uncertainty” and noted “demand for gold … is surging.” Indeed, gold briefly touched $4,030 on Oct 8, and Bitcoin ticked upward. That rally was not from any RSI oscillator; it was born from safe-haven buying amid a government shutdown and looming Fed cuts.
Europe’s sage is the ECB. Remember Oct 17, 2024? The ECB cut rates 25 bp on “disinflationary progress.” The euro promptly slid and gold jumped – not due to any chart signal, but because traders priced in easier money. In general, ECB policy shifts move FX and commodities: a dovish ECB tends to weaken the euro and buoy gold, boosting global stocks.
Crypto regulation is heavily influenced by G20/FSB/IOSCO. For instance, the G20 asked for international stablecoin standards in 2020; by July 2023, the FSB issued a “global regulatory framework for crypto,” essentially a roadmap for uniform oversight. IOSCO drills into crypto and market structure; its pronouncements can nudge crypto markets. In sum, when these bodies speak, smart traders listen – because “regulation approved” often means “uncertainty down, risk assets up.”
Meanwhile, in the United States, the SEC is the heavyweight. A single SEC rule change can swing billions. On Sep 17, 2025, the SEC voted to open the floodgates for spot crypto ETFs, spurring a bid under crypto prices. Compare that to October 2023, when SEC staff signaled resistance – markets instantly sagged. The SEC’s filings and enforcement releases are trading triggers: when the SEC sued Binance or Coinbase in mid-2023, Bitcoin and altcoins wobbled. When SEC Chair Paul Atkins touted innovation on crypto ETFs, crypto ticked up.
History’s Highlights: Past Shock Events
Our chart-obsessed trader could use a refresher. Real events repeatedly overwhelm technicals. On August 12, 2025, U.S. CPI inflation came in cooler than expected (2.7% YoY vs 2.8% forecast). Ethereum broke above $4,400 from $4,172 intraday, BTC and total crypto cap surged ~1–2%. Stocks rallied too, betting on Fed rate cuts.
Flip the script: in July 26, 2023, the Fed raised rates 25 bp. Stocks and crypto swooned. Meta slid 5% and Bitcoin briefly lost 5% of its value. No candle-stick pattern predicted that.
Other events: Nonfarm Payrolls, FOMC meetings, CPI releases, central bank press conferences. January 2022’s strong jobs report sent gold down and Nvidia down; February 2023’s soft CPI boosted tech and crypto. European examples: Sep 2022, ECB minutes hawkish + geopolitical tension → oil shot up. Banks and institutions also matter: Jamie Dimon’s Sept 2025 warning of a “30% chance of a market drop” briefly wobbled financial stocks.
Commodities Follow Real-World News
US strategic reserve announcements or OPEC meetings can tip oil charts. Gold’s all-time highs this year came from safe-haven flows around shutdowns and trade wars. Historic data show that calendar events and policy shifts matter. They have instant effects on Bitcoin, Ethereum, Nvidia, Tesla, gold, oil, and indices – far beyond any moving average.
Looking Ahead: Upcoming Economic Events
IMF/World Bank Annual Meetings (Oct 13–18, 2025): Growth warnings + debt talks. Gold $3,950–$4,000, BTC $120k–$122k. Historical precedent: dovish updates → stocks down, safe havens up.
ECB Monetary Policy (Dec 2025): Rate path decisions. Potential rate cut → EUR weakness & gold rally.
G20 Leaders Summit (Nov 22–23, 2025): Trade, debt, climate. Communiqué tone → possible volatility.
IOSCO/FSB Meetings (late 2025): Crypto regulation, cross-border payments. Tighter guidance → crypto jittery; benign → stable.
U.S. SEC and CFTC: Ongoing regulatory tweaks. Crypto ETFs, corporate disclosure rules → sector swings.
Economic Data: Delayed data from shutdown → CPI, PPI, retail sales, jobs figures. Each historically jolts markets.
Conclusion
By Oct 10, our chart-chaser had been fully humbled. Markets reacted to a broader story: sticky inflation, global politics, tariffs, and institutional pronouncements. Bitcoin ~$118,500, Ethereum ~$4,200, Nvidia –3.6%, Tesla –4.1%, Gold +1.5%. Real-world headlines trumped chart signals once again. Savvy traders know: the Fed minutes, IMF forecasts, and central-bank calendars are the real compass – technicals are just background noise. Markets move to the melody of policy statements; ignoring them risks dancing off-beat.
---
Key Market Events, Price Reactions & Timetables
Date / Event Institution / Trigger Main Theme Assets Affected Approx. Price / Move Market Reaction Timing Notes / Implications
Oct 8 2025 IMF / World Bank pre-meetings Gold surge on safe-haven demand Gold ↑ $4,030 (+2%), BTC ~$123,000 (+1%) 4–6 hrs around IMF headlines IMF’s Georgieva warned of fragility, sparking record gold demand
Oct 9 2025 Fed Chair Powell – Community Banks Speech No rate comment → 'non-event' S&P 500 –0.3%, Nasdaq –0.1%, BTC ↓ ~2% to $121k, Gold ↓ ~2% to $3,990, Oil ↓ 1.7% to $61.5 Within 1–3 hrs post speech Market drifted; risk appetite cooled without new policy cues
Oct 9 2025 (same day) Gaza ceasefire news Geopolitical de-risking Gold –2% to ~$3,990, Oil –1.7% to $61.5 Immediate (minutes – 1 hr) Safe-haven unwinding; traders rotated to risk assets
Oct 10 2025 USTR Tariff Announcement Trade escalation shock Nvidia –3.6%, Tesla –4.1%, BTC –2% to $118.5k, ETH –3% to $4,200, Gold +1.5% to $4,040, Oil +2.2% to $62.9 Within 1–2 hrs Risk-off reaction, supply chain fears, safe-haven inflows
Oct 12–18 2025 IMF & World Bank Annual Meetings Growth warnings + debt talks Gold $3,950–$4,000, BTC $120k–$122k Multi-day gradual move IMF’s 'fragile but resilient' tone supported gold; crypto stabilized
Oct 17 2024 (reference) ECB rate cut (–25 bp) Monetary easing EUR/USD ↓ 0.5%, Gold ↑ ~1.3% 2–4 hrs post meeting Dovish ECB = Euro weakened, commodities lifted
Sep 17 2025 U.S. SEC approves spot crypto ETFs Regulatory breakthrough BTC ↑ ~6% to $118k, ETH ↑ ~7% to $4,400 1–2 hrs after SEC vote 'Watershed moment' — institutional inflows expected
Aug 12 2025 (reference) U.S. CPI data (2.7% vs 2.8%) Inflation cooler than expected BTC ↑ ~2%, ETH ↑ ~3% to $4,400, S&P 500 ↑ 1% Immediate (minutes) Macro data beat → risk assets jump → Fed cut bets increase
Jul 2023 reference Fed rate hike + FSB crypto report Hawkish policy / crypto regulation BTC –5%, Tech –3–4% Same day Macro tightening + new rules = risk-off sentiment
Nov 22–23 2025 (Upcoming) G20 Leaders Summit (Johannesburg) Trade & debt talks + climate agenda TBD: Gold & Oil likely react TBD Potential market volatility depending on communiqué tone
Dec 2025 (Upcoming) ECB Meeting Rate path decisions TBD TBD Possible rate cut → EUR weakness & gold relief rally

XAUUSD 15m – EW Short SetupHi fellow traders,
On the 15m XAUUSD chart, I am applying Elliott Wave principles to outline a short setup. Price has completed wave (v) and is now retesting the Fibonacci cluster between the 0.618 and 0.88 retracement levels, which aligns with a potential reversal zone.
I am entering at the current price, with a Stop Loss at 4059.16, serving as the invalidation level. My Take Profit levels are set at 3991.32 (TP1), 3985.71 (TP2), and 3965.74 (TP3), targeting the projected completion of the next corrective leg.
If price moves above the invalidation level, this wave count is no longer valid.
Good luck and trade safe!

#XAUUSD: Will There Be Major Price Correction On Gold? Dear Traders,
Gold has been rallying with strong bullish momentum and has not experienced a major correction since the last few weeks. We have identified a key level from which the price can continue its bullish momentum if fundamentals do not change. Furthermore, we can target $4200 in a few weeks if the current momentum continues.
Best regards,
Team Setupsfx_

GOLD surpasses $4,000, political risks and Fed rate cutOANDA:XAUUSD continued to rise in Asian trading on Wednesday morning, hovering around $4,006/ounce, approaching a record high. The gains were fueled by the risk of a US government shutdown, global political uncertainty, and expectations that the Federal Reserve (Fed) will ease monetary policy soon.
The US government shutdown has entered its second week, delaying many key economic data, including the non-farm payrolls (NFP) report. This lack of information increases the level of uncertainty about monetary policy and forces investors to predict the direction of the Fed based on market signals rather than data.
According to CME FedWatch, traders are now pricing in an 84% chance that the Fed will cut rates by 25 basis points at its October meeting, bringing the federal funds rate to a range of 3.75%–4.00%. The market is also pricing in a high probability of another cut in December.
The turmoil in the US government coupled with weak economic signals is reinforcing gold’s safe-haven status, especially in the context of a weak US dollar and volatile stock markets.
Alongside monetary policy, geopolitical risks are also playing a key role in sustaining demand for the precious metal.
In France, Prime Minister Sébastien Lecornu unexpectedly resigned just hours after taking office, raising concerns about the budget crisis and financial stability in the eurozone.
Meanwhile, in Japan, Sanae Takaichi’s victory in the ruling party leadership election has raised expectations that the Bank of Japan (BoJ) will maintain its easing policy for longer, thereby supporting gold prices.
In the currency market, the US dollar index (DXY) recovered slightly to around 98.7 points, but the upward trend was limited by expectations that the Fed will cut interest rates. At the same time, the yield on the 10-year US Treasury bond fell to 4.12%, reducing the opportunity cost of holding gold, a non-yielding asset.
If the non-farm payroll data after the government reopening shows a slowdown in job growth, investors believe this will further strengthen expectations of a new easing cycle by the Fed, thereby creating more momentum for gold to move towards the $4,100/ounce mark in the short term.
Technical outlook analysis of OANDA:XAUUSD
Trend analysis:
• Gold prices have been in a strong uptrend since mid-August, with a series of dense green candles and stable buying pressure.
• Currently, the price has surpassed the psychological level of 4,000 USD/ounce, closing the day above this level, showing that buyers are still in control of the market.
• The EMA50 (blue) continues to slope up, reflecting that the medium-term trend is still very positive.
• RSI remains above 70, signaling a mild overbought condition, but there is no clear bearish divergence signal, meaning that the uptrend still has room to run.
Important technical zones:
• Nearest resistance: $4,044 (0.382 Fibonacci level).
• Extended resistance: $4,113 and $4,182 (0.5 and 0.618 Fib) – potential targets for the next bullish wave.
• Short-term support: $3,959 (0.236 Fib) – important support zone for intraday recovery.
• Stronger support: $3,896 – $3,871, which coincide with the previous top and the lower edge of the rising channel.
Note:
• RSI is approaching the overbought zone, so a short-term technical correction may occur before continuing to increase.
• If the price closes below $3,950, be cautious of the possibility of a short-term recovery wave.
The main trend of gold is still strong, reinforced by technical factors and the macro context. In the short term, the $3,960 area is a potential buying point, with targets towards $4,110 - $4,180.
SELL XAUUSD PRICE 4038 - 4036⚡️
↠↠ Stop Loss 4042
→Take Profit 1 4030
↨
→Take Profit 2 4024
BUY XAUUSD PRICE 3974 - 3976⚡️
↠↠ Stop Loss 3970
→Take Profit 1 3982
↨
→Take Profit 2 3988

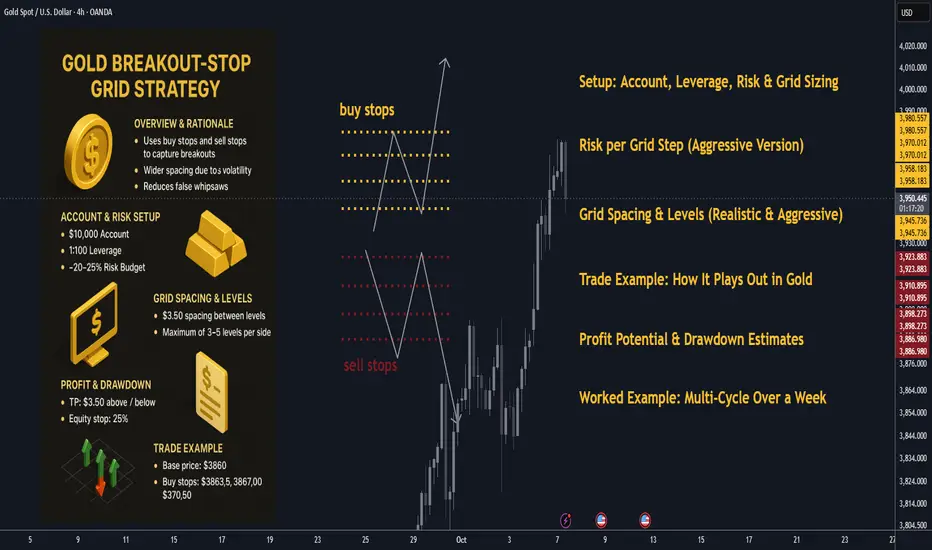
Gold Grid Trading Overview: Effective Strategy for 20% gains🪙 Gold Breakout-Stop Grid Strategy: Overview & Rationale
Grid trading is often built using limit orders above and below a base price, expecting the market to oscillate and capture many small profits. But in a strongly trending or volatile asset like gold, there is often breakout momentum that drives price through grid zones rather than bouncing.
By instead using buy stops above and sell stops below (i.e. breakout triggers), you capture directional thrusts, while still retaining a grid structure (i.e. multiple layers). Think of it as a hybrid between a breakout strategy and a grid.
Key advantages in gold:
• ✨ Gold often exhibits strong trending phases, with momentum after breakouts of supply/demand zones.
• 📊 Volatility is higher than many forex pairs, so you can space your grid more widely, reducing overcrowding.
• 🎯 With breakout stops, you reduce “false bounce” whipsaws inside the range; only when momentum validates do you trigger entries.
Risks / caveats:
• ⚠️ If price doesn’t break strongly and whipsaws, you could trigger and then reverse, creating drawdown.
• 📉 In a sideways gold market, fewer breakouts may be triggered, lowering trade frequency.
• 🛡 You must carefully size exposure and use drawdown controls, especially with leverage.
I’ll now walk through how to set this up, with gold-tailored specifics and sample trades (with increased aggressiveness), using realistic current spot prices (≈ $3,862) Investing.com.
________________________________________
🧮 Setup: Account, Leverage, Risk & Grid Sizing
📋 Account & Leverage
• Account size: $10,000
• Leverage: 1:100
• This means your maximum notional exposure is huge but margin and maintenance rules will limit you.
• We’ll now risk ~20–25%+ of equity in an aggressive version of this system (in order to aim for 20-30% weekly), i.e. $2,000–$2,500 at most drawdown limit for a grid run.
Note: This is very aggressive and only for demonstration. Many traders would never risk this much per grid.
💰 Risk per Grid Step (Aggressive Version)
• Let’s target $50 risk per triggered order (instead of $10) so that each step is meaningful.
• That means if a triggered order goes adverse by its maximum “stop zone,” your loss is $50.
• If you trigger, say, 5 steps, that’s $250 worst case on that direction (if all hit adverse).
• You must still cap total drawdown (e.g. 25% or $2,500) and limit exposures.
📈 Gold Contract & Price Movements
• Spot gold (XAU/USD) currently trades about $3,862.74 Investing.com.
• Let’s assume a contract specification such that 1 standard lot gives $100 per $1 move (so $1.00 move = $100) — a common ballpark in retail gold CFDs.
• Then:
• A move of $0.01 = $1 (for 1 lot).
• Therefore, if you trade 0.50 lots, a $1 move = $50.
So with this, to get ~$50 risk per $1 adverse move, 0.50 lots is a candidate (because $1 adverse × 0.50 lots × $100/lot = $50).
You can scale lot sizes accordingly.
📏 Grid Spacing & Levels (Realistic & Aggressive)
Given gold’s volatility, use wider spacing. Let’s choose:
• Grid spacing = $3.50 between successive triggers (a robust distance).
• We’ll place buy stops and sell stops relative to a base zone around current spot.
Let’s pick base ~ $3,860 as our pivot.
So:
• Buy stops: $3,863.50, $3,867.00, $3,870.50, $3,874.00, $3,877.50
• Sell stops: $3,856.50, $3,853.00, $3,849.50, $3,846.00, $3,842.50
(Max 5 levels each side, but you may cap to 3–5.)
Take Profit / Exit Logic:
• Target profit per trade = $3.50 (same as spacing).
• Thus one successful step = $3.50 × lot_size × $100.
• If lot_size = 0.50 lots, $3.50 × 0.50 × $100 = $175 profit per triggered trade.
• If you get 3 successful triggers in a run: 3 × $175 = $525 gross.
• That’s 5.25% on $10,000 in one clean directional run (before commissions/slippage).
You see the scaling is now aggressive — you risk more per step, but also gain more per successful trade. Limit how many triggers you allow (e.g. max 3–4 per side) to cap exposure.
Define a hard equity stop: e.g. if floating drawdown > 25% ($2,500), close all and reset.
________________________________________
🧭 Trade Example: How It Plays Out in Gold (Realistic Prices & Aggression)
We’ll do two detailed scenarios. This time we target higher returns, with real price zones.
________________________________________
🎯 Scenario A: Bullish Breakout
Base price: ~$3,860 (spot)
Buy stops: $3,863.50, $3,867.00, $3,870.50
Sell stops: $3,856.50, $3,853.00, $3,849.50
Lot sizing: 0.50 lots per order (so $3.50 adverse = $175 risk).
TP per trade: +$3.50
Sequence:
1. Gold climbs and breaks $3,863.50 → triggers Buy #1 at 3,863.50
o TP at 3,867.00 → profit if reached = ($3.50 × 0.50 × $100) = $175
2. Momentum continues, price breaks 3,867.00 → triggers Buy #2 there
o TP at 3,870.50 → another $175
3. Price surges, breaks 3,870.50 → triggers Buy #3 → TP = 3,874.00 → +$175
If all three succeed: Gross = $525 (5.25% gain) in one directional move.
If you allow up to 4 or 5 levels, total can scale to ~$700–900 (7–9%) in a strong move — if all hits. If reversal? If price reverses after buy #2, or before buy #3, you can:
• Close open longs immediately when opposite side’s sell stop triggers.
• Or cancel further buy stops once a reversal signal appears.
• Or net positions (if your broker supports hedging) — but that adds complexity.
Better to disable opposite side (sell stops) after the first buy triggers, to avoid collision exposures.
________________________________________
🔻 Scenario B: Bearish Breakout
Same base zone. Now price breaks downward.
• Sell stops at: 3,856.50, 3,853.00, 3,849.50
• TP each = –$3.50 from entry.
Sequence:
1. Gold breaks 3,856.50 → Sell #1 → target 3,853.00 → profit $175
2. Continues down, breaks 3,853.00 → Sell #2 → target 3,849.50 → +$175
3. Breaks 3,849.50 → Sell #3 → target 3,846.00 → +$175
If all three succeed: $525 profit.
If you allowed 4 levels: e.g. break 3,846.00 next → target 3,842.50 → +$175 more → total $700. Again, reversal risk must be managed.
________________________________________
📊 Mixed / Whipsaw Scenario
Suppose price crosses above $3,863.50 → triggers Buy #1, moves a bit, then reverses and crosses down through 3,856.50, triggering Sell #1.
You now hold:
• Long from $3,863.50 (losing)
• Short from $3,856.50 (potential profit)
This is a collision. To avoid chaotic risk:
• Cancel all opposite-side stops when first side triggers.
• Or immediately close all on first collision signal.
• Or lock in partial profit/loss and pause grid until trend clarity returns.
That’s why many breakout-grid strategies disable the opposite direction after first breakout.
________________________________________
📈 Profit Potential & Drawdown Estimates (Aggressive Model)
Let’s simulate one clean grid run (bullish) where 3 steps succeed fully:
• Gross profit = $525
• If you risked 3 steps * $175 = $525, worst-case these same 3 steps lose you $525 (if all adverse)
• Net = +5.25% in one run
• If you manage 2–3 such runs per week (if market allows), theoretically 10–15%+ weekly is possible — but that is optimistic.
However, in real life, not all runs will hit all targets — sometimes partial, sometimes losses. A drawdown of 25% ($2,500) is your cap boundary.
With that, if you undergo 5 bad runs in a row, you’d hit your equity stop.
If average win per run is $400 and average loss per bad run is $500, you need a favorable win-loss ratio to hit ~20–30% weekly. This is extremely aggressive.
________________________________________
🔁 Adaptive Mechanics & Enhancements (for robustness)
To improve consistency and manage risk, add:
• 📐 ATR-based spacing: Use a 14-period ATR on H4 or D1 to set grid spacing. If ATR = $4, spacing = $4 or $5.
• 📈 Trend filter: Only open buy-side grids when price > 200-period MA (H4 or D1), or only open sell-side when price < MA. Prevent fighting trend.
• 🚫 Volatility filter / news blocks: Do not place or trigger near major gold-related news (Fed, CPI, central bank announcements).
• 🔄 Grid rebase / reset: After a winning cycle, re-center grid around new price and restart stop orders.
• 📈 Scaling rules:
– Aggressive scaling: after n consecutive wins, increase lot size (within risk caps).
– Defensive scaling: after a loss, reduce lot size or skip grid.
• 🛑 Equity-stop / margin cap: If floating drawdown > 25% or margin usage > 80%, close all and reset.
• 🧊 Cooldown periods: After a loss or big run, pause grid orders for some hours/days to let market settle.
________________________________________
🧮 Worked Example: Multi-Cycle Over a Week (Aggressive)
Say you run 3 grid cycles in a week under trending conditions:
Cycle Direction Steps hit Gross profit Net (after one partial loss)
1 Up 3 out of 4 levels hit fully +$525 +$490 (small drawdown on partial)
2 Down 2 of 3 hit, 1 reversed +$350 +$320
3 Up 4 levels hit fully +$700 +$700
Total gross = $525 + $350 + $700 = $1,575
Net after adjustments/slippage ~ $1,450–$1,500
That’s ~ 14.5% gain in one week.
If the market is more favorable, you may hit ~20–30%, but the risk is commensurate.
Over multiple weeks the compounding is powerful — but a few big losses can wipe gains.
________________________________________
✅ Summary & Implementation Tips
• Use breakout stops (buy stops above, sell stops below) instead of limits to catch directional thrusts in gold.
• Wider grid spacing (e.g. $3–$5) is essential to survive volatility.
• Lot sizing must match your desired risk per step (here $50).
• Limit max triggers per direction and enforce a hard equity stop (e.g. 25%) to avoid blow-ups.
• Employ trend / volatility filters to filter low-probability entries.
• After a net winning run, rebase grid to current price.
• Use scaling and cooldown mechanics to moderate aggression.
• On collision signals, cancel opp side stops or close everything to avoid contradictory exposures.
Gold Key upside Levels All the upside levels which ive shared till 3900 $ have been hit. Now these are the levels to 4000$ . Simple to trade if a candle closes above any of these levels buy and if it closes below sell.

GOLD-SELL strategy Monthly chart Reg. Channelyes, we are still higher as if it will never stop. However, such lofty levels and RSI heights, are not normal, and adding to it the Reg. Channel severe breakout suggest caution. Short is still the way to be for medium-term to long-=term, is my personal view I am happy adding to shorts I already have.
Strategy sell OR add to SELL @ $ 3,950 - 4,100 and take profit on the way down between $ 2,950 - 3,150 for now.

Gold Targeting #4,100.80 - #4,200.80 ahead of #4,500.80 markAs discussed throughout my last week's commentary: 'Technical analysis: Gold reversed on Intra-day basis (even though DX is Trading near multi-session High’s, from now on / main correlation for the fractal) as Price-action was isolated within Neutral Rectangle which has Lower High's / High's - Low's. As I've mentioned before, current slide was nothing more but sweep to cool down Overbought levels however not discontinuation of Ascending Channel on bigger charts.. Hourly 4 chart's timeframe should turn green any minute now and as long as Price-action meets strong Support near #4,000.80 psychological benchmark which is showcasing strong rejection point, I expect test-and-break of the #4,052.80 - #4,057.80 zone which can extend Buying sequence widely above #4,100.80 psychological benchmark, preserving trendline on Hourly 4 chart which is Supporting the uptrend and rejecting every downside attempt since late September / early October fractal. It is worth noting that if #4,052.80 - #4,057.80 Short-term Resistance zone rejects current recovery attempt, #3rd Top on mentioned belt which is guarding the upside will be formed as Gold will be isolated within #2 strong trendlines until one of the levels break and delivers major move on the aftermath (I lean to the Bullish side as well).'
My position: I have been Buying Gold throughout Friday's session all along and Buying Gold firstly in #3,972.80 - #3,992.80 Neutral Rectangle waiting for the break-out to the upside. I had reached my Buying Profit Intra-day quota within the belt and started my usual Medium-term Buy orders positioning. I have Bought Gold (Medium-term) on #3,992.80 Support for the fractal as Gold was unable to break above #4,022.80 Resistance however my Stop was triggered on #3,985.80. I Bought Gold again on #3,978.80 again with #3,962.80 Stop and over the weekend / this morning my #4,042.80 Take Profit is hit, confirming my thesis that Traders shouldn't Sell Gold at all cost and turn to Buying this market. Each Selling momentum is just another sweep before Buyers arise and take Gold on upper levels. I do expect #4,100.80 benchmark to be met within #1 - #2 week horizon before #4,200.80 which is posing as my Medium-term Target. I achieved my weekly Profit and will take it easy from now.

Tariff tensions - the driving force behind gold price increases✍️ NOVA hello everyone, Let's comment on gold price next week from 10/13/2025 - 10/17/2025
⭐️GOLDEN INFORMATION:
Gold (XAU/USD) climbs during the North American session on Friday, trading near $3,997, up 0.6%, as renewed US-China trade tensions, the ongoing US government shutdown, and expectations of further Fed easing fuel safe-haven demand. Risk sentiment deteriorated after President Donald Trump warned of new tariffs on China, which threatened countermeasures on rare earth exports, while Trump dismissed the need to meet President Xi Jinping later this month.
⭐️Personal comments NOVA:
Tariff tensions return, US government remains shut. Gold price maintains bullish momentum above 4000
🔥 Technically:
Based on the resistance and support areas of the gold price according to the H4 frame, NOVA identifies the important key areas as follows:
Resistance: $4058, $4100
Support: $3980, $3942, $3895
🔥 NOTE:
Note: Nova wishes traders to manage their capital well
- take the number of lots that match your capital
- Takeprofit equal to 4-6% of capital account
- Stoplose equal to 2-3% of capital account
- The winner is the one who sticks with the market the longest

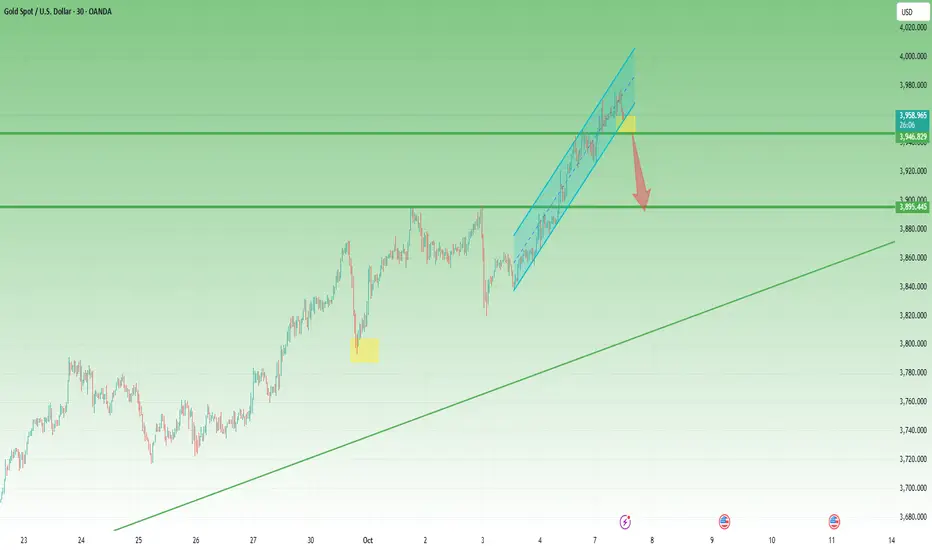
Gold: The Higher It Flies, the Louder the Correction WhispersAs explained in my Sunday video, the new all-time high for Gold is not a question of if, but how high it can rise once it firmly breaks above 3900.
Indeed, Gold has continued its unstoppable march, printing ATH after ATH, with the latest one formed during today's Asian session at 3977 — another almost 1,000 pips gained since Friday’s close.
At this point, there are two undeniable facts every trader recognizes:
1. The trend is extremely bullish.
2. A correction is long overdue.
________________________________________
Technical Outlook
The recent rally remains contained within an aggressive rising channel, but the overlapping highs in the last few hours reveal signs of exhaustion.
A confirmation for even a minor correction — and in this case, with Gold moving vertically, a 500-pip retracement would count as minor — would come with a break below the 3955–3850 zone.
Such a move would likely open the door for a retest of the 3900 area, which now serves as a key support.
________________________________________
Trading Plan
At the time of writing, I’m holding a short position, fluctuating near entry, with small alternating gains and losses.
While I do expect a pullback, I also keep in mind Keynes’s timeless reminder:
“The market can remain irrational longer than you can remain solvent.”
That’s why my stop loss is tight, and my focus is on discipline over prediction.
Pullback Alert: Gold Feeling the Heat at 4000As expected, gold continued to rise to the 3985-3995 area, reaching a high of around 3991, just a hair away from 4000. According to my calculations, the current resistance area of gold is located in the 3985-3995 area (for the specific calculation process, please refer to the previous trading idea). Therefore, I believe that within this range, we can begin to test the top and short gold.
Moreover, from the short-term performance, although gold still maintains a bullish trend, the short-term rise has been suppressed and the recent rise has weakened. Moreover, after the continuous rise in gold prices, the risk of chasing the rise has increased significantly. We must be cautious about the current rise and guard against signs of profit-taking at market highs. Moreover, gold has repeatedly reached highs in the 3980-3990 area. Repeatedly reaching highs in a limited area is likely to mean that gold will usher in a wave of irreversible pullbacks in the short term.
In addition, we need to focus on the area near 3960. If gold can still stay above 3960 during repeated pullbacks, then gold will still maintain its current strong position, or at least maintain high-level fluctuations; if gold falls below the area near 3960 during the pullback, then gold may continue the pullback trend and is expected to continue to 3930, or even around 3900.
So for the current short-term trading, I think the time is ripe to short gold, and I have already shorted gold according to the above trading plan. Now I just need to wait patiently for gold to pull back and make a substantial profit!

Gold 30Min Engaged ( Bullish Reversal Entry Detected )Time Frame: 30-Minute Warfare
Entry Protocol: Only after volume-verified breakout
🩸Bullish Reversal - 4040
🆚 Reasons To Enter The path
————
➕ Volume Engaged & Confirmed
➕ Time Zone Aligned (London / NY)
➕ Liquidity Cleared Below
➕ Cluster Shield Active
➕ Delta Shift Showing Buyer Control
➕ Reversal Formation Detected
➕ Price Below POC – Ready for Retrace
➕ Entry Prepared with Zero Emotion
➗ Hanzo Protocol: Volume-Tiered Entry Authority
➕ Zone Activated: Dynamic market pressure detected.
The level isn’t just price — it’s a memory of where they moved size.
Volume is rising beneath the surface — not noise, but preparation.
🔥 Tactical Note:
We wait for the energy signature — when volume betrays intention.
The trap gets set. The weak follow. We execute.
