Gold Drops Sharply – Losing Over 1000 Pips👋Hello everyone , what do you think about OANDA:XAUUSD ?
Gold continues to lose value for the third consecutive session on Tuesday, dropping to its lowest level in three weeks. Currently, the price is hovering around 3,930 USD, down more than 50 USD from the start of the session and losing more than 140 USD compared to the same time yesterday. This downtrend is expected to continue.
Gold experienced a sharp decline during early trading on Monday in the U.S. after news that the U.S. and China are close to reaching a major trade deal. This could ease economic risks and geopolitical tensions, factors that previously drove gold to a record high of 4,380 USD/ounce last week. Additionally, the drop is also due to technical selling below the psychological 4,000 USD level.
As mentioned in previous analyses, once the 4,000 USD psychological level was broken, the buy strategy was no longer preferred. From a short-term technical standpoint, there are no signs of a bottom forming yet. If the selling continues, the next target will be the 3,850 - 3,835 USD range. However, for a safer approach, it’s better to wait for confirmation of a retracement before making further decisions.
What do you think about the XAUUSD trend? 💬Feel free to share your thoughts!
Trade ideas

Fomc Xauuusd quick buy Gold (XAU/USD) is showing bullish momentum after FOMC news, bouncing from support around 3951. Price targets are set near 4153 and the long-term target at 4376. A breakout above resistance could trigger a strong upward move.

XAU/USD : Gold Breaks $4,000 Support – Can Bulls Hold the Line?By analyzing the Gold (XAUUSD) chart on the 2-hour timeframe, we can see that after rising to $4,138 and entering the marked supply zone, gold faced strong selling pressure and continued to drop, finally breaking below the $4,000 support and reaching $3,971.
As shown on the chart, this area is a key demand zone, and we expected a reaction here.
If gold manages to hold above the current level, we could see a short-term bounce toward $4,015. This analysis will be updated soon!
Please support me with your likes and comments to motivate me to share more analysis with you and share your opinion about the possible trend of this chart with me !
Best Regards , Arman Shaban

XAUUSDHello Traders! 👋
What are your thoughts on GOLD?
Gold has entered a sideways and choppy phase after reaching a new high and undergoing a correction.
The price is now consolidating within a narrow range between support and resistance, showing limited directional momentum in the short term.
In this area, we expect a short-term upward correction before the market resumes its downward move toward the highlighted support zones.
As long as gold remains below the resistance zone, the market is likely to continue its range-bound behavior followed by another bearish leg.
Don’t forget to like and share your thoughts in the comments! ❤️

Latest Gold Price Update Today – The Downtrend Isn’t Over Yet👋Hello everyone , great to see you again — let’s take a look at OANDA:XAUUSD !
From a fundamental perspective, gold remains range-bound as the US dollar (USD) shows a strong recovery following remarks from Fed Chair Jerome Powell during Wednesday’s press conference.
On the technical chart, gold has formed a clear Double Top pattern on the 4H timeframe, breaking its previous bullish structure and confirming a Change of Character (CHOCH) from an uptrend to a downtrend. Additionally, the EMA 34 and EMA 89 have crossed downward, reinforcing the short-term bearish signal.
For now, the immediate support zone sits around the psychological level of $3,900. If this level is broken, I expect another Break of Structure (BOS) to follow.
What about you — do you think gold will rebound from this support zone or continue falling in the coming sessions? 💬 I’d love to hear your thoughts in the comments!

GOLD (XAU/USD): Supply Zone Detected - Selling Now is HIGH RISKGold is retesting a key supply zone, which aligns with a recently violated horizontal support cluster and a rising trend line.
⚠️ HOWEVER —there’s a strong possibility that traders may aggressively sell, expecting a deeper bearish move.
For now, the price nicely respected the 3900 psychological support
that previously was a resistance.
Given the current setup, it’s best to avoid initiating short positions today.
Let’s hold off until the Fed Rate Decision announcement and observe how the market responds.

5 Mistakes That Make 90% of Traders Blow Their Accounts!“If you’ve ever blown an account, lost five trades in a row, or felt like the market is always ‘against’ you — congratulations, you’re about to discover the real reason behind your losses.”
In more than five years of trading and mentoring, I’ve seen thousands of traders fail — not because they’re bad, but because they repeat the same five deadly mistakes without realizing it.
⚠️ 1. Trading with Emotions – The “Adrenaline Rush” of Losing Traders
✅ You win one trade → overconfidence → open a bigger position.
❌ You lose one trade → anger → hold losing trades or revenge trade.
It all starts from your head, not your heart.
Trading is a game of discipline, not emotion.
Emotions make you break your rules, and when that happens — the market will teach you a painful lesson with real money.
To survive, don’t trade when you’re distracted — not while driving, eating, or arguing with your partner. Trade only when you have the time and focus to manage and monitor every market move.
💸 2. No Trading Plan – “Shooting Without Aiming”
Many traders don’t lose because they’re wrong — they lose because they don’t know what they’re doing.
Some open trades simply because they feel the price will rise. No clear entry, no stop loss, no take profit — that’s not a plan, it’s disguised gambling.
A solid trading plan must include:
✅ Fundamental market analysis
✅ Clear entry zones
✅ Defined profit targets
✅ Risk per trade not exceeding 2% of your account
(Want to understand this deeper? Check out my detailed guide on this topic. )
🔁 3. Constantly Changing Strategies – The “System-Hopping Syndrome”
You can’t train with five different gym coaches every day and expect a six-pack — trading works the same way.
This week you trade Price Action.
Next week, you switch to Indicators.
The following week, you buy an “AI Auto Trading” course.
Part of this comes from following too many signal groups online, trading blindly based on others’ calls instead of turning what you learn into personal knowledge.
👉 The result? You never stick with a single system long enough to master it.
Gradually, you start believing that no strategy works — when the truth is, you never gave any of them time to work.
Stop looking for a “perfect system” — it doesn’t exist. What you need is a consistent strategy and the patience to master it. Explore new ideas if you want, but always test them on a demo account until you can trade them profitably with confidence.
💔 4. Holding Losing Trades – “I Only Lose When I Close”
This is the mindset that causes 90% of traders to blow their accounts.
When you hold onto losing positions, you’re sacrificing your capital — the only thing that keeps you alive in the market.
Cutting losses is the art of survivors, not the failure of losers.
A great trader doesn’t fear losing — they fear losing the ability to come back to the market. Don’t aim to be right, aim to survive.
❌ 5. Not Learning from Mistakes – “Losing Yet Still Confident”
After blowing their accounts, many traders simply open a new one…
But they never review their losing trades, never keep a trading journal, and never identify why they lost.
If you don’t learn from failure, failure will repeat itself — only with more money lost next time.
Good traders lose many times, but they rarely lose for the same reason twice.
I once had a student who blew three accounts in a row but kept the same habits — because he believed, “Next time, I’ll get lucky.”
The result? He blew another one.
📍The market doesn’t punish beginners — it punishes the undisciplined.
If you can avoid these five habits, you’ve already beaten 90% of traders out there.
Trading can be a fast path to wealth — but only for those who forge mental strength and discipline. And only when you learn to control yourself, the money will start flowing your way.
If you’re serious about improving, start writing your Trading Journal today.
After 30 days, you’ll see a completely different trader within yourself.
Which of these five mistakes have you made — and how did you overcome them?
Share your story below to inspire others, or leave a comment to join the discussion!
Wishing you a successful trading day!

XAU/USD | Gold Fills Liquidity Gap – Another Drop Below $3,900?By analyzing the #Gold chart on the 2-hour timeframe, we can see that after reaching the $3,915 demand zone, price reacted strongly and began to rise, filling the liquidity gap created by last night’s drop. Gold is currently trading around $3,973, and if it fails to hold above $4,015, we could see another strong bearish move toward lower levels below $3,900. The next short-term bearish targets are $3,955, $3,947, $3,915, and $3,899.
Please support me with your likes and comments to motivate me to share more analysis with you and share your opinion about the possible trend of this chart with me !
Best Regards , Arman Shaban

Lingrid | GOLD Weekly Support Zone: Short Term Upside MoveOANDA:XAUUSD is approaching the weekly support area near 3,880, suggesting a short-term bullish impulse might be formed within the downward channel. Price action now moved below the 4,050, which aligns with prior breakdown structure and acts as a potential resistance level. As long as price sustains above 3,880, buyers may push toward 4,050 before meeting stronger resistance. Potential rejection near the lower channel boundary may hint at a corrective recovery phase gaining traction.
⚠️ Risks:
Federal Funds Rate decision on could reignite bearish momentum.
Rising Treasury yields may suppress gold’s short-term recovery potential.
Failure to hold above 3,880 would invalidate the short-term bullish scenario.
If this idea resonates with you or you have your own opinion, traders, hit the comments. I’m excited to read your thoughts!

GOLD I Weekly CLS I Model 2 - Target 50% I Eventually ATH...Hi friends, new range created. As always we are looking for the manipulation in to the key level around the range. Don't forget confirmation switch from manipulation phase to the distribution phase to make the setup valid. Stay patient and enter only after change in order flow. If price reaches 50% of the range take partial or full close.
📌 HTF - Higher Timeframe view
🧩 Complete proces and Strategy explained 👇 Click Below
🎯 Why your market approach also should be mechanical ?
NO Fixed Mechanical Trading Logic - You are guessing random patterns
NO Defined trading plan - Every trade different logic
NO Same logic in each trade - Not possible to backtest
NO Backtests on at least 300 trades - Not knowing Statistics
➡️ No Statistics ➡️ No Edge ➡️ Mindset ProblemS
🧠 Core of mindset problems
If you don't know your statistics on large enough data sample. You don't know your probabilities of win rate once the losing streak happen and it happens to every strategy. You will start doubting, hesitating to take next trade because you don't know statistics of your losses. In the end you will be doubting strategy and then jump to different one. You will be in the endless loop for years, looking for new better strategy. 👊 Your ultimate goal as a trader is not to be a generalist who knows 10 000 patterns. But rather create one system with narrowed criteria of each element of the trade to remove subjective and emotional decisions as much as possible and stick to this system no matter what. Practice it 10 000 times become a MASTER.
✨ Trading Mastery is reflection of your life
Have a longterm plan, No Alcohol & Drugs, Ignore others, Focus on your journey , Backtest regularly, Review your weeks, Journal mistakes, Exercise, Sleep well, Read books, Walks in nature (no phone) , Meditate, Reduce social media time, Spend time with family, Live Life.
Trading is hard, but not impossible. I believe in you 💪
David Perk aka Dave Fx Hunter

XAUUSDHello Traders! 👋
What are your thoughts on Gold?
Gold experienced a sharp decline last week, but found support around the $4,000 zone, leading to a modest rebound.
Since then, the price has entered a range-bound phase, oscillating between key support and resistance levels.
Current Outlook:
The next directional move depends on a breakout from this consolidation range:
A break above the resistance zone could trigger a move toward the previous high.
Conversely, a break below the support zone would likely signal a deeper bearish continuation and formation of new lows.
For now, gold remains in a neutral range, and it’s best to wait for a confirmed breakout before taking new positions.
Don’t forget to like and share your thoughts in the comments! ❤️

GOLD 1H CHART ROUTE MAP UPDATE & TRADING PLAN FOR THE WEEKHey Everyone,
Please see our updated 1h chart levels and targets for the coming week.
We are seeing price play between two weighted levels with a gap above at 4134 and a gap below at 4090. We will need to see ema5 cross and lock on either weighted level to determine the next range.
We will see levels tested side by side until one of the weighted levels break and lock to confirm direction for the next range.
We will keep the above in mind when taking buys from dips. Our updated levels and weighted levels will allow us to track the movement down and then catch bounces up.
We will continue to buy dips using our support levels taking 20 to 40 pips. As stated before each of our level structures give 20 to 40 pip bounces, which is enough for a nice entry and exit. If you back test the levels we shared every week for the past 24 months, you can see how effectively they were used to trade with or against short/mid term swings and trends.
The swing range give bigger bounces then our weighted levels that's the difference between weighted levels and swing ranges.
BULLISH TARGET
4134
EMA5 CROSS AND LOCK ABOVE 4134 WILL OPEN THE FOLLOWING BULLISH TARGETS
4174
EMA5 CROSS AND LOCK ABOVE 4174 WILL OPEN THE FOLLOWING BULLISH TARGET
4236
EMA5 CROSS AND LOCK ABOVE 4236 WILL OPEN THE FOLLOWING BULLISH TARGET
4288
EMA5 CROSS AND LOCK ABOVE 4288 WILL OPEN THE FOLLOWING BULLISH TARGET
4331
EMA5 CROSS AND LOCK ABOVE 4331 WILL OPEN THE FOLLOWING BULLISH TARGET
4360
BEARISH TARGETS
4090
EMA5 CROSS AND LOCK BELOW 4090 WILL OPEN THE FOLLOWING BEARISH TARGET
4042
EMA5 CROSS AND LOCK BELOW 4042 WILL OPEN THE SWING RANGE
4122
4075
EMA5 CROSS AND LOCK BELOW 4075 WILL OPEN THE SECONDAARY SWING RANGE
3987
3939
As always, we will keep you all updated with regular updates throughout the week and how we manage the active ideas and setups. Thank you all for your likes, comments and follows, we really appreciate it!
Mr Gold
GoldViewFX

Gold Rebound SetupGold (XAU/USD) is testing the support trend line around 4030. If it holds, price may rebound toward resistance levels at 4160 and 4236, with a potential target near 4370. A break below the trend line could indicate further downside pressure.

GOLD - Stop Trading Gold For NowGOLD - Stop Trading Gold For Now
For now, stay away from gold. I just see that something strange is happening and the reason is just some manipulation and nothing more.
Below is what I am reading, but it doesn't make sense:
💬A thaw in US-China trade relations has kind of pulled the rug out from under the gold price due to a drop in safe-haven buying flows,"
I would suggest to stay away from gold for a while and see what happens first.
⚠️It could be a bull trap and it could fall lower or it could be a bear trap and it could rise aggressively again. It's all happening for no apparent reason.
For the time being gold is positioned like it can drop more but I don't believe it too much
At the moment we have no confirmation on how it could take shape but it is back around a strong area and the psychological price is 3900 - 4000.
You may find more details in the chart!
Thank you and Good Luck!
❤️PS: Please support with a like or comment if you find this analysis useful for your trading day❤️

GOLD → Consolidation. The fundamental backdrop is changing...FX:XAUUSD stabilizes after a week-long decline, failing to consolidate above $4050. The market is taking a pause before new impulses. Focus on 4030 and 3980...
Investors are closing positions before the end of the week and month, the reason being the uncertainty surrounding the deal with China and Powell's less dovish stance on policy: a 25 bp rate cut is already priced in. The probability of a December cut has fallen to 72.8% (from 91.1% a week ago). Powell emphasized that decisions depend on data, which is not available due to the shutdown.
The strong dollar (2-month highs) is putting pressure on gold. Weak data from China (PMI fell to 49.0) is reducing demand from the largest consumer.
The balance is tipping towards weak fundamentals...
Resistance levels: 4030, 4085
Support levels: 3982, 3955, 3915
Technically, bears are keeping the market below 4030 - strong resistance. If buyers enter the market (there are currently no fundamental reasons for this) and the bulls are able to break through 4030 and keep the price above this level, we will have a chance for growth. But under the current circumstances, I expect a correction to support before a possible rise.
Best regards, R. Linda!

Lingrid | GOLD Weekly Market Outlook. Rally’s End or Reset?OANDA:XAUUSD explosive October rally — crowned by a historic monthly candle that shattered resistance and ignited euphoria — has now entered its reckoning phase. What looked like unstoppable momentum is now revealing signs of exhaustion. The sharp, volume-fueled drop toward $4,000 isn’t just a “healthy correction” — it’s the first real test of whether this bull can withstand gravity. And right now, the charts are whispering: "it may go down south".
The 4H chart reveals a classic “impulse leg” followed by an aggressive A-B-C correction — and we’re still in the “C” leg. But here’s the twist: if price breaks below $3,850 with conviction, the entire bullish structure collapses. That would open the door to a much deeper pullback — potentially down to $3,700 or even $3,600, targeting prior support zones and retesting the long-term upward channel’s lower boundary.
The monthly chart confirms the big picture: gold is in a powerful uptrend, but also in overbought territory after a vertical spike. The October candle closed above its open — a sign of strength, yes — but also a potential exhaustion signal since it formed a pinbar pattern. When markets rise too fast, they often fall harder.
In essence, gold is no longer climbing — it’s consolidating under pressure. The bull hasn’t died, but it’s breathing heavily. For us, this means one thing: sell the rips, buy the dips only if structure holds. The path of least resistance may now be downward. We should wait for confirmations.
If this idea resonates with you or you have your own opinion, traders, hit the comments. I’m excited to read your thoughts!

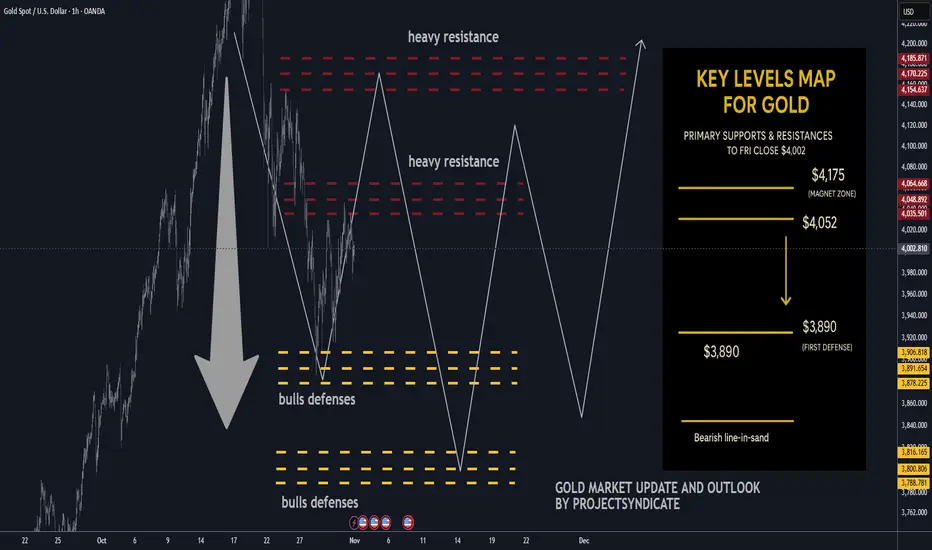
Gold next week: Key S/R Levels and Outlook for Traders🔥 GOLD WEEKLY SNAPSHOT — BY PROJECTSYNDICATE
🏆 High/Close: $4,108 → ~$4,002 — sellers defended overhead; weekly close soft within range.
📈 Trend: Neutral / correction mode still ON; not expecting new highs near term.
🛡 Supports: $3,890 → $3,800 — pivotal shelves for downside containment.
🚧 Resistances: $4,052 / $4,175 — magnet zones for supply / fade attempts.
🧭 Bias next week: Prefer short sells into $4,052–$4,175 with take-profit toward $3,890 → $3,800. Invalidation on sustained reclaim > $4,175; failure of $3,800 risks extension lower.
🌍 Macro tailwinds/headwinds :
• Rates: Real yields stable-to-firm keep upside contained; any dovish surprise could spark squeezes into resistance.
• FX: DXY mixed—lack of broad USD weakness limits impulse follow-through.
• Flows: CB/ETF demand supportive on deep dips but tepid near highs.
• Geopolitics: Event risk provides intermittent bids; not a trend driver this week.
🎯 Street view: Medium-term bullish narratives reserve diversification, policy easing into 2026 remain, but near-term tape favors mean-reversion lower under resistance.
________________________________________
🔝 Key Resistance Zones
• $4,052 — immediate ceiling; prior supply pivot likely to cap first tests
• $4,175 — upper resistance; acceptance above flips tone from corrective to constructive
🛡 Support Zones
• $3,890 — first defense; loss invites momentum probes
• $3,800 — critical structural base; break risks downside acceleration
________________________________________
⚖️ Base Case Scenario
Range-to-soft trade within $3,800–$4,175. Rallies into $4,052–$4,175 are sellable; expect rotations back toward $3,890 with scope to $3,800 if sellers press.
🚀 Breakout Trigger
Only a sustained acceptance > ~$4,175 negates the correction and opens $4,200+ pathing; conversely, firm rejection at $4,052 with a daily close < $3,890 increases odds of a $3,800 test.
💡 Market Drivers
• Fed path & real-yield drift
• USD index swings
• ETF/CB flow tone on dips vs. rips
• Risk sentiment headlines (geopolitics/trade)
🔓 Bull / Bear Trigger Lines
• Bullish above: $4,175 correction phase likely over if held
• Bearish below: $3,890 → risk expands under $3,800
🧭 Strategy
Short-sell from overhead resistances ($4,052 → $4,175).
Scale profits into $3,890 then $3,800; keep stops tight above trigger levels. Stand aside on fresh longs until sustained reclaim above $4,175 reasserts momentum.
Lingrid | GOLD Post Rate Decision Market ResponseOANDA:XAUUSD has rebounded from the lower boundary of the upward channel, maintaining structure support above $3,900. Price action shows a higher low forming after a wedge correction, hinting at renewed bullish pressure. A sustained hold above the $3,905–$3,950 zone could pave the way for a move toward $4,135. Momentum remains positive as buyers defend key support within the broader ascending structure.
⚠️ Risks:
Stronger U.S. dollar amid higher Treasury yields.
Unexpected hawkish tone from Federal Reserve policymakers.
Break below $3,900 invalidating short-term bullish outlook.
If this idea resonates with you or you have your own opinion, traders, hit the comments. I’m excited to read your thoughts!

Gold Tests Critical Support as Sellers DominateHello everyone, after the sharp decline late last week, gold (XAU/USD) continues to face selling pressure and is currently trading around $3,977, down more than 3% in just two sessions. This is the strongest correction in the past three weeks and has put the market into a defensive phase as price approaches the key psychological support zone at $4,000.
Observing the chart, we can see selling momentum is slowing as price nears the lower Fair Value Gap (FVG) at $3,950 – $3,970. This is an unfinished liquidity zone as well as an important technical support area where buyers may attempt a short-term reaction.
The scenario I favour at the moment is a liquidity sweep toward the $3,950 – $3,970 area before a technical rebound takes place. The nearest resistance to watch lies at $4,100 – $4,200, where multiple FVG clusters and potential selling pressure exist.

Gold Nears Resistance — Buyers Target $4,130 BreakoutHello traders, here’s my current outlook on Gold (XAUUSD). The market structure shows that Gold has recently shifted from a sharp bearish phase into a short-term recovery pattern, finding solid demand near the $3,940–$3,950 Buyer Zone. After the last strong drop from the $4,130 Resistance Level, price stabilized within this accumulation area and began forming an ascending structure supported by a clear Support Line. Currently, Gold is trading inside a rising wedge pattern — a signal of a tightening market where buyers are gradually gaining ground. The Resistance Line near $4,050 represents a short-term barrier, and a confirmed breakout above this level could open the way for a move toward the $4,130 Resistance Zone (TP1), which aligns with the previous Seller Zone. From my perspective, as long as the price remains above the $3,940–$3,950 Support Zone, the bullish bias remains valid. A successful breakout above $4,050 would likely confirm the continuation of the current upward momentum, targeting $4,130. However, if the price fails to break above resistance and falls below the ascending support line, a short-term pullback toward the Buyer Zone could occur before any new bullish wave develops. In my opinion, the market structure currently favors buyers, with strong support underpinning the move. Therefore, I’m expecting a potential bullish continuation toward $4,130 as the next key target.

GOLD 1H CHART ROUTE MAP UPDATE & TRADING PLAN FOR THE WEEKHey Everyone,
Please see our updated 1h chart levels and targets for the coming week.
We are seeing price play between two weighted levels with a gap above at 4042 and a gap below at 3992. We will need to see ema5 cross and lock on either weighted level to determine the next range.
We will see levels tested side by side until one of the weighted levels break and lock to confirm direction for the next range.
We will keep the above in mind when taking buys from dips. Our updated levels and weighted levels will allow us to track the movement down and then catch bounces up.
We will continue to buy dips using our support levels taking 20 to 40 pips. As stated before each of our level structures give 20 to 40 pip bounces, which is enough for a nice entry and exit. If you back test the levels we shared every week for the past 24 months, you can see how effectively they were used to trade with or against short/mid term swings and trends.
The swing range give bigger bounces then our weighted levels that's the difference between weighted levels and swing ranges.
BULLISH TARGET
4042
EMA5 CROSS AND LOCK ABOVE 4042 WILL OPEN THE FOLLOWING BULLISH TARGETS
4089
EMA5 CROSS AND LOCK ABOVE 4089 WILL OPEN THE FOLLOWING BULLISH TARGET
4136
EMA5 CROSS AND LOCK ABOVE 4136 WILL OPEN THE FOLLOWING BULLISH TARGET
4194
BEARISH TARGETS
3992
EMA5 CROSS AND LOCK BELOW 3992 WILL OPEN THE FOLLOWING BEARISH TARGET
3956
EMA5 CROSS AND LOCK BELOW 3956 WILL OPEN THE FOLLOWING BEARISH TARGET
3922
EMA5 CROSS AND LOCK BELOW 3922 WILL OPEN THE SWING RANGE
3866
3820
As always, we will keep you all updated with regular updates throughout the week and how we manage the active ideas and setups. Thank you all for your likes, comments and follows, we really appreciate it!
Mr Gold
GoldViewFX

What Do Global Experts Say About the XAUUSD Trend?👋Hello everyone , great to see you again! Let’s take a closer look at OANDA:XAUUSD today.
At the start of this new trading week, gold is showing a mild pullback, trading around $4,070 — down more than $44 at the time of writing.
In the short term, many Wall Street analysts are leaning toward a sideways or bearish outlook for gold. Among them, Jim Wyckoff, a veteran analyst at Kitco, predicts that gold will remain volatile with a downside bias this week:
“Large swings are pushing both buyers and sellers out of the market in the same session. When speculators retreat due to risk aversion, the trend often tilts lower.”
However, he also emphasizes that medium- to long-term support for gold remains intact. The U.S. government shutdown has now extended into its fourth week, and the lack of key economic data is adding to uncertainty — a backdrop where gold continues to serve as a safe-haven asset.
From my personal perspective, gold currently appears to be moving sideways and entering a phase of accumulation. The metal market looks somewhat exhausted after multiple strong rallies, and many traders seem to be waiting for a deeper correction before re-entering. The key support zone to watch lies around $4,030–$4,000 . If this level breaks, I would avoid buying immediately and wait for a more stable setup to emerge.
What about you — how do you see the gold trend unfolding next?
💬Share your thoughts in the comments below, and good luck with your trades!

Gold Market Update: Correction Mode 3750/3500 USD possible🟡 Where We Are Right now
After ripping to fresh records, gold snapped hard — WSJ logged the steepest one-day loss in years last week and a follow-through weekly drop as longs unwound.
Analysts across Kitco and others frame this as a technical/positioning correction after a parabolic run, with a fight around the $4k handle and scope to probe $3,750 → $3,500 if selling persists.
Sentiment/flows flipped: GLD and other gold ETFs saw notable outflows into the selloff after heavy YTD inflows. That flow reversal is consistent with a near-term correction phase.
🔻 Why the Market Is Correcting Now
1️⃣ Positioning & Froth Unwinds
The rally attracted outsized speculative length; once momentum cracked, forced de-risking kicked in. WSJ called out “long unwind” dynamics; Kitco says the correction could persist for months as near-term drivers fade.
2️⃣ $4k Failed on First Retest; Technical Break Triggered Stops
Kitco flagged a “fight for $4k” with downside risk if that shelf gives. Once sub-4k prints hit, systematic sellers likely accelerated.
3️⃣ Flow Flip in ETFs
After massive 2025 inflows, GLD posted a sharp daily outflow during the drop — classic late-cycle reversal behavior for a momentum move.
4️⃣ Macro Balance Less Supportive at the Margin
Even with long-term tailwinds (deficits/geopolitics), the recent leg higher ran ahead of fundamentals. Kitco and others note easing physical tightness and cooling central-bank buying pace compared with earlier in the year, removing a key prop for spot.
⚙️ Near-Term Levels That Matter (Tactical)
$4,000 → Battle zone. Regaining and holding above turns near-term tone neutral.
$3,750 → First meaningful downside target; aligns with multiple analysts’ “healthy pullback” zone.
$3,500 → Deeper correction magnet if flows/positioning continue to bleed; widely discussed as a plausible washout level.
🔮 4–8 Week Catalyst Map (What Can Push Price)
🏛️ Macro / Policy
Treasury Quarterly Refunding (Nov 5): Mix/size guidance can sway the long-end, USD, and real yields — key for gold. A heavier bill tilt (and steady coupons) is less threatening than a surprise coupon ramp.
Fed Communication Cadence: With the Oct 28–29 FOMC just occurred, watch minutes (Nov 19) + any guidance shifts. A less-dovish tone or firmer real yields = near-term headwind; growth scares or easing bias = support.
US Data Prints: CPI/PCE, NFP, ISM — anything that re-prices the path of real rates. (Direction of real yields remains the single most important macro input.)
💰 Flows & Positioning
ETF Flows (GLD/IAU): Continued outflows would confirm distribution; a turn back to net inflows often leads price inflections.
COT Positioning: If spec length compresses materially, downside fuel diminishes — setting up a cleaner base. (Track weekly CFTC updates.)
🪙 Physical / Seasonal
India Demand (festive/wedding season) and China retail demand can stabilize spot if discounts narrow and premiums re-emerge, but Kitco notes near-term tightness has eased versus the squeeze earlier in the rally.
📈 Base Case Outlook (Next 4–8 Weeks)
Trend: We’re in a bull-market correction — momentum currently with sellers — inside a bigger, intact secular uptrend. WSJ + Kitco both frame it as a technical consolidation after a near-vertical ascent.
Range Expectation: $3,500–$4,100 with whipsaws around $4k. The market likely tests $3,750 and could overshoot to $3,500 on negative macro surprises or persistent outflows before attempting a higher-low base.
Bull Re-acceleration Triggers:
(a) USD/real-yield rollover post-Refunding/Fed minutes
(b) A visible reversal in ETF flows
(c) Stabilization in Asia physical premiums
(d) Fresh geopolitical shocks
Bear Extension Risks:
(a) Firmer real yields / stronger USD
(b) Deeper ETF outflows and CTA/systematic supply
(c) Evidence of slower central-bank demand than H1
(d) Soft physical uptake into dips
⚔️ Trade / Hedge Tactics
If Underweight/Flat:
Stagger bids $3,760 → $3,520, scale size smaller into weakness; insist on confirmation (stops above prior day’s high) before adding.
If Long From Higher:
Respect $3,750 — below it, tighten or partially hedge (short miners, long USD vs. FX beta, or buy short-dated puts) targeting $3,500 as a potential flush.
If Momentum Trader:
Let $4,000 decide regime. Sustained reclaims with rising on-balance volume/ETF creations = green light for a bounce to $4,080–$4,150; failure = fade rallies into $3,950–$3,980.
🧭 What I’m Watching Day-to-Day
1️⃣ Treasury refunding headlines (Nov 5) and term-premium reaction.
2️⃣ Fed minutes (Nov 19) and any shift in balance-of-risks language.
3️⃣ GLD/IAU flow tape (creations/redemptions).
4️⃣ Kitco/WSJ desk color on physical tightness and dealer inventories.
