goldy goldcorrection or 4k? who knows gold can be very volatile near 4k. major dump or pump. lets see where it goes after this.
GOLDCFD trade ideas

Xauusd sell
"I believe the gold uptrend needs a period of recovery and consolidation before regaining strength."

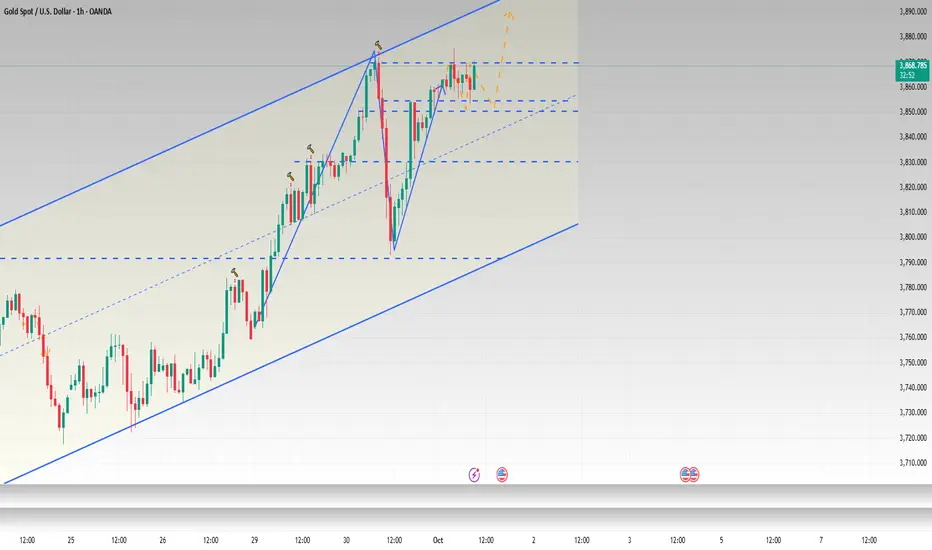
3875-3850 sell high and buy low,break to determine the directionGold continued to rise during the day and then fell into a narrow range of fluctuations after hitting the high of 3870. Initially, we expected gold to form a double top pattern, suggesting a potential sharp decline. But brothers, do you remember that I have repeatedly emphasized recently that the US government is facing the risk of shutdown? Yes, the U.S. federal government officially shut down at 12:01 a.m. Eastern Time on Wednesday because Democrats and Republicans failed to reach an agreement on a short-term spending plan.
As I mentioned before, a government shutdown would impact the release of important data such as ADP and NFP. The NFP data, originally scheduled for Friday, may not be released on time. At the same time, the government shutdown will also have a certain impact on the US economy, which will indirectly affect the gold trend. This is why VIP members and I chose to change the TP to 3855 and exit the market with profits.
Judging from the market trend, the current gold rising channel has not been broken, and gold is still in a bullish trend in the short term. Key support is at 3850; as long as this level holds, the bullish outlook remains. Pay attention to the pressure of 3870-3875 on the upside. Once it breaks, the gold price will test the channel pressure of 3890-3900.
20251001-XAUUSD IdeaA strong impulse has appeared on the higher timeframe, but it has not broken any significant lows. The higher timeframe remains bullish, at most expecting a pullback.
This week is NFP week, so pay attention to how the major players position themselves.

XAUUSD – 2H Analysis OBGold is currently trading around 3764, showing a very strong bullish momentum. The move has been so sharp that price didn’t even retest minor pullback zones. Let’s map out the scenarios:
🔹 Scenario 1 – Shallow Pullback (most likely)
First key support sits at 3700 – 3680 (2H OB).
A quick reaction here could push price towards 3780 – 3800 and later 3820.
🔹 Scenario 2 – Deeper Pullback
If selling pressure increases, watch 3640 – 3620 (POC) as the next strong demand.
A bounce from here can target the same upside levels 3760 – 3800.
🔹 Scenario 3 – Liquidity Grab Lower
If even POC fails, deeper supports are:
3560 – 3540 (Developing Daily POC)
and 3500 – 3480 (Golden Daily), a major liquidity pool.
✅ Note: With such strong bullish momentum, gold may not require a deep correction. Instead, even a shallow pullback could be enough for continuation. Waiting for confirmations on lower TFs (3m–5m) around these zones will provide safer entries.
📊 ProfitaminFX | Gold setups
📚 Multi-scenario & low-risk entries

GOLD – Bullish Above 3,820 as U.S. Jobs Data and Fed Cut BetsGOLD – U.S. Jobs Data in Focus
Gold remains supported as Fed rate-cut expectations continue to favor the non-yielding asset.
Trump’s new tariff policies, rising geopolitical tensions, and the risk of a U.S. government shutdown are further boosting safe-haven demand.
Momentum traders and steady ETF inflows add to the bullish backdrop.
This week, attention turns to U.S. labor-market data—weaker employment and steady unemployment would strengthen the case for Fed easing, potentially lifting gold further.
Unless the Fed unexpectedly changes its stance, the path of least resistance remains to the upside.
Technical Outlook
Gold is holding a bullish bias and is expected to extend toward 3,854 as long as price trades above 3,806–3,819.
Consolidation may continue between 3,819 and 3,854 until a breakout occurs.
A break below 3,806 would shift momentum bearish and expose 3,780 as the next downside target.
Pivot: 3,820
Resistance: 3,854 – 3,865 – 3,890
Support: 3,806 – 3,795 – 3,780

Gold – Waiting for the Perfect DipIn yesterday’s analysis, I mentioned that after reaching a new ATH just under 3800, Gold could enter a correction, and that this corrective move should be seen as a buying opportunity.
Indeed, we’ve had a pullback, but it hasn’t gone deep enough to trigger my buy limit orders – which kept me on the sidelines for now.
Still, my idea remains unchanged: I expect a liquidity dip closer to the 3700 zone, which stands out as the key support area for buyers.
Trading Plan:
• I continue to look for buying opportunities on dips, ideally around 3700.
• If price holds this zone, the bullish structure remains intact and another run toward ATH levels becomes likely.
• However, if Gold breaks below 3700, the market could enter a deeper correction phase, and I will have to re-evaluate my bias and strategy.

XAUUSD H2 XABCD SHORT/LONG sequence with price targets🔸Hello traders, let’s review the 2-hour chart for GOLD (XAUUSD). Price action has been volatile, but the market continues to respect harmonic levels. We are tracking a clean XABCD harmonic structure, offering both higher-risk and lower-risk opportunities depending on your trading style.
🔸Speculative XABCD structure defined by the following pivots:
X = 3625 A = 3689 B = 3639 C = 3709 D/PRZ = 3603
This setup still pending PRZ/D point, giving us potential reversal scenarios.
Advanced short entry is from C at 3709 with target exit at D/PRZ 3603 – higher-risk setup still pending
🔸Trade Analysis and overview:
Advanced short is still available from point C at 3709 with exit target at PRZ/D 3603. This is a higher-risk play, still pending
Now we shift focus to the lower-risk reversal setup: buying near the D/PRZ level at 3603. Harmonic patterns often suggest strong bounce potential from the PRZ, making this a solid buy/hold opportunity.
🔸Strategy & Targets:
BUY/HOLD from PRZ/D = 3603
TP1 = 3700 (first profit zone / re-test of structure)
TP2 = 3750 (extended target into higher resistance)
Manage risk with proper SL placement beneath PRZ.
🔸Key Notes:
Pattern suggests a bullish reversal from current zone.
Traders should remain patient as volatility around PRZ is common.
This is a swing trade setup, so allow time for structure to develop toward TP levels.
🎁If you find this analysis useful:
Hit the like button to show support 🙌
Drop a comment and let us know your view on GOLD!

H1 Outlook-Intraday Ceiling: Will 3760 Reject or Break?👋 Hello traders — welcome to the GoldFxMinds intraday outlook.
Gold has marched up into the 3760 round number, climbing straight into the 3770–3785 supply block. The first touch has already sparked a rejection wick — proof that sellers are defending. Higher timeframes remain bullish, but on the 1H, the legs look heavy. The battlefield is set: either this ceiling holds and drags price into stacked demands below, or buyers break through and release another wave of expansion.
🔹 Intraday Flow
Momentum is stretched, EMAs are pulling from below, and price has already signaled exhaustion. Liquidity pools sit both above and below — perfect conditions for traps. This is not about predicting direction, it’s about reading who takes control at the ceiling.
🗺️ Intraday Map
Above:
🟥 Immediate Supply (3770–3785) → active ceiling, already tested.
🟥 Second Expansion (3795–3810) → unlocked only if bulls force through.
🟥 Extreme Supply (3835–3850) → reached only in case of strong upside breakout.
Below:
🟦 First Demand (3745–3730) → shallow support just under price.
🟦 Second Demand (3715–3695) → firmer block, aligned with intraday EMA flow.
🟦 Third Demand (3645–3620) → deeper anchor, last defense intraday.
🔹 Scenarios
📉 If sellers hold the ceiling: rejection at 3770–3785 drags price first into 3745–3730. A clean break here exposes 3715–3695, with the deepest draw toward 3645–3620.
📈 If buyers break through: a push and close above 3785 opens the path into 3795–3810. With momentum behind it, gold could stretch into 3835–3850.
📝 Recap
Gold’s intraday map is balanced on the ceiling. Sellers have the first reaction, buyers still hold the bigger picture. The next hours will show if this is a rejection that fuels retrace, or the spark that ignites another leg higher.
✨ Closing Line:
3760 is the battlefield — rejection or breakout, both paths are mapped. Stay disciplined, wait for the reaction.
Follow, like and comment to stay aligned with GoldFxMinds intraday precision maps 🚀

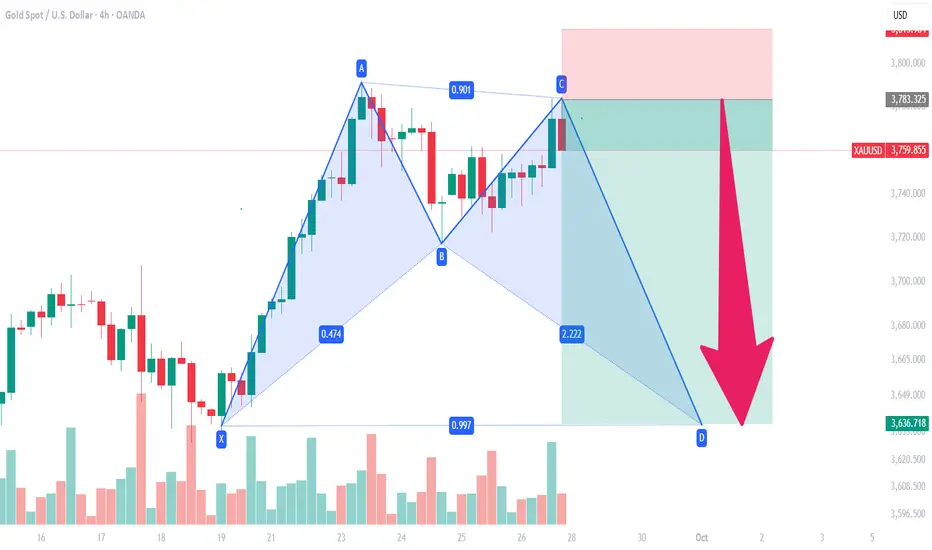
Butterfly pattern, gold prices are expected to fall!XAUUSD is forming a potential bearish harmonic pattern. If valid, the price may reverse from point C, targeting the D leg at a lower level.
Do your own analysis before taking this trade
Risk no more than 1%
Profitable Multiple Time Frames Smart Money Strategy For Trading
In this post, I will share with you a very accurate and profitable SMC Smart Money trading strategy that combines top-down analysis, liquidity, imbalance, order block and inducement.
Step 1 - Identify liquidity zones on a daily
Liquidity zones are the areas on a price chart, where big players are placing their orders. From such areas, significant bullish and bearish movements initiate.
Liquidity zones that are above the current price will be the supply zones, while the liquidity zones that are below the current price will be the demand zones.
We will look for shorting opportunities from supply areas and for buying opportunities from demand zones.
Here are the liquidity zones that I identified on EURJPY.
Step 2 - Wait for a test of one of the liquidity zones
Let the market test the liquidity zone.
For buying, the price should reach a lower boundary of a demand zone.
For shorting, the price should test an upper boundary of a supply zone.
I underlined the exact levels that the price should test on EURJPY.
Here is the test of the lower boundary of the demand zone.
Step 3 - Look for inducement on an hourly time frame
With the inducement, smart money make the market participants think that the liquidity zone that the price is testing doesn't hold anymore.
When the price tests a supply area, an hourly candle close above its upper boundary will be a bullish inducement.
With that, the smart money incentivize buying orders.
When the price tests a demand area, an hourly candle close below its lower boundary will be a bearish inducement.
With that, the smart money incentivize selling orders.
The price closed below a lower boundary of a demand zone on EURJPY on 1H time frame.
Step 4 - Look for imbalance on an hourly time frame
After a violation of a supply area on an hourly time frame, look for a bearish imbalance.
Bearish imbalance is a strong bearish candle with wide range and big body. With that candle, the market should return within a supply zone and closed within or below that.
After a violation of a demand area on an hourly time frame, look for a bullish imbalance.
Bullish imbalance is a strong bullish candle with wide range and big body. With that candle, the market should return within a demand zone and closed within or above that.
Here is the example of a bullish imbalance on EURJPY.
After a bearish inducement, the price formed a high momentum bullish candle and closed within the demand zone.
The imbalance signify that a liquidity zone violation was a trap .
With that, smart money simply was trying to grab the liquidity.
That will be a signal for you to open an order.
Step 5 - Look for an order block
After the formation of the imbalance, the market becomes locally week and quite often corrects to an order block.
Order block will be the closest hourly liquidity zone.
After a formation of a bearish imbalance, look for a supply zone on an hourly time frame. That will be your perfect zone to sell .
After a formation of a bullish imbalance, look for a demand zone on an hourly. That will be your area to buy from.
Here is the order block on EURJPY.
Step 6 - Set a limit order
Set a sell limit order within a supply area after a formation of bearish imbalance on an hourly time frame.
Set a buy limit order within a demand area after a formation of a bullish imbalance on an hourly.
Here is your buy entry level on EURJPY.
Step 7 - Select the target
If you sell, your target should be the closest daily structure support: horizontal or vertical one.
If you buy, your target should be the closest daily structure resistance: horizontal or vertical one.
In our example, our closest structure resistance if a falling trend line.
Step 8 - Set stop loss
If you sell, stop loss will lie above a bullish inducement.
If you buy, stop loss will lie below a bearish inducement.
Here is a perfect point for a stop loss for a long trade on EURJPY.
Step 9 - Trade
Let the price trigger your entry, and then be prepared to wait.
It took many days for EURJPY to reach the target.
Trading Tips:
1. Make sure that you have a positive reward/ratio. It should be at least 1.2
2. Risk no more that 1% of your trading account per trade
Being applied properly, that strategy shows 70%+ accuracy.
Try it by yourself and let me know your results.
❤️Please, support my work with like, thank you!❤️
I am part of Trade Nation's Influencer program and receive a monthly fee for using their TradingView charts in my analysis.

Gold: Correction Near 3700, Bulls Preparing for Another RunAfter printing a new ATH near 3800, Gold started a correction that pushed price as low as 3717.
The decline from the highs is corrective in nature, not impulsive, which keeps the broader bullish structure intact.
The key question now: has Gold finished its pullback, or will we see one more leg lower before the uptrend resumes?
Why I favor upside continuation:
• The 3700 zone stands out as a strong support area where buyers are expected to defend.
• Momentum indicators show loss of bearish pressure, consistent with a corrective move.
• The broader trend remains strongly bullish, with no structural break to the downside.
If 3700 holds, a reversal from here could easily re-expose the 3800 zone and potentially new highs beyond it.
Trading Plan:
My strategy is to buy dips into support, especially around 3700, aiming for a continuation higher. Risk management is crucial to such elevated prices, but the bullish bias dominates as long as 3700 remains defended.

XAUUSD targeting 3860 with the 1H MA50 supporting.Gold (XAUUSD) has entered a new Channel Up pattern by turning its 1H MA50 (blue trend-line) into Support.
The last time it formed such a pattern after a -2.00% decline was during September 19 - 23. Both fractals are identical in structure both in 1H MA50 and Channel terms.
The previous Channel Up eventually peaked a little above the 2.0 Fibonacci, which more than covers our 3860 Target. The pattern gets technically invalidated if the 1H MA50 breaks.
-------------------------------------------------------------------------------
** Please LIKE 👍, FOLLOW ✅, SHARE 🙌 and COMMENT ✍ if you enjoy this idea! Also share your ideas and charts in the comments section below! This is best way to keep it relevant, support us, keep the content here free and allow the idea to reach as many people as possible. **
-------------------------------------------------------------------------------
💸💸💸💸💸💸
👇 👇 👇 👇 👇 👇

Seize the opportunity of a gold dip!
Gold's broader trend continues as described in this morning's analysis. After breaking through 3707 at the start of the week, prices continued to gain momentum, reaching 3790 on Tuesday before retreating to 3752. The daily chart recorded a small positive trend, but while no clear reversal has been seen, the 4H chart shows a bearish trend. A pullback is expected with 3790 as the top by the end of the week, with an initial target of 3730-3707.
Intraday, prices fluctuated downward, currently trading at 3740. The 30-minute chart shows a bearish trend, and continued weakness is expected in the US market. Short-term resistance lies at 3760-3766, with strong resistance at 3770. Short-term support lies at 3752, with strong support at Tuesday's low of 3737. A break below this level could lead to declines to 3720 and 3707.
Traditionally, the intraday trend of 3772-3777-3770 confirms this trend, so a short position is recommended on a US market rebound.
Just sold near 3766, with a target of 3750-3730.

GOLD 1H CHART ROUTE MAP UPDATEHey Everyone,
Another great day in the markets with our chart idea playing out to perfection!
Yesterday, after hitting 3692 and 3717 with cross-and-lock confirmation, we got another cross and lock above 3717, leaving 3742 open. That level was hit perfectly today, followed by another cross and lock that opened 3768 also reached today, completing our 1h chart idea - Boooom 💥
Now, let’s shift to our 4H chart idea to target the remaining range. Any rejections in this zone could lead to lower Goldturns being tested for support and bounce inline with our plans to buy dips.
We will continue to buy dips using our support levels taking 20 to 40 pips. As stated before each of our level structures give 20 to 40 pip bounces, which is enough for a nice entry and exit. If you back test the levels we shared every week for the past 24 months, you can see how effectively they were used to trade with or against short/mid term swings and trends.
The swing range give bigger bounces then our weighted levels that's the difference between weighted levels and swing ranges.
BULLISH TARGET
3692 - DONE
EMA5 CROSS AND LOCK ABOVE 3692 WILL OPEN THE FOLLOWING BULLISH TARGETS
3717 - DONE
EMA5 CROSS AND LOCK ABOVE 3717 WILL OPEN THE FOLLOWING BULLISH TARGET
3742 - DONE
EMA5 CROSS AND LOCK ABOVE 3742 WILL OPEN THE FOLLOWING BULLISH TARGET
3768 - DONE
BEARISH TARGETS
3673
EMA5 CROSS AND LOCK BELOW 3673 WILL OPEN THE FOLLOWING BEARISH TARGET
3650
EMA5 CROSS AND LOCK BELOW 3650 WILL OPEN THE SWING RANGE
3622
3592
EMA5 CROSS AND LOCK BELOW 3592 WILL OPEN THESECONDARY SWING RANGE
3556
3528
As always, we will keep you all updated with regular updates throughout the week and how we manage the active ideas and setups. Thank you all for your likes, comments and follows, we really appreciate it!
Mr Gold
GoldViewFX

Xau/Usd - 15 Min Bullish Reversal In PlayTrendline Breakout:
A descending trendline has been broken to the upside, indicating a potential shift from bearish to bullish momentum.
Support Zone:
Price found support around the gray demand zone, suggesting buying interest.
Key Labels:
BOS (Break of Structure): Indicates previous bearish pressure.
CHoCH (Change of Character): Signifies a potential trend reversal.
ENTRY Point: Marked at the breakout of the trendline, suggesting a long position was taken there.
Target: 3900
A clear bullish target based on the chart's structure.
Aimed at the next liquidity area (marked "Weak High").
:
Bullish Bias due to:
Breakout of trendline.
CHoCH confirmation.
Bounce from support.
Strategy:
Entry on breakout
Target at 3900 (psychological level and previous high).
Likely stop-loss just below the support zone.

Gold: new highs build cautionWeekly gains continue for the price of gold, regardless of a slowdown during the second half of the previous week. At the start of the week gold reached another new all time highest level this year at $3.780. The environment of decreasing interest rates is supporting the price of gold. With the US PCE data posted for August at 2,7%, investors are continuing to expect two rate cuts till the end of this year, as per CME Fed WatchTool.
After reaching the new ATH at the beginning of the week, the price of gold slowed down further to the upside, as some profit-taking took place. The RSI continues to move within the highly overbought market side for the second week in a row. The indicator did not manage to move below the level of 70. This represents indication that some short reversals might be expected in the coming weeks. The MA50 is still strongly diverging from the MA200, without any indication that the change of course might come soon.
This week was focused on US inflation data, while the week ahead puts focus on US jobs data. As this represents a critical topic for investors at this moment, some higher volatility might be expected. Indicators are showing that a short correction in the price of gold might take place in the coming weeks. In this sense, a short move toward the $3.720 might be possible. A move toward the opposite side is still possible, depending on the market sentiment, however, the level could not be estimated, considering that the price of gold is moving highly within uncharted territory.

Gold opening operation strategy
News:
The core PCE price index, the Federal Reserve's preferred core inflation indicator, rose 0.2% month-over-month in August, in line with market expectations and down from the 0.3% initially reported in July (a figure that was revised downward to 0.2%). Year-over-year, the core PCE price index remained stable at 2.9%, indicating that inflation, while declining, remains above the Fed's 2% target.
The overall PCE price index rose 0.3% month-over-month in August, in line with expectations and higher than the 0.2% increase in July. The year-over-year increase also edged up slightly from 2.6% in July to 2.7% in August.
Specifically:
Friday's US market hit near 3784 before retreating, which is also our expected target.
The market closed at 3760, with the 4-hour chart showing a bearish pullback pattern. The daily chart formed a small bullish candlestick with an upper shadow on Friday, once again crossing above the moving average, indicating a potential for a secondary rally. The weekly chart also closed with a medium-sized bullish candlestick, indicating an overall bullish trend.
From the 4-hour analysis, short-term support below is around 3735-3740, with important support remaining around 3720. Short-term pressure above is around 3770-3780. Trading strategies should focus on buying on pullbacks. In the intermediate range, be cautious in chasing orders and patiently wait for key entry points. I will provide detailed trading strategies in the channel, so please pay attention.
Strategy:
Long Position3740-3735,SL:3720,Target:3770-3790

XAUUSD: Continuation of the pullbackPrice failed to break the Asian session high at 3,753 (no candle close above it). As a result, a deeper correction is likely before any new advance. The pullback targets are , and if extended, .
📉 Analysis
Wait for an Easy Trend sell signal on a break below the trendline with big volume.
Key resistance: , .
Key support: , , .
📊 Trading Plan
Wait for an Easy Trend confirmation when price breaks the trendline to the downside on strong volume, first target is 3717.
Example (SIGNAL): On 15m timeframe, price breaks the trendline with high volume — enter on the candle close, with the stop below the most recent swing low.
Risk management: Place the stop above/below the nearest 5m swing high/low, move to break-even at 1R (R:R = 1:1).
Please like and comment to support our traders. Your feedback motivates us to produce more analysis in the future 🙏✨

Weekly Outlook-Gold’s Ceiling or Turning Point?Hello traders, welcome to this week’s GoldFxMinds outlook.
We’re stepping into a decisive week for gold: price is pressing directly into a premium supply area on the weekly chart, with momentum stretched and no real retracement since summer. The question is simple — do bulls have the power to break higher, or is it time for sellers to take control? Let’s map it out.
🌍 Macro & News Context
This week’s calendar is heavy on USD catalysts:
JOLTs (Tue) & ADP (Wed): labor flow setting the stage.
OPEC Meetings (Wed): energy shifts feeding into inflation expectations.
Friday’s NFP & Unemployment Rate: the key decider — strong jobs = strong USD (bearish gold); weak jobs = softer USD (bullish gold).
Volatility is guaranteed into Friday, and gold will react directly to these macro flows.
📊 Weekly Bias: Bearish–Neutral
At 3760, gold sits inside the Premium Weekly Supply (3770–3835). RSI shows divergence, candles are extended, and no retrace has rebalanced the trend since summer. Until 3835 breaks, sellers have the upper hand.
🔑 Structural Zones
Above (Supply):
🟥 Premium Weekly Supply (3770–3835) – current ceiling.
🟥 Extreme Supply Cap (3895–3945) – last resistance before new expansion.
Below (Demand):
🟦 First Weekly Demand (3640–3600) – clean OB, first buyer defense.
🟦 Mid Weekly Demand (3480–3430) – structural shelf + fib + EMA21 confluence.
🟦 Deep Institutional Demand (3250–3200) – HTF anchor.
🟢 Bullish Scenario
If bulls absorb supply at 3770–3835, continuation can unfold into 3895–3945. A weekly close above 3945 validates sustained upside.
🔴 Bearish Scenario
If sellers reject from supply, first draw is 3640–3600 demand. If broken, price may extend to 3480–3430, and in deeper case towards 3250–3200.
📝 Weekly Recap
Bias: Bearish–Neutral — stretched into supply.
Above: 3770–3835 / 3895–3945 supply zones.
Below: 3640–3600 / 3480–3430 / 3250–3200 demand zones.
Catalyst: Friday’s NFP will decide the weekly close.
✨ Closing Line:
This week, gold stands face-to-face with its ceiling. Will NFP hand control to the bulls, or will sellers drag price back into demand at 3640?
Share your bias in the comments , like and follow GoldFxMinds for premium weekly precision maps 🚀

Gold Bull Flag and new ATHsBullish Signs are showing a high probability of new All Time Highs around 3800. Let's ride the trend till the wheels fall off.

XAUUSD Hits New Highs 👋Hello everyone, what do you think about OANDA:XAUUSD ?
Yesterday, gold recorded a strong rally, surging to 3759 USD, an impressive gain of over 65 USD compared to the previous session, reaching our expected target.
In the new trading session, gold has reached a new record high, driven by growing expectations of further Fed rate cuts and increasing demand for safe-haven assets amid political instability.
Safe-haven flows are also being reinforced by prolonged geopolitical risks, including the Russia-Ukraine conflict, concerns over the economic impact of U.S. President Donald Trump’s tariffs, and strong gold purchases by central banks.
From a technical perspective, gold remains well above both the EMA 34 and EMA 89. Although the sharp increase has prompted some investors to take profits, I personally believe the uptrend is not over, as gold continues to be the top choice for preserving wealth. My target is 3800 USD in the near future.
And you, what do you think about the trend of XAUUSD?

Gold Targeting #4,000.80 markTechnical analysis: The #3,745.80 former hard Resistance now turned in Support is now crossed and Gold is now Technically ready to accomplish new local High’s. Personally, I am surprised that Gold didn't re-tested #3,700.80 mark on renewed DX strength as it was fair to expect it both Fundamentally and Technically. Gold recovered #3,732.80 - #3,757.80 without any catalyst (strong Hourly 4 chart's series of Bullish candles) which in my opinion wiped out and liquidated many Sellers from the market. This will be essentially a Higher High’s Upper zone first on Ascending Triangle which was created throughout yesterday's session which was invalidated to the upside / validating my expectation of an #10 to #15 point Trading range (Rectangle) on however aggressive pace for the next #1 - #2 session horizon. The (#1W) Weekly candle is now at (# +2.67%) and the week will most likely close on a positive note following last candle's (# -0.67%). I will take advantage of the Lower High’s Lower zone, giving distinguished Buying opportunities within this relief rally / Bullish Intra-week cycle and Profit on wide timeframes for reduced Risk. Traders have to realize that Trading against Gold’s Hourly 1 and 4 charts should backfire sooner or later. I am looking at #3,762.80 / #3,778.80 / #3,782.80 and / #3,792.80 test initially as I do expect that Trading will be performed widely above #3,800.80 benchmark mid next Monty as even strong DX didn't managed to deliver more serious decline on Gold. #3,722.80 benchmark however is next strong Support and break of the configuration will negate Short-term Bullish potential. I am very satisfied with my Bullish stance and Profits I am making on Intra-day basis even though I am well known Seller of the market (I have to adjust to the trend). Needless to mention, I do expect and preserve my #4,000.80 mark as my Medium to Long-term Target. Enjoy the Profits and have a great weekend!
