Gold Targeting #4,000.80 markTechnical analysis: The #3,745.80 former hard Resistance now turned in Support is now crossed and Gold is now Technically ready to accomplish new local High’s. Personally, I am surprised that Gold didn't re-tested #3,700.80 mark on renewed DX strength as it was fair to expect it both Fundamentally and Technically. Gold recovered #3,732.80 - #3,757.80 without any catalyst (strong Hourly 4 chart's series of Bullish candles) which in my opinion wiped out and liquidated many Sellers from the market. This will be essentially a Higher High’s Upper zone first on Ascending Triangle which was created throughout yesterday's session which was invalidated to the upside / validating my expectation of an #10 to #15 point Trading range (Rectangle) on however aggressive pace for the next #1 - #2 session horizon. The (#1W) Weekly candle is now at (# +2.67%) and the week will most likely close on a positive note following last candle's (# -0.67%). I will take advantage of the Lower High’s Lower zone, giving distinguished Buying opportunities within this relief rally / Bullish Intra-week cycle and Profit on wide timeframes for reduced Risk. Traders have to realize that Trading against Gold’s Hourly 1 and 4 charts should backfire sooner or later. I am looking at #3,762.80 / #3,778.80 / #3,782.80 and / #3,792.80 test initially as I do expect that Trading will be performed widely above #3,800.80 benchmark mid next Monty as even strong DX didn't managed to deliver more serious decline on Gold. #3,722.80 benchmark however is next strong Support and break of the configuration will negate Short-term Bullish potential. I am very satisfied with my Bullish stance and Profits I am making on Intra-day basis even though I am well known Seller of the market (I have to adjust to the trend). Needless to mention, I do expect and preserve my #4,000.80 mark as my Medium to Long-term Target. Enjoy the Profits and have a great weekend!
GOLDCFD trade ideas

XAUUSD: The last bull run?FXOPEN:XAUUSD keeps grinding higher, but the structure suggests this may be the last impulse of the current move. I expect price to complete the advance into the large liquidity pocket at before a sharper correction, as upside momentum has started to fade.
You can read my previous analysis here:
CME flow shows heavy long-call positioning around 3867. A failure back below 3867 would likely open a deeper pullback.
That said, there is still a Margin Zone/liquidity pool at actively traded by CME participants, so price may push through 3867 toward before reversing.
Watch 3828 (prior session POC) — price can react and bounce from 3828 without visiting the deeper supports.
Key support: ,
Margin Zone:
Trading Plan
Sell: Look for strong sell signals from Quantum Vol-Delta on the M5/M1 timeframes inside .
Buy: If price pulls back into the key supports, wait for Quantum Vol-Delta to confirm buyers returning → Enter on the candle close.
Risk management:
Stop loss: below/above the most recent 5m timeframe swing low/high or beyond the respective support/resistance zone.
Move to break-even at +1R (R:R = 1:1).
Please like and comment below to support our traders. Your reactions motivate us to do more analysis in the future 🙏✨

GOLD: Great Breakout Will Give Us A Close Buy TradeHere is My 2H Gold Chart , and here is my opinion , the price going up very hard without any correction so we should move with it and we have a 4H Candle closure above it And Perfect Breakout and this give us a very good confirmation , so we have a good confirmation now to can buy after the price go back to retest the broken area 3790.00, and we can be targeting 100 to 200 pips . if we have a daily closure below this area this mean this idea will not be valid anymore .
Reasons To Enter :
1- Perfect Touch For The Area .
2- Clear Bullish Price Action .
3- Bigger T.F Giving Good Bullish P.A .
4- The Price Take The Last High .
5- Perfect 2H Closure .

12345 GoldiePosible for the momentum given in the market.
Strech Hand for 30% more Before Major 80% correction
Risk Management is Key.
Full body Cnalde Above 3750-55 & we could see a push fr 3800 & higher

Adjustment direction before the non-farm payroll data: Sell!
Gold prices rose from 3825 to 3871 in the Asian session today, before quickly selling off in the European session and breaking down to 3808.
The 4H chart has weakened, and a volatile downward trend is currently expected. Short-term resistance is 3825-3832, with strong resistance at 3840. Short-term support is 3808-3800, with strong support at 3790 and the daily MA5-3780.
Operationally, short selling is recommended before the non-farm payroll data release, with specific pre-market guidance.
Sell near 3832, with a target of 3800-3790-3785. Hold if the price falls below.

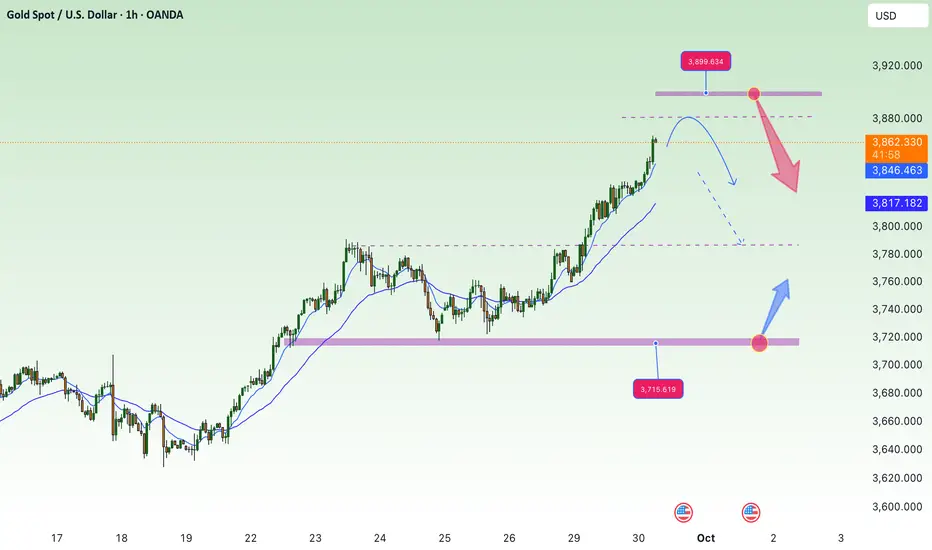
Gold’s September Finale – October Opens in FireHello traders, and welcome to a new trading month! ✨
September gave us one of the most aggressive rallies of the year, driving gold straight into the 3870 supply wall. Liquidity was swept, sellers reacted, but buyers are still holding the line. Now, as October begins, the question is simple: will the foundation hold, or does the market seek deeper demand before new highs?
🌍 Macro & News Context
This week is no ordinary start.
OPEC Meetings (Wed): energy shocks can spill over into inflation outlooks, a key gold driver.
ADP Employment (Wed): labor market tone-setter before Friday’s NFP.
ISM PMI + Prices (Wed): inflation sub-index is critical — markets will instantly recalibrate Fed path.
Macro + technicals are aligned for volatility. October doesn’t open quietly; it opens into a storm.
🟦 Support Zone – 3815–3800
This is the foundation. A flip from resistance into support, defended yesterday with surgical precision. As long as buyers protect this ground, bulls keep control.
🟥 Supply Zone – 3860–3875
The ceiling. This is where September ended — heavy seller reaction, liquidity sweep, rejection. Only a clean break here reopens expansion.
⚪ Decision Zone – 3838–3845
This is October’s control point. Whoever wins this area writes the month’s first chapter.
📌 Scenarios
🟢 Bullish Play: Hold above 3838–3845, defend 3815, and momentum reloads into 3860–3875 supply. Break that, and October could see fresh expansion.
🔴 Bearish Play: Lose 3815–3800, and pressure drags gold toward 3778 → 3748 demand.
✅ Probability & Tactical Map
Bias is neutral-to-bullish while 3815 holds. But this is a decision week: macro events will decide if gold expands above supply or sinks into deeper support.
Gold closes September strong, but October opens on the edge. Between supply and support, between fundamentals and flows — the battlefield is set.
✨ Follow GoldFxMinds for surgical precision maps. Don’t forget to LIKE, COMMENT & FOLLOW to stay ahead 🚀

2025-09-29: GOLD LONGGOLD LONG
EP 3818, 3813
TP 3836, 3846, 3856
SL 3808
We've got good positive momentum, MACD 30m suggests we're about to swing to positive and break through some key levels, which is supported by RSI +50 point too.
I can see an outcome where instead of going straight up here, we get a short term dip back down towards entry if it follows the decline trend line (closes for confirmation at or below that).
Trade at your own risk, do your own research, I'm not a professional or an advisor, just sharing what I do recreationally with money I have spare and don't care about loosing.

Bulls continue to increase prices, creating new ATH⭐️GOLDEN INFORMATION:
With little on the US calendar, Fed officials dominated headlines on Monday. St. Louis Fed President Alberto Musalem repeated his hawkish stance, warning that inflation expectations remain elevated despite rising risks of labor market weakness. New York Fed President John Williams noted that policy is restrictive enough to pressure inflation lower, while the labor market shows gradual signs of softening. Meanwhile, Cleveland Fed President Beth Hammack stressed that inflation is still too high and blamed tariffs for stalling the disinflation process.
⭐️Personal comments NOVA:
Markets are positive, rising after expectations of a rate cut in October increased.
⭐️SET UP GOLD PRICE:
🔥SELL GOLD zone: 3900- 3902 SL 3907
TP1: $3890
TP2: $3880
TP3: $3870
🔥BUY GOLD zone: $3819-$3817 SL $3812
TP1: $3828
TP2: $3840
TP3: $3850
⭐️Technical analysis:
Based on technical indicators EMA 34, EMA89 and support resistance areas to set up a reasonable BUY order.
⭐️NOTE:
Note: Nova wishes traders to manage their capital well
- take the number of lots that match your capital
- Takeprofit equal to 4-6% of capital account
- Stoplose equal to 2-3% of capital account
Gold's past analysis and future outlook!
As I predicted, gold surged above 3,800 today and held steady. So, what are the future trends for gold?
First, the overall trend is undoubtedly upward, as we've discussed in detail before. I personally believe it won't be a problem for it to reach 4,000 by the end of the year. Only 100 USD pairs remain, and based on the current trend, it's a one-shot move. Therefore, two scenarios are possible:
First, a direct surge to 4,000 followed by a deep correction;
Second, a deep correction followed by a further push to 4,000.
A deep correction here refers to a peak decline of $200-250. I believe the first scenario is more likely for three main reasons:
First, the overall trend remains strong, with rising prices more likely than falling prices. The daily charts are mostly showing single-line corrections, which do not alter the overall bullish trend and upward momentum.
Second, there are two more interest rate meetings this year, one in October and one in December. The market is highly skeptical of another 25 basis point rate cut in October. These close timings leave little time and room for a correction in gold. The October Fed rate decision is on October 30th, at the end of the month. As long as expectations of a rate cut persist, October is likely to continue its upward trend, with a peak and a deep correction expected in November.
Third, gold's overall trend this year is very similar to last year's. Last year, it saw two consecutive upticks in the second half of the year that continued until the end of October, followed by a deep correction on October 30th and 31st, dropping $254 from 2790 to 2536. This year, at the same time and within the same cycle, the overall trend is largely the same. I believe the probability of a repeat of last year's trend in the coming months is high.
In short, don't expect a significant correction in gold right now. The recent significant increase in holdings of the world's largest gold ETF may confirm this. Therefore, follow the trend and avoid blindly guessing the top. This will prevent any major strategic errors; the remaining issue is tactical approach.
Take a look at my chart annotating gold prices for 2024!
Compare it to this year's chart and you'll agree!

Gold Trade plan 30/09/2025(Correction Time)📊 Gold (XAUUSD) Technical View
Price has now reached the top of the daily channel around 3865 – 3885.
🔻 From this resistance zone, I expect a reaction and potential downside move toward the targets:
3800
3750
3700
3680
⚠️ Watch for bearish signals in this area as price tests the upper channel boundary.
Regards,
Alireza!

XAUUSD: Trend is your friend, follow it!Price remains in a strong uptrend with no clear signs of momentum weakness yet. That said, this appears to be the final leg of the current advance, so chasing highs is risky. I prefer to stand aside for now and wait for price-action confirmation of a top.
1) Analysis
Price has broken above the prior high at 3.791, but the Superior RSI has not reached the overbought zone and is showing early signs of divergence on 1h timeframe.
The area is a high-activity auction zone on CM E, from here I expect a short pullback into lower supports.
Key support: , , .
2) Primary Scenarios
Scenario A (bearish): If price breaks below and drives into lower supports, then 3.818 will likely mark the swing high, and a deeper correction should follow.
Scenario B (bullish extension): If price respects the support zone and breaks above 3818 then I expect price to at least top at 3866 where CME traders place a large amount of auction contracts and start a correction.
Please like and comment to support our traders. Your feedback motivates us to produce more analysis in the future 🙏✨

Gold on the path towards #4,000.80 markAs discussed throughout my Friday's session commentary: 'Technical analysis: The #3,745.80 former hard Resistance now turned in Support is now crossed and Gold is now Technically ready to accomplish new local High’s. Personally, I am surprised that Gold didn't re-tested #3,700.80 mark on renewed DX strength as it was fair to expect it both Fundamentally and Technically. Gold recovered #3,732.80 - #3,757.80 without any catalyst (strong Hourly 4 chart's series of Bullish candles) which in my opinion wiped out and liquidated many Sellers from the market. This will be essentially a Higher High’s Upper zone first on Ascending Triangle which was created throughout yesterday's session which was invalidated to the upside / validating my expectation of an #10 to #15 point Trading range (Rectangle) on however aggressive pace for the next #1 - #2 session horizon. The (#1W) Weekly candle is now at (# +2.67%) and the week will most likely close on a positive note following last candle's (# -0.67%). I will take advantage of the Lower High’s Lower zone, giving distinguished Buying opportunities within this relief rally / Bullish Intra-week cycle and Profit on wide timeframes for reduced Risk. Traders have to realize that Trading against Gold’s Hourly 1 and 4 charts should backfire sooner or later. I am looking at #3,762.80 / #3,778.80 / #3,782.80 and / #3,792.80 test initially as I do expect that Trading will be performed widely above #3,800.80 benchmark mid next Monty as even strong DX didn't managed to deliver more serious decline on Gold. #3,722.80 benchmark however is next strong Support and break of the configuration will negate Short-term Bullish potential. I am very satisfied with my Bullish stance and Profits I am making on Intra-day basis even though I am well known Seller of the market (I have to adjust to the trend). Needless to mention, I do expect and preserve my #4,000.80 mark as my Medium to Long-term Target. Enjoy the Profits and have a great weekend!'
My position: I am Buying Gold as planned on each reversal and local Low's test as I Bought #3,763.80 and #3,765.80 / kept it over-night and my #3,800.80 Target is hit and orders closed automatically. I have Bought minutes ago on #3,813.80 and currently holding my Buying orders / #3,827.80 test.

Gold’s Uptrend Exhausted, Preparing For A Correction The price of Gold (XAU/USD) has already experienced a significant upward movement and has now reached a point where there is likely little room for further upside momentum. The chart shows a potential "Weak High" at the top, indicating that the price may have exhausted its bullish momentum and is unlikely to continue rising further in the short term.
The chart also highlights a "Break of Structure" (BOS), which is a key signal that the trend might be shifting. After such a strong rally, there's often a correction or reversal, especially if the price has overshot or moved into areas where buying pressure has already been absorbed.
The forecasted targets for the downside are marked as TP1 and TP2, suggesting that a drop toward these support levels (indicated by the OB areas) is likely. As the market cools off, expect a pullback or downward move, with the price potentially finding support around these levels before either consolidating or reversing further.
Overall, the market seems to have "pumped enough" and is now in a position to reverse or retrace. The bullish momentum is likely running out of fuel, and a fall back to lower price points is expected.

Gold Chart Update (XAU/USD)Quick breakdown:
Price ran a fakeout above resistance → liquidity grab before snapping back inside the channel.
Support held at mid‑channel demand, but momentum is fading.
RSI flashing bearish divergence (higher highs in price vs. lower highs in RSI).
Volume spike on the fakeout shows exhaustion at the top.
Watching for a trend re‑test rejection → potential short setup with clean R/R.
⚠️ Key Levels:
Resistance: $3855 – $3870 zone (fakeout area)
Support: $3793 demand zone
Break below = opens path to deeper pullback
🎯 Trade Idea:
If price rejects resistance again → short bias with stops above liquidity sweep highs.
If bulls reclaim and hold above resistance → invalidates short, flips bias back long.
Stay sharp - TVC:GOLD is setting up for a decisive move

I am pessimistic about gold.After raising the ATH indicator value to around 3800, the gold price began to experience a correction, dropping as low as 3717 USD.
The decline from the high point is of an adjustment nature rather than a sudden drop, which enables the overall bullish structure to remain unchanged.
The key question at present is: Has the gold price correction ended, or will we experience another decline before the market resumes its upward trend?
Why I am inclined to believe in the continuation of the bullish trend:
• The 3700 point area is regarded as a strong support area, and it is expected that buyers will hold on to it.
• The momentum indicator shows that the bearish pressure has weakened, which is consistent with the adjustment trend.
• The broader trend still shows a strong bullish trend and there is no downward structural break.
If the 3700 point can be maintained, then if a reversal occurs from the current price level, it is likely to reach the 3800 point area again and possibly set a new higher high.
Trading plan:
The target at 3700 is for a buy. The current market is unclear, and I don't want everyone to blindly follow the trend. Let's keep the retail investors clear-headed.
I believe that many of my friends who have been following me have made money in this gold rally. However, some new friends may have their orders blocked or their accounts emptied due to a significant fluctuation! This market is like this: it can bring wealth, but it can also bring disasters! So, if your account is emptied, don't lose heart. I can assure you that everyone who entered this market has experienced this situation, and I haven't! Life needs some failures to become better. The candlestick of this gold trend is like every upward trend, it will go through a bottom formation process

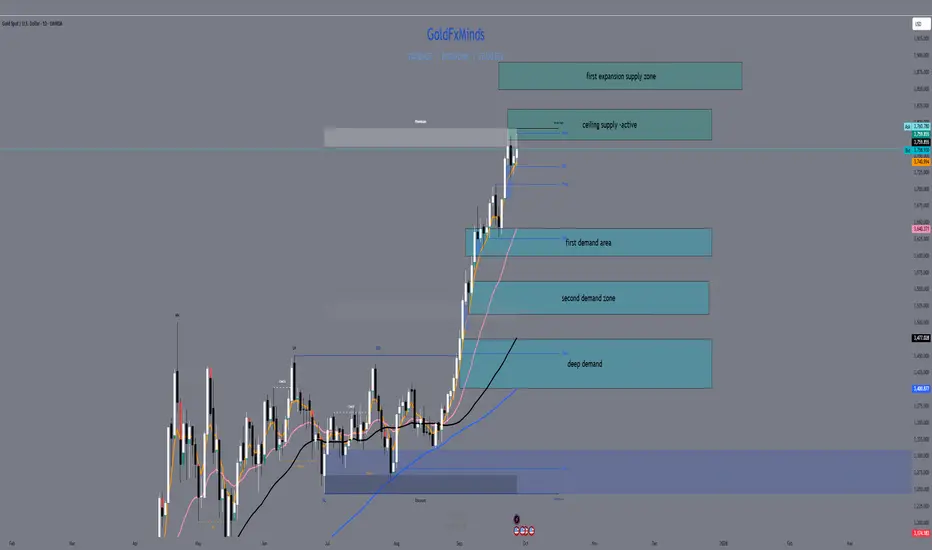
D1 Outlook-3760 at the Ceiling: Gold’s Daily Map for the Week👋 Hello traders — welcome to this week’s GoldFxMinds daily outlook.
The daily chart has been relentless: gold rallied vertically through September, leaving imbalance trails below and now stalling at the 3760 round number inside premium supply. Every candle in the past two weeks has told the same story — buyers in control, but overstretched, pressing at resistance. This week, the daily flow sets the battlefield: breakout into expansions above, or long-overdue retrace into demand below.
🌍 Macro & News Context
This week’s fundamentals are aligned with the Daily chart map:
Midweek OPEC & ADP → possible volatility spikes mid-range.
Friday’s NFP → the decisive trigger for whether daily candles close above supply or reject into demand.
Macro fuel + stretched structure = tactical week ahead.
📊 Daily Bias: Bearish–Neutral
The Daily structure is bullish but overextended. Price is sitting inside supply, RSI is diverging, and EMAs are stretched. Unless 3820 breaks decisively, the map favors retracement into demand zones below.
🗺️ Structural Map for the Week (D1)
Above (Supply / Expansion):
🟥 Premium Rejection Zone (3775–3820) – current ceiling where price is stalling.
🟥 First Expansion Zone (3850–3890) – nearest continuation pocket if 3820 breaks.
Below (Demand):
🟦 First Daily Demand (3640–3600) – origin OB of last impulse, first defense.
🟦 Second Daily Demand (3560–3510) – consolidation block, mid-level defense.
🟢 Bullish Scenario (This Week)
Break and close above 3820 → continuation into 3850–3890.
Strong momentum → test 3895–3945, with extreme case toward 4010+.
🔴 Bearish Scenario (This Week)
Rejection from 3775–3820 → pullback into 3640–3600.
If broken → continuation into 3560–3510, deeper into 3485–3440.
📝 Weekly Recap (via D1)
Story: gold is at its daily ceiling, overstretched and vulnerable.
Bias: Bearish–Neutral unless 3820 breaks.
Above: expansions at 3850–3890, 3895–3945.
Below: demand map at 3640, 3560, 3485.
Catalyst: NFP will decide whether the week closes on breakout or retrace.
✨ Closing Line:
Gold’s daily map shows the full week ahead: 3760 is the decision point. Break above 3820 and bulls unlock 3890; reject here and sellers aim for 3640 then 3560.
Follow, like and comment to stay aligned with GoldFxMinds weekly precision maps 🚀
GOLD 1H CHART ROUTE MAP UPDATEHey Everyone,
A Piptastic start to the week with our chart idea playing out exactly how we analysed.
We started today with our Bullish target 3692 HIT, followed with ema5 cross and lock opening 3717. This was also hit perfectly with a further cross and lock above 3717 also opening 3742. This target remains open.
We will need a test and cross and lock above this level for a continuation or failure to lock will see rejection Into lower Goldturns for support and bounce inline with our plans to buy dips
We will keep the above in mind when taking buys from dips. Our updated levels and weighted levels will allow us to track the movement down and then catch bounces up.
We will continue to buy dips using our support levels taking 20 to 40 pips. As stated before each of our level structures give 20 to 40 pip bounces, which is enough for a nice entry and exit. If you back test the levels we shared every week for the past 24 months, you can see how effectively they were used to trade with or against short/mid term swings and trends.
The swing range give bigger bounces then our weighted levels that's the difference between weighted levels and swing ranges.
BULLISH TARGET
3692 - DONE
EMA5 CROSS AND LOCK ABOVE 3692 WILL OPEN THE FOLLOWING BULLISH TARGETS
3717 - DONE
EMA5 CROSS AND LOCK ABOVE 3717 WILL OPEN THE FOLLOWING BULLISH TARGET
3742
EMA5 CROSS AND LOCK ABOVE 3742 WILL OPEN THE FOLLOWING BULLISH TARGET
3768
BEARISH TARGETS
3673
EMA5 CROSS AND LOCK BELOW 3673 WILL OPEN THE FOLLOWING BEARISH TARGET
3650
EMA5 CROSS AND LOCK BELOW 3650 WILL OPEN THE SWING RANGE
3622
3592
EMA5 CROSS AND LOCK BELOW 3592 WILL OPEN THESECONDARY SWING RANGE
3556
3528
As always, we will keep you all updated with regular updates throughout the week and how we manage the active ideas and setups. Thank you all for your likes, comments and follows, we really appreciate it!
Mr Gold
GoldViewFX

Lingrid | GOLD Potential Pullback from 3700 Psychological LevelOANDA:XAUUSD faced rejection at the 3,700 resistance zone, signaling exhaustion in the recent bullish leg. The divergence at the highs supports a potential reversal, with price already slipping back toward the mid-range of the upward channel. If momentum continues lower, a breakdown under 3,635 could open the way toward 3,570 as the next key support. Sellers remain favored while price trades below 3,700, keeping the bias tilted downward.
⚠️ Risks:
A sudden risk-off move or geopolitical tension could revive safe-haven demand for gold.
Any dovish Fed shift or weaker US data may fuel a breakout above 3,700 instead.
Strong ETF inflows or central bank demand could limit downside pressure.
If this idea resonates with you or you have your own opinion, traders, hit the comments. I’m excited to read your thoughts!

Gold Price sustained bullish momentum with Higher RangeGold has been showing sustained bullish momentum recently, holding above key moving averages and forming a series of higher highs and higher lows — a classic sign of strength. Momentum indicators (like RSI and MACD) are also leaning bullish, though slightly overbought, hinting at a possible short-term consolidation before another leg higher.
If price breaks and holds above 3755 (local resistance), it confirms the continuation of the bullish structure. and price could led to Top resistance side and there possible target will be 3791 if the price will break the 3800 level and Jump to at 3810.
You may find more details in the chart.
Trade wisely best of Luck.
Ps; Support with like and comments for better analysis Thanks for Supporting.

Gold at Fib Wall: Breakout or Reversal?Hello traders! TVC:GOLD has been climbing steadily within a well-defined ascending channel, with every correction fueling new bullish breakouts. Price action remains strong above the 200 SMA, keeping buyers in control of the broader trend...... but for how long?
Currently, FOREXCOM:XAUUSD is testing a critical confluence: the 1.272 fib extension (~3810) and the supply zone at 3826–3837 , which also aligns with the channel’s upper boundary and the 1.618 fib resistance. This area has historically acted as a turning point🔻, and with RSI stretched into overbought territory and showing negative divergence, the probability of a near-term rejection or pullback is high. Should sellers step in, demand levels to watch lie at 3775, 3734, and 3720–3680.
Path A: Reversal from the 1.272 fib (~3810) → shallow pullback
Path B: Reversal from the 1.618 fib (~3837) → deeper correction
IF buyers manage to break and sustain above 3837 , momentum could accelerate toward 3900–3950 . Until then, the current zone remains a high-risk area for late buyers , with a strong retracement or sideways consolidation more likely in the short term. Risk management is key here - the trend is strong, but the market is pressing against its limits.
📌 Key Levels
Immediate Resistance: 3810 (Fib 1.272), 3820–3837 (Fib 1.618 + supply + channel top)
Next Resistance if Breaks: 3900–3950
Supports Below:
3775 (Fib 0.786 + demand)
3734 (Fib 0.236 + demand)
3720–3680 (major demand & support)
⚖️ Scenarios
🟢 Bullish: Break & hold above 3837 → continuation toward 3900–3950
🔴 Bearish (Higher Probability): Rejection at current zone → pullback into 3775 / 3734 / 3720–3680 before next move

Gold price increase - towards 3825⭐️GOLDEN INFORMATION:
Gold (XAU/USD) hovers near $3,800 in Monday’s Asian session, supported by in-line US inflation data that reinforced expectations of further Fed rate cuts this year. Geopolitical uncertainty also underpins safe-haven demand, though upcoming remarks from several Fed officials could sway the Dollar and limit gains for bullion.
⭐️Personal comments NOVA:
continue to rise - above 3790 and hit 3825 resistance today
⭐️SET UP GOLD PRICE:
🔥SELL GOLD zone: 3825- 3827 SL 3832
TP1: $3817
TP2: $3808
TP3: $3792
🔥BUY GOLD zone: $3759-$3757 SL $3752
TP1: $3770
TP2: $3780
TP3: $3790
⭐️Technical analysis:
Based on technical indicators EMA 34, EMA89 and support resistance areas to set up a reasonable BUY order.
⭐️NOTE:
Note: Nova wishes traders to manage their capital well
- take the number of lots that match your capital
- Takeprofit equal to 4-6% of capital account
- Stoplose equal to 2-3% of capital account

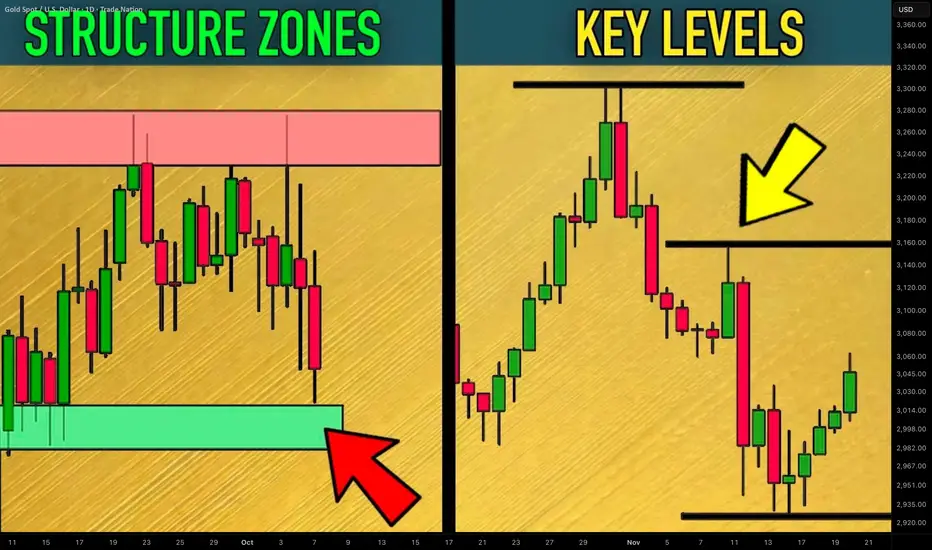
How to Find Key Levels and Support/Resistance Zones Gold XAUUSD
Key levels and support/resistance zones are 2 essential concepts for profitable trading Gold.
In this article, I will share with you a simple and a proven way to find levels and supply/demand clusters on XAUUSD chart.
I will provide a complete guide with examples.
Always start levels/zones analysis on Gold with key levels identification.
Simply put, a key level is a completion point of a strong bullish or bearish movement.
It is the highest high of a bullish wave and the lowest low of a bearish wave.
Let's take a price action on Gold for the last month and let's try to identify key levels.
Analyzing peeks and bottoms of significant price movements, I managed to quickly find a bunch of important key levels.
The ones that are below current spot prices will be called key support levels, while the ones that are above current prices will be called key resistance levels.
What many traders miss, analyzing key levels, is that every key level will always be a part of support/resistance zones.
Candle closes of highs and lows of important price movement will also be important levels.
I underlined all such levels on our Gold chart.
These levels and highs/lows of the impulses will compose supply and demand zones.
That is how these zones look.
The areas that are based on key supports will be called demand zones.
The areas that are based on key resistances will be called supply zones.
The logic is that a high volume of selling orders will be distributed within supply clusters.
Probabilities will be high that a bearish reaction will follow after a test of such a zone.
Demand zones will accumulate buying orders and buying activity.
With a high probability, Gold price will bounce from such zones.
Levels and zones analysis will provide you with a map for trading Gold.
Use that as a map that 95% of retail traders will not see.
It will help you find profitable trades.
❤️Please, support my work with like, thank you!❤️
I am part of Trade Nation's Influencer program and receive a monthly fee for using their TradingView charts in my analysis.
Gold Price Analysis: Liquidity Redistribution in PlayThe current correction phase is unfolding as part of the broader cycle, where price is retracing into areas of liquidity to rebalance market flow. This is not necessarily weakness, but a redistribution process that allows the market to set up for its next decisive move.
Following the recent rally, price entered a period of consolidation before breaking higher again, showing that buyers remain active. The ongoing return toward previously untested zones reflects how institutional flow realigns, creating space for renewed expansion.
If bullish intent continues, gold could extend toward higher levels after short pauses, with volatility remaining a key factor. The structure highlights that retracements are being used as preparation for continuation rather than reversal.
