GOLD MARKET ANALYSIS AND COMMENTARY - [Sep 29 - Oct 03]This week, after opening at $3,683/oz, OANDA:XAUUSD prices jumped to $3,791/oz after NATO forces intercepted three Russian MiG-31 fighter jets when they violated Estonian airspace, causing investors to worry about an escalation of the NATO-Russia conflict. However, after that, Fed Chairman Jerome Powell's cautious tone about further interest rate cuts, along with the US GDP data in the second quarter soaring to 3.8%, pushed gold prices down to $3,717/oz. Gold prices then recovered and closed the week at $3,760/oz.
Next week, the US will announce the non-farm payroll (NFP) figures for September, which are expected to reach 51,000 jobs, much higher than the 22,000 jobs in August. The recovery in NFP figures compared to the previous period is also natural when the US economy still maintains its growth momentum.
However, according to many experts, the September NFP may only be around the expected level, and it is unlikely to exceed the expected level of 51,000 jobs, because US businesses are still facing difficulties due to tariffs and have not expanded their recruitment activities this month. If the NFP is only below 51,000 jobs, this will still be a concern for the FED, forcing the agency to consider further interest rate cuts, supporting the gold price next week to move closer to 3,800 USD/oz, or even exceed this level.
📌In terms of technical analysis, the average price calculated for the D1 chart corresponds to 3,425-3,450 USD/oz. Since breaking through the peak of 3,500 USD/oz, the gold price has increased by approximately 300 USD. Technical indicators signal an overbought state, but the gold price has not shown any signs of a correction. The next resistance zones are based on round resistance levels such as 3,800-4,000 USD/oz. In the near future, if the gold price continues to increase, it may touch around 3,800-3,850 USD/oz. In case of a correction, the price will return to around 3,650 USD/oz.
Notable technical levels are listed below.
• Key support: ~3,720–3,738 USD/oz (near support/lower consolidation band); stronger support around 3,629–3,630 (previous bottom).
• Technical resistance/target: immediate resistance ~3,791 USD (recent top). Fibonacci targets if broken: 3,825 (0.5) → 3,872 (0.618) → 3,938 (0.786) → extension to ~4,022 (extension).
SELL XAUUSD PRICE 3824 - 3822⚡️
↠↠ Stop Loss 3828
BUY XAUUSD PRICE 3659 - 3661⚡️
↠↠ Stop Loss 3655
GOLDCFD trade ideas

Gold cycle analysis. 30/Sept/2025 Gold parabolic rocket launching was much difficulty to catch then falling knife. Gold medium cycle Number 15 probably Only will be due by last week of Oct 2025. at around 3500 a fibo 0.618 plus multi trendline confluence zone which "matched" tradingview Mod idea as well. A daily pin bar could be formed again on today closed daily bar.

Gold vs The Stock Markets.Gold vs The Stock Markets.
Phase A is in play.
History says Phase B comes next.
Another bull era for gold, silver, oil & friends is setting up.

GOLD massive dump ahead nooow!!!As you can see price and daily candle may get like reject candle soon with big shadow and if today close red then price can easily dump and see correction to the target like 3500$ 3700$ and that is what i expect before 4000$.
DISCLAIMER: ((trade based on your own decision))
<<press like👍 if you enjoy💚

Possible GOLD XAUUSD BUY TRADE SETUPLook forward to go with the buyers since they are still in control.
My first attempt LONG from a 1minute TF

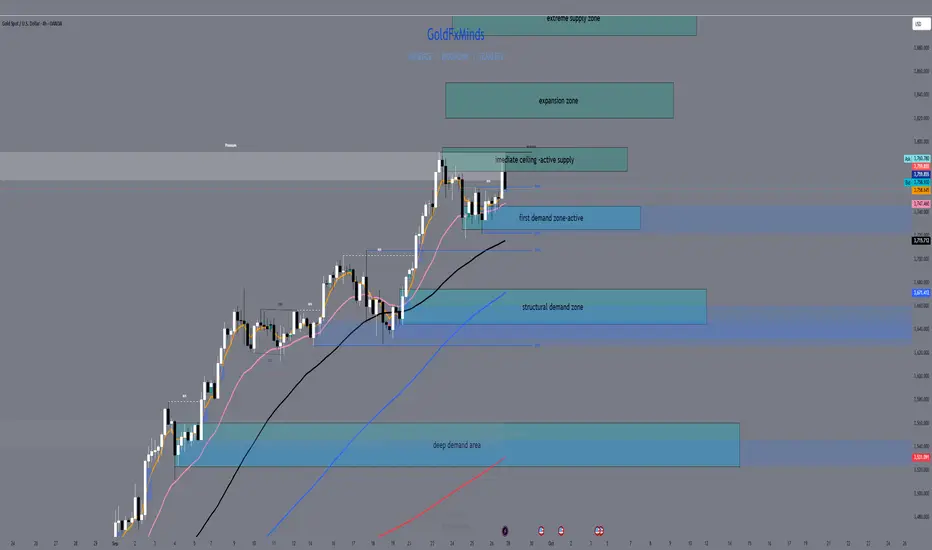
H4 Map at the Ceiling: Expansion or Retrace?👋 Hello traders — welcome to the GoldFxMinds H4 outlook.
Gold has been climbing with relentless force, but now, at the 3760 round number, momentum is colliding with resistance. Candles are pressing into premium supply — where rallies often slow down, traps appear, and liquidity games unfold. Bulls are stretched, sellers are watching, and the next sessions will decide whether price extends higher or folds into retracement.
🔹 H4 Structure Flow
The trend is still bullish — higher highs, higher lows — but the legs are getting heavy. EMAs are stretched far below, RSI is diverging, and imbalances remain unfilled. This is the kind of flow where gold either makes one last push into expansion, or gives way to a tactical correction.
🗺️ The Tactical Map (H4 Zones)
Above (Supply / Expansion):
🟥 Immediate H4 Supply (3775–3795) – active ceiling now.
🟥 First Expansion Zone (3820–3850) – unlocked if 3795 breaks.
🟥 Extreme Expansion (3890–3920) – only if momentum keeps exploding.
Below (Demand):
🟦 First H4 Demand (3745–3725) – shallow block under price, first defense.
🟦 Second H4 Demand (3675–3645) – stronger shelf with EMA confluence.
🟦 Third H4 Demand (3560–3520) – deeper base, final 4H defense before daily demand zones.
🔹 Scenarios for the Next 1–3 Sessions
📉 Bearish Play (favored if ceiling holds):
Rejection from 3775–3795 drags gold back into 3745–3725. A break here exposes 3675–3645 as the next magnet.
📈 Bullish Play (requires breakout):
Clean close above 3795 opens the path into 3820–3850. With sustained momentum, extreme expansion can carry price toward 3890–3920.
📝 H4 Recap
Flow: bullish but stretched, testing premium ceiling.
Bias: Neutral-to-bearish under 3795.
Above: 3775–3795 / 3820–3850 / 3890–3920.
Below: 3745–3725 / 3675–3645 / 3560–3520.
Trigger: the reaction at 3775–3795 will shape the next 3 sessions.
✨ Closing Line:
Gold’s 4H map is at the ceiling: breakout unlocks 3850+, rejection drags price back into 3745 then 3675.
Precision matters here — follow, like and comment to stay aligned with GoldFxMinds tactical maps 🚀
DeGRAM | GOLD above the demand zone📊 Technical Analysis
● XAU/USD rebounded from the demand zone and broke above the descending resistance line, confirming bullish intent.
● Price is consolidating near 3,748, with targets at 3,758 and 3,771, while support remains firm at 3,735.
💡 Fundamental Analysis
● Gold is supported by weaker U.S. Treasury yields and renewed safe-haven demand amid global economic concerns, boosting short-term upside potential.
✨ Summary
XAU/USD has broken resistance from the falling structure, eyeing 3,758–3,771 while holding support at 3,735. Upside momentum strengthens with safe-haven flows.
-------------------
Share your opinion in the comments and support the idea with a like. Thanks for your support!

Is This the Start of Gold’s Next Major Upside Trend?✨ GOLD vs USD Market Wealth Strategy Map (Swing Trade) ✨
🟡 Asset: XAU/USD (Gold vs U.S. Dollar)
📈 Plan: Bullish Outlook
The Thief Strategy 🥷 is in action — using a layering style of limit orders (multiple staged entries). Instead of a single "all-in" shot, we scale in like a smart thief sneaking layer by layer.
🔑 Entry (Layered Style):
Possible levels: 3720 / 3730 / 3740 / 3750 (you can increase layers depending on your own plan).
The idea: Build positions gradually instead of chasing the candle.
🔒 Stop-Loss Zone (Protect Capital):
3680 (nicknamed the “Thief SL” 🚨).
⚠️ Note: This is just my reference level. Please adjust to your own risk style — don’t just follow blindly.
🎯 Target (Profit-Taking Zone):
3860 (Trend Flip Alert ⚡ – High Voltage Zone).
Why? This area aligns with resistance + potential overbought conditions + trap vibes. That’s where I expect smart thieves to escape with their bags 💼.
💡 Reminder for the Thief OGs: I’m not recommending you copy my SL/TP blindly. The market is your playground — grab your profits your way, manage your risk your way.
🔎 Related Pairs to Watch (Correlation Radar)
TVC:DXY (U.S. Dollar Index) → Strong inverse correlation with Gold. If DXY weakens, XAU/USD often rallies.
TVC:SILVER (XAG/USD) → Precious metals move in packs. Silver strength can be a leading indicator for Gold.
BLACKBULL:WTI (USOIL/USD) → Energy inflation links can push Gold higher as a safe haven.
SP:SPX (S&P 500 Index) → Risk-on/off sentiment. Equity weakness often boosts safe-haven demand for Gold.
📌 Key Takeaways:
Thief Strategy = Layered limit order entries (smart scaling).
🚨 Protect your capital with personalized SL — don’t just copy mine.
⚡ Watch for resistance traps near 3860.
📊 Always monitor correlated assets like DXY, Silver, Oil, S&P 500.
✨ “If you find value in my analysis, a 👍 and 🚀 boost is much appreciated — it helps me share more setups with the community!”
📜 Disclaimer: This is a Thief Style Strategy shared just for fun & educational vibes. Not financial advice. Trade responsibly and manage your own risk.
#XAUUSD #GOLD #SwingTrading #TradingStrategy #LayeringStrategy #ThiefStyle #Forex #Commodities #TradingView

GOLD – PREMIUM UPDATE | Record Highs on Shutdown RiskGOLD – PREMIUM UPDATE | Record Highs on Shutdown Risk
Gold surged to a fresh record as safe-haven flows intensified after the U.S. government shutdown.
The deadlock in Washington raises the risk of delayed NFP data, while weak labor signals have already strengthened rate-cut expectations.
Today’s ADP report will be the key catalyst for the next move.
📉 Bearish Setup
Path: While trading below the 3,885 pivot, gold remains vulnerable to retests of 3,869 → 3,859 → 3,844.
Trigger: A confirmed 15M/1H close below 3,869 would reinforce bearish continuation.
Catalyst: Stronger ADP data would favor USD strength and pressure gold lower.
📈 Bullish Setup
Path: Stabilization above 3,870 keeps momentum supported, but a break above 3,893 is needed for continuation.
Targets: 3,914 → 3,934, with potential extension toward 3,950.
Trigger: Softer ADP data would fuel upside and strengthen safe-haven demand.
🔑 Key Levels
Pivot: 3,885
Resistance: 3,893 – 3,914 – 3,934 – 3,950
Support: 3,869 – 3,859 – 3,844
📝 Trading Plan
✅ Sell Setup: Shorts valid while below 3,885, targeting 3,869 / 3,859 / 3,844.
✅ Buy Setup: Long entries favored only after a confirmed break above 3,893, aiming for 3,914 / 3,934.
⚠️ Risk: High volatility expected around ADP and shutdown headlines—wait for candle confirmations before entering.
📌 Premium Takeaway
Gold remains bullish on higher timeframes, but intraday bias stays bearish below 3,885 with downside tests toward 3,869–3,844.
Upside continuation requires a break above 3,893, likely supported by a softer ADP print.

New ATH Above 3800 & FOMO Buying Still Driving the MarketXAUUSD – Daily Plan| MMFLOW TRADING
📊 Market Context
Gold has once again set a new all-time high above 3800 USD/oz, showing no signs of losing bullish momentum. The surge is fueled by strong FOMO buying flows, as traders continue to pile into safe-haven assets.
Concerns about a possible US government shutdown and renewed discussions around tariff policies have weighed on the dollar, while expectations of upcoming Fed rate cuts keep gold supported. Meanwhile, Fed speeches and incoming US data remain key drivers that could inject short-term volatility, but the broader bullish narrative remains intact.
🔎 Technical Analysis (H1/H4)
Price is firmly holding above the 3800 psychological level, confirming the breakout.
Buy zones remain intact at 3790–3792 and 3784–3782, with solid demand expected on any dip.
Sell liquidity sits around 3823–3825, where short-term profit-taking or traps may emerge before the next leg higher.
🔑 Key Levels
Resistance / Sell Zone: 3823–3825
Support / Buy Zones: 3790–3792, 3784–3782
📈 Scenarios & Trading Plan
BUY ZONE 1: 3790–3792
SL: 3786
TP: 3795 - 3800 - 3810 - 3820 - 3830 - ???
BUY ZONE 2: 3784–3782
SL: 3778
TP: 3790 - 3795 - 3800 - 3810 - 3820 - 3830 - 3840 - ???
SELL ZONE (Liquidity Trap Zone): 3823–3825
SL: 3830
TP: 3818 - 3814 - 3810 - 3805 - 3800 - ???
⚠️ Risk Notes
Beware of liquidity sweeps near 3823–3825 before continuation higher.
Fed comments and macro data may cause sudden spikes — adjust risk accordingly.
Stick to confirmation entries around zones to avoid being trapped by false moves.
✅ Summary
Gold is riding strong FOMO-driven bullish momentum, printing new highs above 3800. Main bias: buy on dips at 3790–3782, while monitoring short-term sell liquidity at 3823–3825 for potential pullbacks. The broader trend remains bullish, so patience and disciplined entries will be key.
📢 Follow MMFLOW TRADING for live updates, liquidity insights, and high-probability setups!

Excellent re-Buy orders on GoldAs discussed throughout my yesterday's session commentary: 'My position: I have made excellent Profits on Gold Buying #3,801.80 firstly towards #3,812.80, then when #3,810.80 established decent Support zone, Bought Gold aggressively towards #3,827.80 extension. Unfortunately, I have closed most of my Buys there however Profit was excellent since I Traded with 200 Lot's. Well done for all who followed my Buying calls, well done!
Gold is on the way to test my #4,000.80 benchmark for the fractal.'
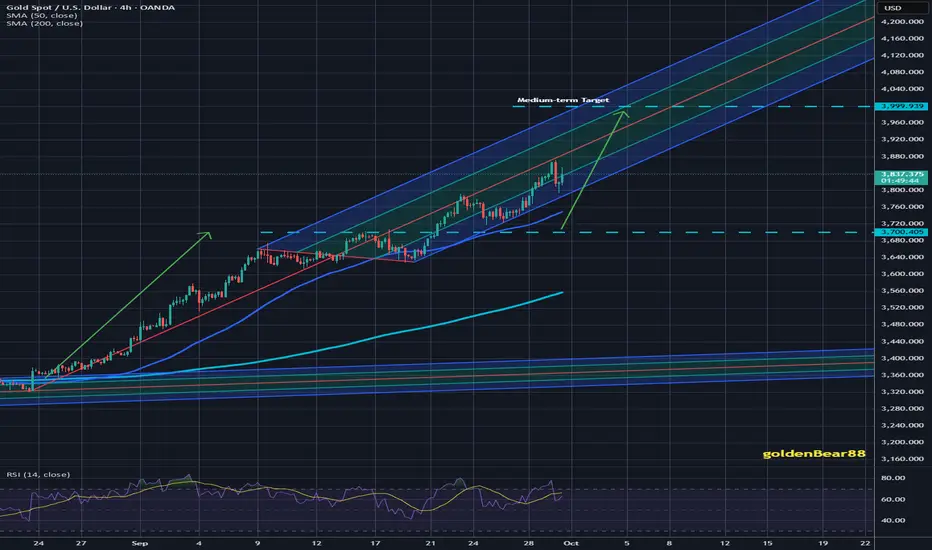
I have closed my orders on #3,827.80 however engaged another set Buying orders last night with no Take Profit and manually closed all my orders on #3,886.80 few moments ago. This is indeed real delight for all Traders to participate on Bull trend, booking excellent Profits on the way up towards my #4,000.80 benchmark Medium-term Target.
My position: I do believe however that Gold is set for small pullback then another wave to the upside. I assume no new orders for now.

XAUUSD: Seeking new highsOANDA:XAUUSD has rebounded sharply back to the prior highs after a correction from 3871 to 3795. With no clear loss of upside momentum, this looks like a classic shakeout before another push higher. For today’s session, the plan is to keep looking for longs , with a primary objective at 3915.
You can read my previous analysis here:
Price is currently meeting resistance at with notable selling pressure, a dip into support may precede the next leg up.
The 3915 area is a logical upside magnet, where CME participants reportedly hold sizeable long-call exposure—a level price may aim to tag.
Key resistance: .
Key support: , .
Trading Plan
Buy setup: Look for Quantum Vol-Delta confirmation of buying pressure on lower timeframes (5m) as price pulls back into .
Contingency: Watch 3836 (POC session/daily liquidity) . Price may sweep this level and rebound.
Please like and comment below to support our traders. Your reactions motivate us to produce more analysis in the future 🙏✨
Victor Dan @ ZuperView

Continuous Profits on Bull runAs discussed throughout my morning's commentary 'As discussed throughout my yesterday's session commentary: 'My position: I am Buying Gold as planned on each reversal and local Low's test as I Bought #3,763.80 and #3,765.80 / kept it over-night and my #3,800.80 Target is hit and orders closed automatically. I have Bought minutes ago on #3,813.80 and currently holding my Buying orders / #3,827.80 test.'
I have booked excellent Profits on yesterday's Buying sequence on Gold Buying Gold multiple times as stated above and altering my orders on #3,827.80 extension.
My position: However Gold extended the upside extension towards #3,870's and since most Buyers got trapped and most of them liquidated, they didn't pay attention to end of the Month (this is last session of the Month) and possible Profit taking from Investors. I missed current Selling decline as it was delivered mostly on Asian session however I will turn to Buying now as Gold is ready for new upswing and #4,000.80 benchmark extension, maintaining it as my Medium-term Target. Gold's Short-term Bullish trend is negated if Gold closes the session below #3,800.80 mark.
My position: I have made excellent Profits on Gold Buying #3,801.80 firstly towards #3,812.80, then when #3,810.80 established decent Support zone, Bought Gold aggressively towards #3,827.80 extension. Unfortunately, I have closed most of my Buys there however Profit was excellent since I Traded with 200 Lot's. Well done for all who followed my Buying calls, well done!
Gold is on the way to test my #4,000.80 benchmark for the fractal.
Gold Bulls at Altitude – Will Unemployment Dislodge Them?The Air Is Thin at the Top
Gold has been marching higher with discipline, each leg calculated, each pullback shallow. But now price is stalling in a tight premium zone — just as the market eyes fresh macro data.
With US Unemployment Claims set to drop tomorrow, volatility is back on the table. Will this be a catalyst for the next push… or the pullback bulls have been dodging?
HTF Structural Zones
🟥 Supply Zone (D1–H4): 3887 – 3897
The upper shelf — price tapped it with precision and showed reaction. No breakdown yet, but momentum is clearly slowing. Watch for fade setups if buyers hesitate again.
🟦 Demand Zone (H1–M30): 3840 – 3852
The re-entry base. Dynamic support from EMAs and previous BOS. If tapped, this is where fresh longs could emerge with structure.
⚪ Decision Zone (H1): 3863 – 3873
The battleground. Buyers need to hold this pocket to sustain control. Lose it, and we likely revisit the demand shelf.
Scenarios – Tactical Outlook
🔼 Bullish Play
If 3863–3873 holds and M15 prints bullish BOS, gold could retest 3887–3897 and potentially squeeze above — but confirmation is non-negotiable.
🔽 Bearish Play
Break below 3863 and failure to recover = watch for sell pressure into 3852–3840. If that cracks, deeper cleanup may follow.
Conclusion
Gold is now in a precision zone, not a guessing zone.
Macro catalyst is coming (Unemployment Claims).
Watch how price behaves inside 3863–3873 — control flips here.
✨ Precision isn’t prediction – it’s preparation.
If this map gave you clarity, tap like, drop a comment, and follow GoldFxMinds for premium-level structure every day. 🚀📊

XAUUSD– Market at 3800 Following the Bias of previous AnalysisIn Case Study #9 (26th Sept), we highlighted a standby entry. But market has given Buying signals in range 3730-3745.So we entered
So market have not followed same path, but reacted in our bias direction.
This shows how market sometimes continues without retracements. Market has given already 700 pips plus in our direction bias. Market has sustained above 3752 & 3762.
In our last analysis, we discussed how Gold (XAUUSD) was in a strong bullish wave, with key support zones holding and momentum indicating further upside. We also highlighted that patience and discipline were essential as the market was preparing for a breakout.
🔎 Today’s Scenario (29th Sept Update)
Price continues to respect our mapped zones but lacks strength above confirmation levels.
Upside: Only if 3790 / 3800 sustains, momentum can build toward 3812 → 3833 → 3872+.
Downside: Failure at these levels 3765-3750 opens path toward 3737 → 3710 → 3699 → 3680 zones.
Standby entry: Entered in the zone 3730-3745.
✅ What Happened Since Then:
Our earlier mapped levels and ranges played out accurately – the market has steadily moved upward.
The price has now touched 3800, perfectly aligning with our anticipated trajectory.
Traders who followed with patience could capture a swing rally of more than 350+ points since our last update.
🧠 Expert Guidance / Precautions
Lessons from This Rally:
Discipline > Prediction – Levels were already known; what mattered was the patience to hold.
Emotions vs. Strategy – Many exit early due to fear/greed, but structured planning wins.
Compounding Vision – Even a small lot size can grow significantly if trades are executed with consistency.
SL hit = protection, not failure. Risk control keeps us in the game while traps unfold.
Patterns alone are not enough. Morning Star & Engulfing both failed → context is key.
Flexibility wins. Don’t marry bias; adapt to new confirmations.
Wait for HTF closes. Lower timeframe noise misleads during traps.
Precaution: Avoid aggressive entries on first breakout attempts; let the market prove direction.
Current View & Precautions:
At 3808, the market is at an important psychological zone.
Partial profit booking is wise for short-term traders.
Long-term swing traders should trail stop-losses to lock in gains.
Watch carefully for reversal signals; rallies often invite retracements.
⚠️ This is an educational case study, not financial advice. Trade at your own risk.
#XAUUSD #Gold #TradingCaseStudy #PriceAction #RiskManagement #MultiTimeframeAnalysis #Tradyoga #Yogeshonale

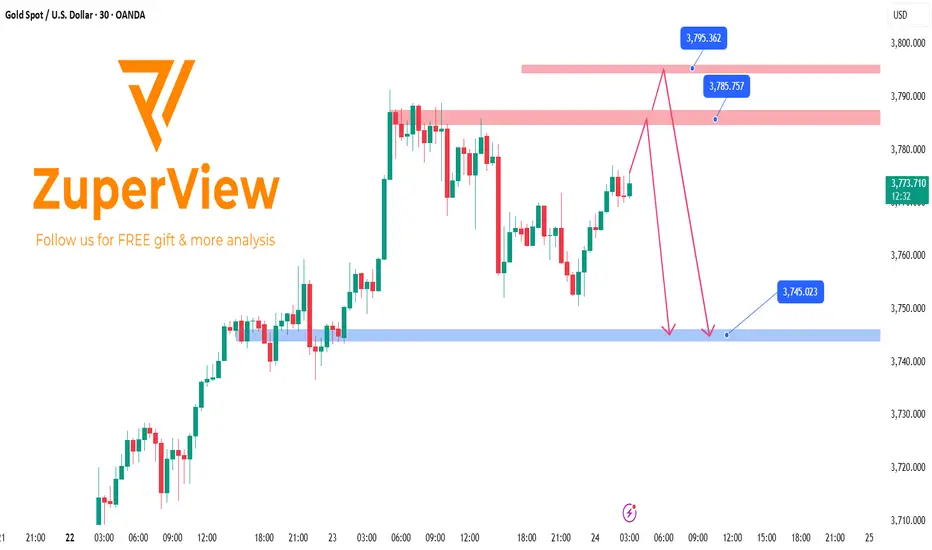
XAUUSD: Could 3790 Be the Top?After the 3740 → 3790 rally, upside momentum has weakened . Therefore, 3790 is likely a temporary top , and a short-term pullback may begin from here. However, we cannot rule out a retest of the top area or even a marginal higher high today before a sharper correction develops.
📉 Analysis
• After the push to 3,790 , price rotated within 3,778–3,788 and then broke the lower bound (3,778) on high volume . This supports the view that a swing high formed at 3,790 . However, price is currently drifting higher on lighter volume , so a retest of the top or even a marginal higher high before the pullback remains possible.
• Resistance zones: 3,784.5–3,787, 3,794–3,796 .
• Key support zones: 3,746–3,744, 3,723–3,718.
📊 Trading Plan
• Wait for reversal signals with heavy volume at the marked support/resistance zones.
• Highest-probability trigger: an 5m engulfing candle with high volume when price taps these levels.
Example: As in ENTRY 1 , if an 5m engulfing candle prints with high volume (as indicated by Superior Volume ) at a marked support/resistance zone, entry on the candle close .
• Entry on the signal and place the stop just above the signal candle (or above the resistance zone ). Move to break-even at +1R .

Stop Hunts: How the Market Tests Your Patience“If the market keeps taking your stop before running in your direction…
You might not be wrong — just too early.”
What is a Stop Hunt?
A Stop Hunt is when price pushes just far enough to trigger stops sitting above a high or below a low — and then reverses.
It’s not random. It’s the market collecting liquidity before the real move begins.
Why Stop Hunts Happen
Stops are easy targets — they’re predictable.
Institutions use them to fill big orders at the best prices.
Your loss is their entry.
How to Spot a Stop Hunt
Mark clear swing highs and lows — obvious levels most traders are watching.
Watch price sweep above/below those levels with a quick move.
Wait. Don’t jump in — the first move is usually a trap.
Drop to a lower timeframe (M1/M5) to get a precise entry confirmation.
Look for structure shift or ChoCH after the sweep.
Only then, consider entering — now you’re trading with the market, not against it.
Example
Refer to the Gold(XAUUSD) M15 chart above:
Notice how price took out the previous swing low with a liquidity grab from the stop area — trapping early buyers — and only then launched into a strong up move.
This is the classic stop hunt behavior that shakes out weak hands before the real trend continues.
Patience turns a losing stop into a winning entry.
The market isn’t against you — it’s just testing who can wait.
📘 Shared by @ChartIsMirror

No Room for SELL, Only BUY with Strong Market Flows📊 Market Context
Talks between Trump and US congressional leaders ended with no clear agreement, leaving the threat of a US government shutdown hanging over the market. Both sides continue to blame each other with no common ground in sight.
On the last trading day of the month, focus shifts to the upcoming JOLTS job openings data and speeches from three Fed officials. Combined with political uncertainty and strong safe-haven flows, gold remains heavily supported. For now, there’s no space for SELL setups — the primary direction is still BUY.
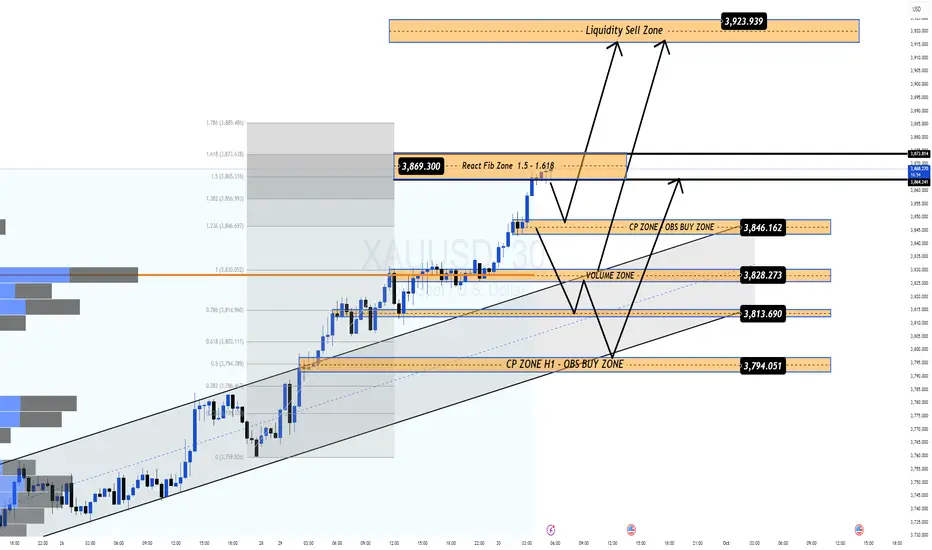
🔎 Technical Analysis (H1/H4)
Price has broken higher, continuing to print fresh ATHs with strong bullish momentum.
Main BUY Zone sits at 3846–3844 (confluence of FIB + CP zone).
Secondary support at 3827–3825 (volume zone) where strong reactions are expected.
If momentum persists, medium-term upside targets lie toward the 3923–3930 liquidity zone.
🔑 Key Technical Levels
BUY Zones: 3846–3844, 3827–3825
SELL Zone (Observation only – potential liquidity trap): 3923–3930
📈 Scenarios & Trading Plan
BUY ZONE 1: 3846–3844
SL: 3840
TP: 3850 - 3855 - 3860 - 3870 - 3880 - ???
BUY ZONE 2: 3827–3825
SL: 3820
TP: 3835 - 3840 - 3850 - 3860 - 3870 - 3880 - ???
⚠️ Risk Notes
Expect volatility with JOLTS data and Fed speeches today.
Avoid FOMO buying at highs — wait for price action confirmation at key zones.
Manage position size carefully as end-of-month trading can bring unexpected swings.
✅ Summary
Gold remains firmly in bullish territory, supported by political risks and macroeconomic uncertainty. Plan of the day: prioritize BUY entries at 3846–3844 and 3827–3825, with extended targets at 3880+ and potentially 3920+. Momentum is strong, and following the BUY side remains the higher-probability path.
📢 Stay tuned with MMFLOW TRADING for real-time updates and BIGWIN setups!
Hack Gold. Win Fast. Inside XAUUSD trading secrets.
⚡ If you just chose Gold to trade, listen up. This market doesn’t forgive.
It’s fast, brutal, violent, yet equally rewarding. But if you don’t know what you are doing, it will chew you up and spit you out before you even finish your first coffee.
Here are 5 Hacks to help you every single day instead of the same Mistakes that keep new traders in losses, frustrated, and blaming “manipulation” instead of fixing their own game:
🔔1. Trading Blind With Zero Knowledge
Everyone wants quick cash, and most traders do not want to study. If you don’t know about liquidity, order blocks, or imbalances, you are just guessing. And Gold punishes guesses.
Copying random signals online won’t save you. You need a system, discipline, and screen time. Period.
🔥HACK 1: Learn the game before you risk the money. Demo, daily chart study & repeat hundreds of times. If you treat this like a casino, you will always leave broke.
✨2. Pretending Risk Management Is Optional
This one kills more accounts than anything else. No stop loss, no take profit, just “I’ll close it when it comes back.” And then the market doesn’t come back. Sometimes ever.
Gold can drop 300 pips in minutes, and if you are sitting unprotected, you will blow up faster than you can blink.
🔥HACK 2: Risk max 0.3 per trade. Place your SL. Place your TP or watch profits like a hawk. And if you don’t know where to place them, you are not ready to trade real money. Find real premium help, not fake flashy plastic scams.
💥3. Loading the Gun With Too Many Trades
Gold moves fast. One wrong click, and if you are stacked with five positions, you are done.
I have seen traders open buys, sells, hedges, all at once, thinking they are “diversified.” No. You are just multiplying risk. A 1% move against you and XAUUSD can wipe your entire account if you are over-leveraged.
🔥 HACK 3: Stick to one clean setup, manage the size, and stop spraying bullets like you are in an arcade game.
🔴4. FOMO Buying Tops (and Selling Bottoms)
Gold hits a new high. Like yesterday. Traders scream “To the moon!” You panic and click Buy. Two minutes later, your drawdown hits rock bottom. Happens all the time.
FOMO is the fastest way to donate your money to smarter traders.
🔥HACK 4: Plan your trades before the price gets there. If you were not ready before the move, you missed it. Accept it. The market is not closing tomorrow or ever.
😡5. Revenge Trading Like a Maniac
You take a loss. Then your brain screams: “I’ll get it back!” So you double the next position. Then triple. Guess what? XAUUSD is so volatile that it will run over your feelings and leave you in depression. You are not getting your money back, just gaining more anxiety and daily stress.
🔥HACK 5: Close the platform. Step away. One good trade tomorrow is worth more than five revenge trades today.
🖊️Homework:
Memorize your hacks, stick them on a post-it by your screen, in your wallet, and read them as many times as needed; learn them like a mantra. Daily.
If this article helped you today and brought you more clarity:
Drop a 🚀 and follow us✅ for more trading ideas and trading psychology. Thank you.

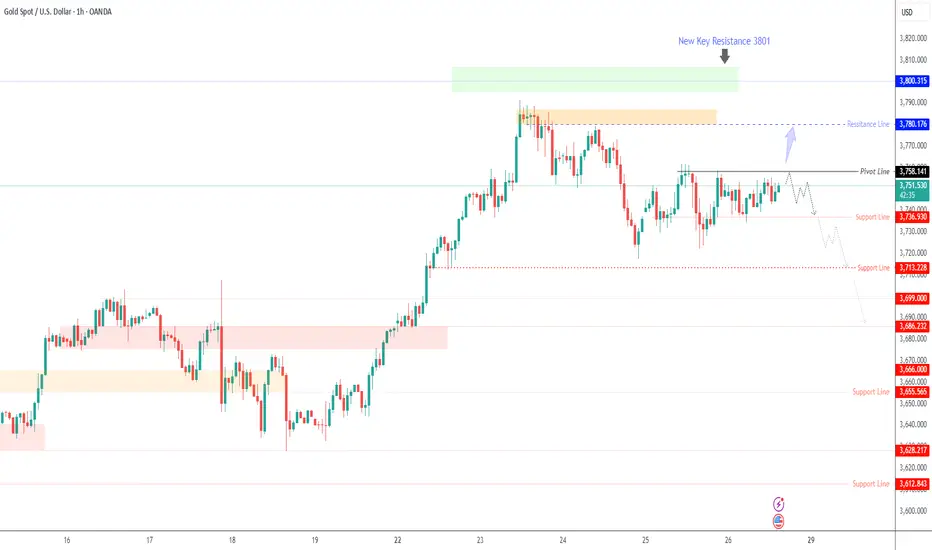
GOLD – Tariffs and PCE Data Keep Bears in Focus Below 3,758GOLD – Overview
Gold prices edged higher in early trade as President Trump’s new tariffs and rising geopolitical tensions over Russian incursions into NATO airspace boosted safe-haven demand.
ETF holdings remain at their highest levels since 2022, while investors await today’s key U.S. PCE inflation data for fresh signals on the Federal Reserve’s rate path.
Stronger U.S. GDP growth and lower jobless claims have slightly eased labor market concerns, adding to market uncertainty ahead of the release.
Technical View
Gold is attempting to stabilize below the 3,758 pivot line, keeping short-term pressure on the downside while awaiting PCE results.
Bearish Scenario:
As long as price trades below 3,758, bearish momentum targets 3,736 → 3,714 → 3,700.
Bullish Scenario:
A confirmed 15-min close above 3,758 would invalidate the bearish setup and support a push toward 3,780 → 3,801.
Key Levels
Pivot: 3,758
Resistance: 3,780 – 3,801
Support: 3,736 – 3,714 – 3,700
Trading Plan:
Gold remains bearish below 3,758, with 3,736 and 3,714 as immediate downside targets.
Today’s PCE data will decide whether price extends toward 3,700 or breaks higher toward 3,780 – 3,801.
GOLD falls slightly, market awaits inflation dataIn the Asian trading session on Friday morning (September 26), spot OANDA:XAUUSD hovered around 3,747 USD/ounce, as if "listening" for important news: the upcoming US PCE inflation data. This is considered an information bomb that can cause the gold market, US Dollar and stocks to shake strongly.
Earlier, on Thursday, gold lost steam when the number of unemployment claims in the US unexpectedly decreased. Specifically, the US Department of Labor reported that the week ending September 20 had only 218,000 applications, lower than the forecast of 235,000 and down 14,000 compared to the previous week. This news reduced the market's expectation that the Federal Reserve (Fed) would quickly cut interest rates.
However, gold prices still closed up 0.36% at $3,749.36/ounce, after rising as much as 0.6%. Also in the week, gold hit a historic peak of $3,790.82/ounce on Tuesday, a figure that made many investors “just sit and watch the chart and sigh with regret, just like AD, reviving when preparing to go to the island”.
According to CME's FedWatch tool, the possibility of the Fed cutting interest rates in October is now priced by the market at 85%, down from 90% before the employment data was released. In other words, the Fed is still holding the knife, just hasn't decided whether to cut the "interest rate" yet.
The US Bureau of Economic Analysis will release its PCE index for August today. Forecasts show PCE rising 2.7% year-on-year, up from 2.6% previously. The core PCE (excluding volatile energy and food prices) is expected to rise 2.9%, the same as in July.
Since this is the Fed’s preferred measure of inflation, any higher-than-expected figure could strengthen the US dollar, sending gold tumbling in the short term.
Gold, by its nature, does not generate interest. It only really shines in a low-interest-rate environment, which investors are hoping the Fed will soon bring.
Analysis of the technical outlook for OANDA:XAUUSD prices
Main Trend
Gold is still in a fairly clear uptrend channel.
The price is fluctuating around 3,739 USD/oz, approaching the midline of the uptrend channel.
Short-term trend: up but with slight corrections.
Important resistance
3,779 USD (Fib 0.382): if broken, gold can quickly test 3,825 - 3,872 USD.
3,938 - 4,022 USD: strong resistance zone, reaching the top of the uptrend channel, easy to take profit.
Important support
3,738 USD (current price).
3,720 USD (Fib 0.236 + nearest MA zone).
3,706 USD: strong support, breaking this zone, there is a risk of returning to test 3,628 USD.
RSI
Still above 60, indicating the market is still biased towards buyers, but showing signs of being a bit “overextended”.
SELL XAUUSD PRICE 3815 - 3813⚡️
↠↠ Stop Loss 3819
→Take Profit 1 3807
↨
→Take Profit 2 3801
BUY XAUUSD PRICE 3682 - 3684⚡️
↠↠ Stop Loss 3678
→Take Profit 1 3690
↨
→Take Profit 2 3696

THE KOG REPORTTHE KOG REPORT
In last week’s KOG Report we would like to see the red box defence hold the price, and if it did we felt an opportunity to long would be available to traders into the red box target levels.
Price did exactly what we wanted and all the red box target levels for the week were completed as well as the Excalibur targets we had in Camelot.
We then released the FOMC KOG Report and shared not only the red boxes but also the hot spots that were active. This suggested a move upside from lower support and then a decline from there into the 3630-40 regions which again worked to the pip and gave us another opportunity not only to short but then to long up to where we closed.
A fantastic week in Camelot with price playing just the way we wanted it to on gold.
So, what can we expect in the week ahead?
For this week we have the key level of 3660-55 support which needs to break for us to go lower in the first half of the week. Above and if that level is supported we see opportunities for the 3710, 3720 and potentially the 3730 regions. Its that 3720-30 level that we want to monitor this week and if attacked, it’s there we feel we may see an opportunity to short the market back into the 3685, 3660 and 3650 level initially.
We’re due a retracement on the bullish move and ideally, we want to see that move this week at some point.
We’re a little to high to go long here in the early sessions, especially with the 3660 level sticking out for a potential swing. So we’ll try and plot the path best we can and keep an eye on the hot spots and the red boxes as well as our trusted friend Excalibur to guide us through the week.
Key levels – 3690 - 3675
RED BOX TARGETS:
Break above 3690 for 3710, 3714 and 3722 in extension of the move
Break below 3670 for 3665, 3655, 3650 and 3643 in extension of the move
We’re going to keep it short this week and as usual, we’ll update traders through the week.
Please do support us by hitting the like button, leaving a comment, and giving us a follow. We’ve been doing this for a long time now providing traders with in-depth free analysis on Gold, so your likes and comments are very much appreciated.
As always, trade safe.
KOG
