Gold Bulls at Altitude – Will Unemployment Dislodge Them?The Air Is Thin at the Top
Gold has been marching higher with discipline, each leg calculated, each pullback shallow. But now price is stalling in a tight premium zone — just as the market eyes fresh macro data.
With US Unemployment Claims set to drop tomorrow, volatility is back on the table. Will this be a catalyst for the next push… or the pullback bulls have been dodging?
HTF Structural Zones
🟥 Supply Zone (D1–H4): 3887 – 3897
The upper shelf — price tapped it with precision and showed reaction. No breakdown yet, but momentum is clearly slowing. Watch for fade setups if buyers hesitate again.
🟦 Demand Zone (H1–M30): 3840 – 3852
The re-entry base. Dynamic support from EMAs and previous BOS. If tapped, this is where fresh longs could emerge with structure.
⚪ Decision Zone (H1): 3863 – 3873
The battleground. Buyers need to hold this pocket to sustain control. Lose it, and we likely revisit the demand shelf.
Scenarios – Tactical Outlook
🔼 Bullish Play
If 3863–3873 holds and M15 prints bullish BOS, gold could retest 3887–3897 and potentially squeeze above — but confirmation is non-negotiable.
🔽 Bearish Play
Break below 3863 and failure to recover = watch for sell pressure into 3852–3840. If that cracks, deeper cleanup may follow.
Conclusion
Gold is now in a precision zone, not a guessing zone.
Macro catalyst is coming (Unemployment Claims).
Watch how price behaves inside 3863–3873 — control flips here.
✨ Precision isn’t prediction – it’s preparation.
If this map gave you clarity, tap like, drop a comment, and follow GoldFxMinds for premium-level structure every day. 🚀📊
GOLDCFD trade ideas

XAUUSD– Market at 3800 Following the Bias of previous AnalysisIn Case Study #9 (26th Sept), we highlighted a standby entry. But market has given Buying signals in range 3730-3745.So we entered
So market have not followed same path, but reacted in our bias direction.
This shows how market sometimes continues without retracements. Market has given already 700 pips plus in our direction bias. Market has sustained above 3752 & 3762.
In our last analysis, we discussed how Gold (XAUUSD) was in a strong bullish wave, with key support zones holding and momentum indicating further upside. We also highlighted that patience and discipline were essential as the market was preparing for a breakout.
🔎 Today’s Scenario (29th Sept Update)
Price continues to respect our mapped zones but lacks strength above confirmation levels.
Upside: Only if 3790 / 3800 sustains, momentum can build toward 3812 → 3833 → 3872+.
Downside: Failure at these levels 3765-3750 opens path toward 3737 → 3710 → 3699 → 3680 zones.
Standby entry: Entered in the zone 3730-3745.
✅ What Happened Since Then:
Our earlier mapped levels and ranges played out accurately – the market has steadily moved upward.
The price has now touched 3800, perfectly aligning with our anticipated trajectory.
Traders who followed with patience could capture a swing rally of more than 350+ points since our last update.
🧠 Expert Guidance / Precautions
Lessons from This Rally:
Discipline > Prediction – Levels were already known; what mattered was the patience to hold.
Emotions vs. Strategy – Many exit early due to fear/greed, but structured planning wins.
Compounding Vision – Even a small lot size can grow significantly if trades are executed with consistency.
SL hit = protection, not failure. Risk control keeps us in the game while traps unfold.
Patterns alone are not enough. Morning Star & Engulfing both failed → context is key.
Flexibility wins. Don’t marry bias; adapt to new confirmations.
Wait for HTF closes. Lower timeframe noise misleads during traps.
Precaution: Avoid aggressive entries on first breakout attempts; let the market prove direction.
Current View & Precautions:
At 3808, the market is at an important psychological zone.
Partial profit booking is wise for short-term traders.
Long-term swing traders should trail stop-losses to lock in gains.
Watch carefully for reversal signals; rallies often invite retracements.
⚠️ This is an educational case study, not financial advice. Trade at your own risk.
#XAUUSD #Gold #TradingCaseStudy #PriceAction #RiskManagement #MultiTimeframeAnalysis #Tradyoga #Yogeshonale


Stop Hunts: How the Market Tests Your Patience“If the market keeps taking your stop before running in your direction…
You might not be wrong — just too early.”
What is a Stop Hunt?
A Stop Hunt is when price pushes just far enough to trigger stops sitting above a high or below a low — and then reverses.
It’s not random. It’s the market collecting liquidity before the real move begins.
Why Stop Hunts Happen
Stops are easy targets — they’re predictable.
Institutions use them to fill big orders at the best prices.
Your loss is their entry.
How to Spot a Stop Hunt
Mark clear swing highs and lows — obvious levels most traders are watching.
Watch price sweep above/below those levels with a quick move.
Wait. Don’t jump in — the first move is usually a trap.
Drop to a lower timeframe (M1/M5) to get a precise entry confirmation.
Look for structure shift or ChoCH after the sweep.
Only then, consider entering — now you’re trading with the market, not against it.
Example
Refer to the Gold(XAUUSD) M15 chart above:
Notice how price took out the previous swing low with a liquidity grab from the stop area — trapping early buyers — and only then launched into a strong up move.
This is the classic stop hunt behavior that shakes out weak hands before the real trend continues.
Patience turns a losing stop into a winning entry.
The market isn’t against you — it’s just testing who can wait.
📘 Shared by @ChartIsMirror

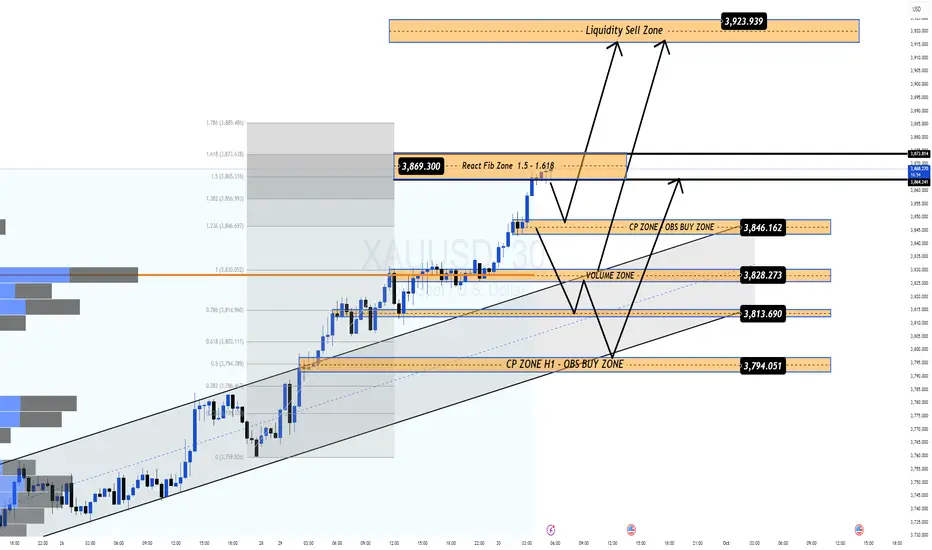
No Room for SELL, Only BUY with Strong Market Flows📊 Market Context
Talks between Trump and US congressional leaders ended with no clear agreement, leaving the threat of a US government shutdown hanging over the market. Both sides continue to blame each other with no common ground in sight.
On the last trading day of the month, focus shifts to the upcoming JOLTS job openings data and speeches from three Fed officials. Combined with political uncertainty and strong safe-haven flows, gold remains heavily supported. For now, there’s no space for SELL setups — the primary direction is still BUY.
🔎 Technical Analysis (H1/H4)
Price has broken higher, continuing to print fresh ATHs with strong bullish momentum.
Main BUY Zone sits at 3846–3844 (confluence of FIB + CP zone).
Secondary support at 3827–3825 (volume zone) where strong reactions are expected.
If momentum persists, medium-term upside targets lie toward the 3923–3930 liquidity zone.
🔑 Key Technical Levels
BUY Zones: 3846–3844, 3827–3825
SELL Zone (Observation only – potential liquidity trap): 3923–3930
📈 Scenarios & Trading Plan
BUY ZONE 1: 3846–3844
SL: 3840
TP: 3850 - 3855 - 3860 - 3870 - 3880 - ???
BUY ZONE 2: 3827–3825
SL: 3820
TP: 3835 - 3840 - 3850 - 3860 - 3870 - 3880 - ???
⚠️ Risk Notes
Expect volatility with JOLTS data and Fed speeches today.
Avoid FOMO buying at highs — wait for price action confirmation at key zones.
Manage position size carefully as end-of-month trading can bring unexpected swings.
✅ Summary
Gold remains firmly in bullish territory, supported by political risks and macroeconomic uncertainty. Plan of the day: prioritize BUY entries at 3846–3844 and 3827–3825, with extended targets at 3880+ and potentially 3920+. Momentum is strong, and following the BUY side remains the higher-probability path.
📢 Stay tuned with MMFLOW TRADING for real-time updates and BIGWIN setups!
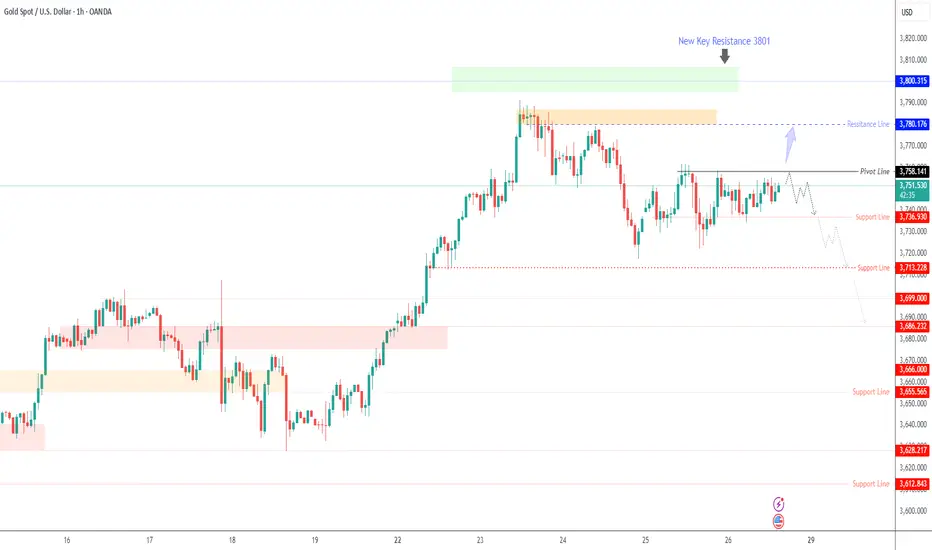
GOLD – Tariffs and PCE Data Keep Bears in Focus Below 3,758GOLD – Overview
Gold prices edged higher in early trade as President Trump’s new tariffs and rising geopolitical tensions over Russian incursions into NATO airspace boosted safe-haven demand.
ETF holdings remain at their highest levels since 2022, while investors await today’s key U.S. PCE inflation data for fresh signals on the Federal Reserve’s rate path.
Stronger U.S. GDP growth and lower jobless claims have slightly eased labor market concerns, adding to market uncertainty ahead of the release.
Technical View
Gold is attempting to stabilize below the 3,758 pivot line, keeping short-term pressure on the downside while awaiting PCE results.
Bearish Scenario:
As long as price trades below 3,758, bearish momentum targets 3,736 → 3,714 → 3,700.
Bullish Scenario:
A confirmed 15-min close above 3,758 would invalidate the bearish setup and support a push toward 3,780 → 3,801.
Key Levels
Pivot: 3,758
Resistance: 3,780 – 3,801
Support: 3,736 – 3,714 – 3,700
Trading Plan:
Gold remains bearish below 3,758, with 3,736 and 3,714 as immediate downside targets.
Today’s PCE data will decide whether price extends toward 3,700 or breaks higher toward 3,780 – 3,801.
GOLD falls slightly, market awaits inflation dataIn the Asian trading session on Friday morning (September 26), spot OANDA:XAUUSD hovered around 3,747 USD/ounce, as if "listening" for important news: the upcoming US PCE inflation data. This is considered an information bomb that can cause the gold market, US Dollar and stocks to shake strongly.
Earlier, on Thursday, gold lost steam when the number of unemployment claims in the US unexpectedly decreased. Specifically, the US Department of Labor reported that the week ending September 20 had only 218,000 applications, lower than the forecast of 235,000 and down 14,000 compared to the previous week. This news reduced the market's expectation that the Federal Reserve (Fed) would quickly cut interest rates.
However, gold prices still closed up 0.36% at $3,749.36/ounce, after rising as much as 0.6%. Also in the week, gold hit a historic peak of $3,790.82/ounce on Tuesday, a figure that made many investors “just sit and watch the chart and sigh with regret, just like AD, reviving when preparing to go to the island”.
According to CME's FedWatch tool, the possibility of the Fed cutting interest rates in October is now priced by the market at 85%, down from 90% before the employment data was released. In other words, the Fed is still holding the knife, just hasn't decided whether to cut the "interest rate" yet.
The US Bureau of Economic Analysis will release its PCE index for August today. Forecasts show PCE rising 2.7% year-on-year, up from 2.6% previously. The core PCE (excluding volatile energy and food prices) is expected to rise 2.9%, the same as in July.
Since this is the Fed’s preferred measure of inflation, any higher-than-expected figure could strengthen the US dollar, sending gold tumbling in the short term.
Gold, by its nature, does not generate interest. It only really shines in a low-interest-rate environment, which investors are hoping the Fed will soon bring.
Analysis of the technical outlook for OANDA:XAUUSD prices
Main Trend
Gold is still in a fairly clear uptrend channel.
The price is fluctuating around 3,739 USD/oz, approaching the midline of the uptrend channel.
Short-term trend: up but with slight corrections.
Important resistance
3,779 USD (Fib 0.382): if broken, gold can quickly test 3,825 - 3,872 USD.
3,938 - 4,022 USD: strong resistance zone, reaching the top of the uptrend channel, easy to take profit.
Important support
3,738 USD (current price).
3,720 USD (Fib 0.236 + nearest MA zone).
3,706 USD: strong support, breaking this zone, there is a risk of returning to test 3,628 USD.
RSI
Still above 60, indicating the market is still biased towards buyers, but showing signs of being a bit “overextended”.
SELL XAUUSD PRICE 3815 - 3813⚡️
↠↠ Stop Loss 3819
→Take Profit 1 3807
↨
→Take Profit 2 3801
BUY XAUUSD PRICE 3682 - 3684⚡️
↠↠ Stop Loss 3678
→Take Profit 1 3690
↨
→Take Profit 2 3696

Gold prices began to correct, 3690⭐️GOLDEN INFORMATION:
Gold (XAU/USD) holds firm near $3,750 in Thursday’s Asian session, supported by expectations of further Fed rate cuts and ongoing geopolitical risks. The Fed’s September 25 bps cut lowered the policy rate to 4.00%–4.25%, with its dot plot signaling two more reductions this year and another in 2026. Lower borrowing costs reduce the opportunity cost of holding Gold, keeping the metal underpinned.
⭐️Personal comments NOVA:
Gold price continued to break the 3750 support and fell sharply afterwards. Gold price started a major correction after the market was too FOMO on the buying side.
⭐️SET UP GOLD PRICE:
🔥SELL GOLD zone: 3788- 3790 SL 3795
TP1: $3780
TP2: $3770
TP3: $3760
🔥BUY GOLD zone: $3691-$3689 SL $3684
TP1: $3700
TP2: $3710
TP3: $3725
⭐️Technical analysis:
Based on technical indicators EMA 34, EMA89 and support resistance areas to set up a reasonable SELL order.
⭐️NOTE:
Note: Nova wishes traders to manage their capital well
- take the number of lots that match your capital
- Takeprofit equal to 4-6% of capital account
- Stoplose equal to 2-3% of capital account

Daily Plan: What’s Next After the All-Time High Correction?📊 Market Context
Gold is struggling to recover from yesterday’s pullback after hitting a record high at 3791 USD/oz. In the Asian session on Thursday, price action remains cautious as traders await U.S. mid-tier data and further speeches from Fed officials for fresh momentum. While the long-term trend remains bullish, the current pause highlights how sensitive gold is to short-term liquidity sweeps and macro catalysts.
🔎 Technical Analysis (H1/H4)
ATH zone sits at 3791, with sellers reacting strongly from that level.
Price is currently trading below the downtrend reaction zone 3755–3757, showing near-term weakness.
Buy-side liquidity remains intact at 3712 and deeper at 3688–3686 (CP + OBS Buy Zone).
Sell-side liquidity zone identified at 3775–3777, likely to attract reactions if retested.
Larger liquidity magnet lies at 3824–3830, but only if bulls regain momentum above 3777.
🔑 Key Levels
Resistance / Sell Zones: 3775–3777 - 3791 - 3824–3830
Support / Buy Zones: 3712 - 3688–3686
📈 Scenarios & Trading Plan
✅ BUY ZONE (Main Setup): 3688–3686
SL: 3680
TP: 3696 - 3700 - 3705 - 3710 - 3720 - 3730 - …
✅ SELL ZONE (Liquidity Reaction): 3775–3777
SL: 3782
TP: 3770 - 3765 - 3760 - 3750 - 3740 - 3730 - …
⚠️ Risk Management Notes
Stay alert for false breakouts around 3775–3777, as price may sweep liquidity before reversing.
Avoid chasing entries mid-range; wait for price action confirmation in the buy/sell zones.
U.S. data and Fed commentary could trigger volatility spikes — adjust risk accordingly.
✅ Summary
Gold is consolidating after its record high at 3791, with traders waiting for new catalysts. The plan today: buy dips at 3688–3686, targeting a recovery towards 3720–3730, while looking for short-term sells at 3775–3777 if rejection occurs. A break above 3777 would re-open the path towards 3824–3830.
📢 Follow MMFLOW TRADING on TradingView for real-time liquidity setups and BIGWIN strategies as gold approaches its next critical levels.

GOLD XAUUSD .GOLD ,going by the price action from our current rally from the 3720-3717 zone which is a strong 1hr demand floor from the line chart perspective.
the rise from 3720-3717 moved on to reclaim 3733-3736 which is setting itself up on 1hr ascending trendline and kept this buying pattern on demand floor of the trendline .
the hight of the day came at 3782-3785 zone as called before and we are seeing it from correction perspective into 3761-3758 demand cross interchange connecting 1hr SR/RS and price closed on 1hr support of 3761-3758.
if we go by rules of break and retest then selling might deep itself into 3745 and last hope on the descending trend touch which will be around 3736 before we give up on buy ideas.
the current 1hr descending trendline will call for retest on the following zones for forward guidance and context.
RESTEST AT 3745
RETEST AT 3736-3739
KEY DEMAND 3720-3717
KEY DEMAND 3694-3690
TRADING IS PROBABILTY .
#GOLD #XAUUSD

Gold could make a move down nowHi traders,
Last week gold did not break the a-wave of the Flat correction, so it became a running Flat. Price went up impulsive for wave 5 (red).
After that it started another correction down.
Next week we could see a move down to finish the correction and after that this pair could go up again.
Let's see what price does and react.
Trade idea: Wait for the correction down to finish and the next impulsive wave up. After a small correction down on a lower timeframe and a change in orderflow to bullish you could trade longs again.
If you want to learn more about trading FVG's & liquidity sweeps with wave analysis, please make sure to follow me.
This shared post is only my point of view on what could be the next move in this pair based on my technical analysis.
Don't be emotional, just trade your plan!
Eduwave

GOLD 1H - flag breakout confirms bullish momentumOn the 1H chart, gold has completed a bullish flag formation and already broken out to the upside. Key retest levels sit at 3748 and 3730, where buyers may confirm control. With EMA50 and EMA200 holding below, structure remains bullish. RSI has cooled off, supporting a potential continuation move.
Fundamentally , dollar weakness and Fed uncertainty sustain safe-haven demand.
Tactical plan: watch for price reaction on a possible retest of 3748–3730, as buyer interest here could launch a push toward 3820–3830.
The breakout has already happened - now gold needs confirmation to extend the rally.

GOLD 1H CHART ROUTE MAP UPDATE & TRADING PLAN FOR THE WEEKHey Everyone,
Please see our updated 1h chart levels and targets for the coming week.
We are seeing price play between two weighted levels with a gap above at 3692 and a gap below at 3673. We will need to see ema5 cross and lock on either weighted level to determine the next range.
We will see levels tested side by side until one of the weighted levels break and lock to confirm direction for the next range.
We will keep the above in mind when taking buys from dips. Our updated levels and weighted levels will allow us to track the movement down and then catch bounces up.
We will continue to buy dips using our support levels taking 20 to 40 pips. As stated before each of our level structures give 20 to 40 pip bounces, which is enough for a nice entry and exit. If you back test the levels we shared every week for the past 24 months, you can see how effectively they were used to trade with or against short/mid term swings and trends.
The swing range give bigger bounces then our weighted levels that's the difference between weighted levels and swing ranges.
BULLISH TARGET
3692
EMA5 CROSS AND LOCK ABOVE 3692 WILL OPEN THE FOLLOWING BULLISH TARGETS
3717
EMA5 CROSS AND LOCK ABOVE 3717 WILL OPEN THE FOLLOWING BULLISH TARGET
3742
EMA5 CROSS AND LOCK ABOVE 3742 WILL OPEN THE FOLLOWING BULLISH TARGET
3768
BEARISH TARGETS
3673
EMA5 CROSS AND LOCK BELOW 3673 WILL OPEN THE FOLLOWING BEARISH TARGET
3650
EMA5 CROSS AND LOCK BELOW 3650 WILL OPEN THE SWING RANGE
3622
3592
EMA5 CROSS AND LOCK BELOW 3592 WILL OPEN THESECONDARY SWING RANGE
3556
3528
As always, we will keep you all updated with regular updates throughout the week and how we manage the active ideas and setups. Thank you all for your likes, comments and follows, we really appreciate it!
Mr Gold
GoldViewFX

Gold rebounds, sideways 3740 – 3755📊 Market Developments
After dropping from 3754 to 3740, gold quickly rebounded and is now trading around 3753. Buyers have stepped in strongly at the support zone, but the overall trend has yet to break out.
📉 Technical Analysis
• Near resistance: 3755 – 3765
• Strong resistance: 3780
• Near support: 3740 – 3735
• Key support: 3700
• Price is fluctuating around the EMA50, showing short-term sideways movement, while the overall trend remains slightly bearish.
📌 Outlook
Gold continues to move within the 3740 – 3755 range. Buying pressure holds the price above 3740, but selling pressure emerges strongly at 3755. A clear breakout is needed to determine the next move.
🎯 Trading Strategy
🔻 SELL XAU/USD : 3762 – 3765
🎯 TP: 40/80/200 pips
🛑 SL: 3768
🔺 BUY XAU/USD : 3695 – 3700
🎯 TP: 40/80/200 pips
🛑 SL: 3692

XAUUSD – 15M Chart | Resistance RejectionGold tested the $3,756 resistance zone and failed to break above, showing repeated rejection at that supply area. Price is now trading below $3,749 minor resistance, signaling bearish pressure.
📉 A short setup is active with:
Entry: 3,749
Stop Loss: 3,752 (above intraday resistance)
Target: 3,733 (previous support zone)
If price breaks below 3,740, bearish continuation toward the target is likely. Any sustained move above 3,756 would invalidate this view.

GoldXAUUSD
- Completed " 1234 " Impulsive Waves
- Break of Structure
- Demand Zone
- Rising Wedge as an corrective pattern in Short Time Frame
- Order Block

XAUUSD — Rebound or Short-Term Downtrend Continuation?Gold just flushed hard into the support zone, reinforcing 3790 as a temporary top. What should we do now?
📉 Analysis
Price is reacting at resistance; wait for price action here.
Scenario 1: A clean break above opens a recovery toward the next resistance zone around .
Scenario 2: A retest/rejection at leads to another leg down toward , after which the broader uptrend can resume. A liquidity sweep/stop-run into is possible before price turns higher.
Key resistance: ,
Key support:
📊 Trading Plan
Wait for an Easy Trend reversal signal with high volume on 5m when price taps the marked support/resistance zones.
Price is rolling under the trendline; wait for an Easy Trend signal on 5m with high volume to confirm entry.
Example (ENTRY): On 5m timeframe, price broke below the trendline and printed an Easy Trend sell signal with heavy volume, followed by a sharp drop.
Risk management: Stop above the most recent M5 swing high ; move to break-even at 1R (R:R = 1:1).

THE KOG REPORTTHE KOG REPORT
In last week’s KOG Report we would like to see the red box defence hold the price, and if it did we felt an opportunity to long would be available to traders into the red box target levels.
Price did exactly what we wanted and all the red box target levels for the week were completed as well as the Excalibur targets we had in Camelot.
We then released the FOMC KOG Report and shared not only the red boxes but also the hot spots that were active. This suggested a move upside from lower support and then a decline from there into the 3630-40 regions which again worked to the pip and gave us another opportunity not only to short but then to long up to where we closed.
A fantastic week in Camelot with price playing just the way we wanted it to on gold.
So, what can we expect in the week ahead?
For this week we have the key level of 3660-55 support which needs to break for us to go lower in the first half of the week. Above and if that level is supported we see opportunities for the 3710, 3720 and potentially the 3730 regions. Its that 3720-30 level that we want to monitor this week and if attacked, it’s there we feel we may see an opportunity to short the market back into the 3685, 3660 and 3650 level initially.
We’re due a retracement on the bullish move and ideally, we want to see that move this week at some point.
We’re a little to high to go long here in the early sessions, especially with the 3660 level sticking out for a potential swing. So we’ll try and plot the path best we can and keep an eye on the hot spots and the red boxes as well as our trusted friend Excalibur to guide us through the week.
Key levels – 3690 - 3675
RED BOX TARGETS:
Break above 3690 for 3710, 3714 and 3722 in extension of the move
Break below 3670 for 3665, 3655, 3650 and 3643 in extension of the move
We’re going to keep it short this week and as usual, we’ll update traders through the week.
Please do support us by hitting the like button, leaving a comment, and giving us a follow. We’ve been doing this for a long time now providing traders with in-depth free analysis on Gold, so your likes and comments are very much appreciated.
As always, trade safe.
KOG

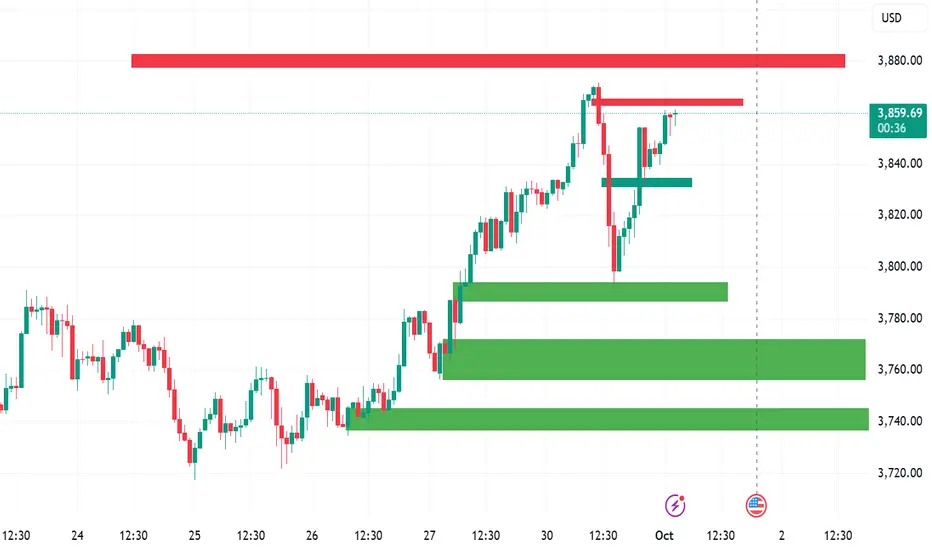
xauusd whats happening?🟡 Gold (XAU/USD) Technical Outlook – Strong Bullish Trend Near All-Time Highs
📊 Market Overview
Current Price: ~3,858.55
Trend: Strong Bullish
Technical Summary:
Moving Averages → Strong Buy
Indicators → Strong Buy
Overall Signal → Strong Buy
🔑 Key Levels
Support Zones:
3,854.88 → (Today’s Low)
3,840 – 3,845 → (Previous Support)
3,788 – 3,800 → (Major Zone)
Resistance Levels:
3,861.41 → (Today’s High)
3,871.72 → (52-Week High)
3,934 → (Fibonacci Target)
Pivot Points (Classic):
S1: 3,852.81
Pivot: 3,856.48
R1: 3,862.13
📈 Technical Analysis Deep Dive
Trend Analysis:
Gold is trading well above all major SMAs & EMAs (5–200 days) → confirms strong uptrend.
Price structure shows higher highs & higher lows → bullish momentum intact.
Momentum Indicators:
RSI (14) → 60.49, bullish but not yet overbought.
Stochastic (9,6) → overbought → signals risk of short-term pullback before continuation.
Market Drivers:
Fed’s dovish stance
Weakening U.S. Dollar
Safe-haven demand from geopolitical tensions
💡 Trading Strategy
✅ Breakout Strategy
Watch for a decisive break above 3,861.41 → possible rally towards 3,871.72 (52W high) and 3,934 (Fib projection).
✅ Pullback Strategy
Safer approach → wait for dip towards:
3,840 – 3,845 zone
3,788 – 3,800 zone (major support)
⚠️ Risk Management
Suggested stop-loss → below 3,840 for entries near 3,850.
Bullish outlook invalidated only if price drops below 3,735.
📌 Conclusion
Gold remains in a strong bullish trend supported by both technicals and fundamentals. While a short-term pullback is possible, the broader outlook favors buying on dips or breakouts towards new highs
XAUUSD | 3rd Signal (SEP 26, 2025)Sell at the 3752-5754:
- Stop Loss: above 3760
- Take Profit: support zone 3745 → 3740 (POC) → Open
1️⃣ H1 Trendline:
- The 3752 – 3754 area coincides with the H1 downtrend line, which acts as a dynamic resistance.
- Every time the price has touched this trendline before, it has been rejected, confirming that selling pressure is still dominant.
2️⃣POC & Volume Profile Structure:
- The current price is trading around POC 3740, which represents the balance zone.
- The 3752 – 3754 area is exactly a supply zone right above the POC, where selling pressure typically appears to defend the prevailing downtrend.
3️⃣Static Resistance:
- The 3752 – 3754 zone is located just below the VAH resistance (3782).
- This serves as an intermediate resistance where sellers often take advantage to enter positions before the price has the chance to approach the stronger resistance zone.
4️⃣Candle Reactions:
- The candlesticks testing the 3748 – 3750 area earlier all showed long upper wicks → proving that selling pressure is still present.
- If the price approaches 3752 – 3754, it is highly likely that a short-term bearish reaction will occur.
5️⃣ Risk Management:
- This area is only suitable for scalping/short-term selling strategies.
- If the price breaks decisively above 3760+, sellers will lose their advantage, and the bullish scenario toward 3782 – 3792 will be activated.
👉 In summary:
- The Sell Zone 3752 – 3754 was chosen because it converges the H1 trendline + supply area near POC + previous candlestick reactions.
- This is considered an optimal short-term entry zone for sellers, with the expectation that the price will retrace back to test POC 3740 or VAL 3730.
👉 If you find this analysis useful, don’t forget to hit like 👍 and drop a comment 💬 to support us in delivering even better insights! Or join my channel to get free signal.

GOLD ELLIOTTWAVE ANALYSIS TVC:GOLD near wave 5 completion.
Long are at maximum financial risk now.
I deeper correction might be on cards.

GOLD PLAN TODAY | XAUUSD SEP.29 Hello Traders,
📊Trend Analysis
🔤Price recently showed a CHoCH to the upside around 3760 → 3780.
🔤Then confirmed a BOS bullish at 3780, pushing further to 3797.
🔤Current short-term structure is bullish, with liquidity sweeps and a fresh FVG supporting upward momentum.
💡Trade Plan
🔼Scenario 1: Bullish Continuation (Main Bias) - BUY
Entry: Long at 3775 – 3780 with bullish confirmation (M5–M15 rejection or engulfing).
Reason: Market structure is bullish with BOS and fresh demand zones.
🔽Scenario 2: Range / Liquidity Grab - SELL
Entry: Short after rejection candle around 3805 – 3810.
Reason: Possible liquidity hunt before returning to fill FVG below.
🔽Scenario 3: Bearish Reversal - SELL
Entry: Sell on retest of 3760 – 3765.
Reason: A clean break of 3760 will shift market structure bearish, targeting lower demand.

Gold (XAUUSD) Soars to All-Time Highs: Elliott Wave Outlook The short-term Elliott Wave analysis for Gold (XAUUSD) indicates that the cycle starting from the September 18, 2025 low is unfolding as a five-wave impulse. From that low, wave (i) advanced to $3647.32, followed by a corrective wave (ii) that concluded at $3631.94. Gold then surged in wave (iii) to $3759.16, with a subsequent dip in wave (iv) ending at $3736.45. The final leg, wave (v), peaked at $3791.08, completing wave ((i)) on a higher degree.
A corrective pullback in wave ((ii)) reached $3716.41, unfolding as a zigzag Elliott Wave structure. From the wave ((i)) high, wave (a) declined to $3750.29, wave (b) rallied to $3779.41, and wave (c) dropped to $3716.41, finalizing wave ((ii)). Gold has since resumed its upward trajectory in wave ((iii)), reaching $3871.73, with a minor pullback in wave ((iv)) concluding at $3792.88. As long as the pivot at $3716.41 remains intact, expect Gold to continue its ascent.
