Trade Journal - XAUSD idea - 30-9-2025Just my personal Journal Idea about XAU.
Never Short Gold, Wait for key levels to buy!
Might look to buy bullish setups in London Session tomorrow!
30-9-2025
GOLDCFD trade ideas

The question of when the gold crash will occurAs I explained a few days back, GBPUSD reversed from resistance and confirmed the bearish case by breaking under the confluence support zone.
The market reached as low as 1.3450, before recovering part of the losses, with price currently hovering near the 1.3500 handle.
The key question now: is this just a corrective bounce, or the start of a deeper reversal?
From my perspective, the broader structure still favors the downside:
• The recent recovery looks corrective in nature, lacking strong bullish momentum.
• The previous confluence support is now acting as resistance.
• Macro factors and USD strength remain supportive of further GBP weakness.
As soon as this correction completes, I expect the bearish leg to resume, with 1.3200 remaining my downside target.
For traders, this means opportunities will likely appear on short setups after spikes into resistance, as long as 1.36 is not decisively reclaimed.
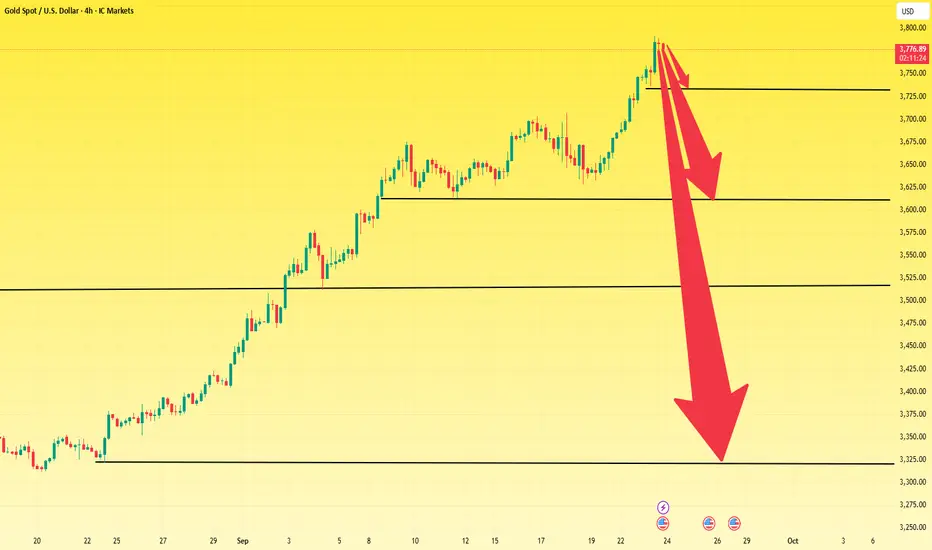
Are there still opportunities to short gold? Gold experienced aGold experienced a sharp drop in the European session, plummeting approximately $70 from its intraday high of $3,871, ultimately testing support near $3,790. This decline followed several consecutive days of gains, repeatedly hitting new all-time highs, sparking market concerns that gold prices may have peaked. Currently, the price has risen to approximately $3,860, having largely recouped the losses. Furthermore, it is clear that above $3,860, gold is showing clear signs of profit-taking, making further declines possible.
Gold has experienced a significant decline in the short term. From a technical perspective, the validity of $3,793 as the low point needs to be re-examined and reaffirmed. Therefore, a direct upward breakout in the short term is unlikely, and a retest of short-term support levels is necessary.
Therefore, when assessing short-term support and resistance levels, we should first focus on the role of the $3,870 resistance area above, and on the downside, the $3,810-3,800 support area. If gold prices fall below support near the low of 3793, they could fall further to the 3780-3770 range.
For short-term trading, we can still capitalize on gold's rebound and prioritize shorting below 3870, focusing on the 3820-3810 area. Specific buying times will be provided in the channel.
For investors who currently have positions or are unsure how to trade, please like my page and visit my channel. I will provide exclusive trading services for members!

GOLD XAUUSD LONDON GOLD MARKET ,might not like the idea of buying gold ,its over bought and caution will be applied
demand floor on 15 min will be .
demand 15min 3838-3843
demand 15min 3828.34
pay day demand 3806-3810.
the market needs correction at least 700pips to see liquidity +volatility again.
#gold #xauusd #dollar #us10y

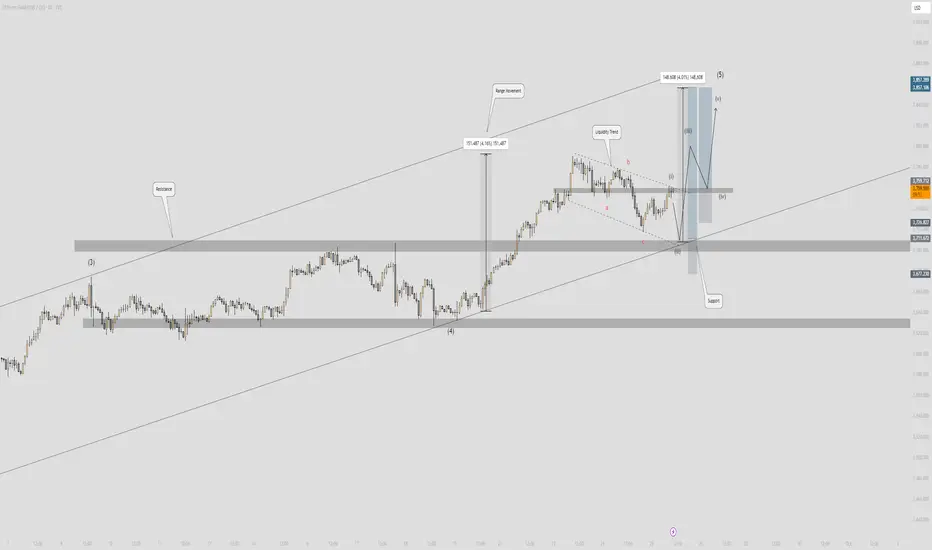
Gold - Wave 2 of 5 (1H Forecast)🚀 Gold 1H Forecast – Wave 5 Loading? 🥇✨
Alright traders, let’s decode this chart 👇
🔭 Bigger Picture
We’re cruising inside a clean ascending channel 📈.
Wave count shows we’re gearing up for the final push (Wave 5) after a solid corrective move.
Price just bounced off that 3,711–3,720 support pocket like a trampoline 🏀.
📉 The Pullback
The corrective ABC move (a–b–c) tapped into demand perfectly.
Liquidity trend got cleaned up — stops swept, weak hands shaken 😮💨.
That bounce birthed sub-wave (i), with (ii) retracing right into support (chef’s kiss setup 👌).
🚀 The Next Impulse
Expectation:
(iii) blast up into the 3,850s zone 💥
Shallow (iv) pullback (quick snack stop 🍔)
Then a final (v) rocket toward the 3,870–3,880 resistance 🎯.
⚡ Key Levels
Support : 3,711 → hold this = liftoff.
Resistance : 3,857–3,870 supply wall = Wave 5 target.
If support cracks, deeper discount levels below 3,677 open up. 🕳
🎯 Play Idea
Bias = Bullish (Wave 5 still in play).
Look for entries on pullbacks above 3,711 support.
Eye profit taking near 3,857–3,870 zone.
📌 Summary: Gold just reloaded at demand, structure screams Wave 5, and momentum’s cooking. Don’t chase green candles — let it dip, then ride the impulse 🚀.
XAU / USd 30 Minute ChartHello traders. Not sure how many people saw my 4 hour chart from early this morning, but the trade played out perfectly. The chart is marked with my entry, where I closed most of the trade's profit, and where I closed out my runner. Perfect way to end the week with my 1 trade. I clocked over 180 pips today. Big G gets all my thanks. Looking forward to next week. Be well and happy Friday. Amazing day, I am most thankful.

XAU/ USD 30 Minute Scalp TradeHello traders. Here is the follow up for my last post. I took a Buy, marked by the green line. Once I was about 70 pips in profit, I closed out 75% of the trade, moved my Stop Loss to my entry point(break even with zero loss) and left a runner ( the remaining 25% of the trade) running. Big G gets all my thanks. Let's see how it goes, but either way, it was a fast trade day, already done. Be well and trade the trade.

Gold Forecast: Liquidity Rotation Shaping Price ActionGold Forecast: Liquidity Rotation Shaping Price Action
Gold’s recent movement reflects shifting dynamics between liquidity capture and market rebalancing. The push above 3,800 was less about sustained trend extension and more about triggering stops and gathering liquidity before rotating lower. This type of move often indicates that large participants are managing positioning rather than chasing new highs.
The current correction phase is part of that process. Price is being driven back into zones where imbalances remain, allowing institutional flow to realign. Instead of showing weakness, this return highlights how markets redistribute liquidity to prepare for the next decisive move.
From a flow perspective, gold remains in an accumulation phase. Consolidation pockets reveal ongoing positioning, while the corrective dip reflects controlled market engineering rather than disorder. If this cycle continues, the next stage could see energy released in the form of a renewed expansion leg once sufficient liquidity has been absorbed.
In essence, gold is navigating a liquidity-driven cycle: sweep → redistribute → prepare → expand. The underlying order flow still favors upward continuation once the current rebalancing phase completes.

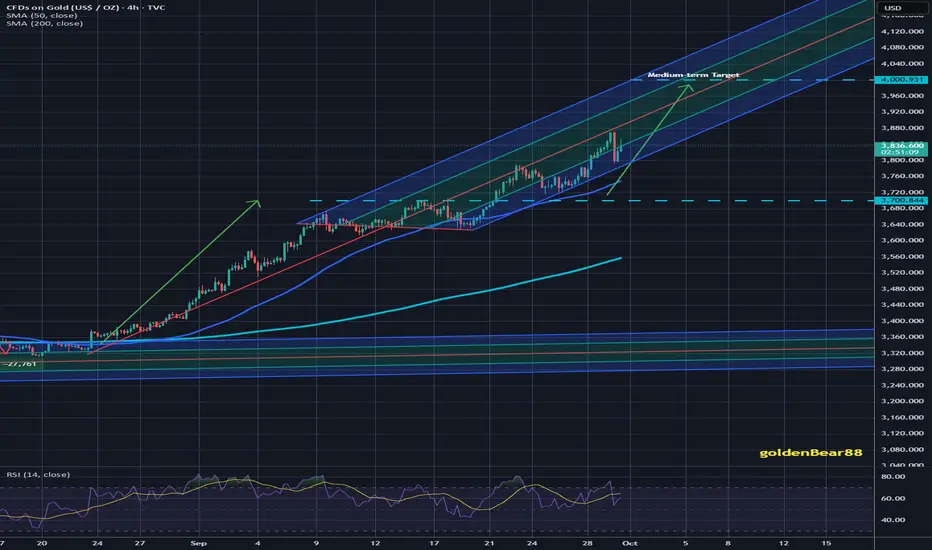
Gold on the path towards #4,000.80 markAs discussed throughout my Friday's session commentary: 'Technical analysis: The #3,745.80 former hard Resistance now turned in Support is now crossed and Gold is now Technically ready to accomplish new local High’s. Personally, I am surprised that Gold didn't re-tested #3,700.80 mark on renewed DX strength as it was fair to expect it both Fundamentally and Technically. Gold recovered #3,732.80 - #3,757.80 without any catalyst (strong Hourly 4 chart's series of Bullish candles) which in my opinion wiped out and liquidated many Sellers from the market. This will be essentially a Higher High’s Upper zone first on Ascending Triangle which was created throughout yesterday's session which was invalidated to the upside / validating my expectation of an #10 to #15 point Trading range (Rectangle) on however aggressive pace for the next #1 - #2 session horizon. The (#1W) Weekly candle is now at (# +2.67%) and the week will most likely close on a positive note following last candle's (# -0.67%). I will take advantage of the Lower High’s Lower zone, giving distinguished Buying opportunities within this relief rally / Bullish Intra-week cycle and Profit on wide timeframes for reduced Risk. Traders have to realize that Trading against Gold’s Hourly 1 and 4 charts should backfire sooner or later. I am looking at #3,762.80 / #3,778.80 / #3,782.80 and / #3,792.80 test initially as I do expect that Trading will be performed widely above #3,800.80 benchmark mid next Monty as even strong DX didn't managed to deliver more serious decline on Gold. #3,722.80 benchmark however is next strong Support and break of the configuration will negate Short-term Bullish potential. I am very satisfied with my Bullish stance and Profits I am making on Intra-day basis even though I am well known Seller of the market (I have to adjust to the trend). Needless to mention, I do expect and preserve my #4,000.80 mark as my Medium to Long-term Target. Enjoy the Profits and have a great weekend!'
My position: I am Buying Gold as planned on each reversal and local Low's test as I Bought #3,763.80 and #3,765.80 / kept it over-night and my #3,800.80 Target is hit and orders closed automatically. I have Bought minutes ago on #3,813.80 and currently holding my Buying orders / #3,827.80 test.
Gold Market Weekly ReviewGold Market Weekly Review: Mild Inflation Data Boosts Gold Prices, Technicals Show Bullish Trend
I. Fundamental Drivers Analysis
Spot gold continued its upward trend on Friday (September 26), successfully breaking through the recent range of $3,720-3,760. It reached an intraday high of $3,782, approaching this week's all-time high of $3,791. Gold prices rose for the sixth consecutive week, primarily supported by the following factors:
Melting inflation data: The US core PCE price index rose 0.2% month-over-month in August (in line with expectations) and remained stable at 2.9% year-over-year, avoiding an unexpected increase, alleviating market concerns about a rebound in inflation.
Weaker US dollar: The US dollar index came under pressure after the data release, providing upward momentum for gold prices.
Sustained safe-haven demand: Geopolitical risks and trade tensions are driving safe-haven flows into the gold market.
Despite the Federal Reserve's recent 25 basis point rate cut, officials' statements underscored their cautious approach to the path of subsequent easing. Strong GDP data and job market performance complicate expectations for rate cuts, but gold remains resilient amidst the dual logic of moderate inflation and risk aversion.
II. Technical Structure Analysis
Breakout Signal Confirmation: The 4-hour chart shows that gold prices have effectively broken through the upper limit of the $3,760 range, reasserting short-term bulls.
Key Support Levels:
Immediate Support: $3,760 (top of the previous range)
Strong Support: $3,755 (21-period SMA) + lower limit of the $3,720 range.
Resistance and Targets:
Near-term Resistance: The historical high range of $3,780-3,791.
Post-Breakout Target: Further upside potential, targeting above $3,800.
Momentum Indicator: The RSI has risen to around 66, reflecting increasing buying momentum, but not entering overbought territory.
If prices fall back below $3,750, the short-term structure may weaken, targeting the $3,720-3,700 support range.
III. Outlook
Gold remains strong, driven by both fundamentals and technicals. After breaking out of the range, attention should be paid to the resistance at the previous high of $3,791. A weekly close above this level would further solidify the medium- to long-term bullish trend. Short-term trading strategies recommend buying on dips and maintaining strict risk management.
Six consecutive weekly gains indicate a strong bullish trend, but the probability of a technical correction is increasing after consecutive sharp gains. The daily chart reached a high near 3,783 before retreating. The 1-hour chart has formed a secondary upward trend without breaking through, indicating the initial formation of a double top pattern. If there are no major news catalysts at the beginning of the week, we recommend prioritizing the possibility of a pullback.
Key Levels
🟡 Weekly Resistance: 3791 (This Week's High)
🟡 Early Weekly Resistance: 3771 (Monday's Key Resistance)
🟢 Weekly Support: 3708
🟢 Intraday Support: 3720 (Bull Resistance)
Trading Strategy
◼️ Short Position: Test short positions with a light position on a rebound to around 3771, targeting 3761-3751-3745.
◼️ Long Position: Shift to long positions after stabilizing near 3720 (information based on intraday signals).
⚡ If the price breaks below 3745, further declines to 3735-3725 are possible.
Risk Warning: Be extremely cautious about the risk of chasing long positions near the 3800 level. Prioritize rebound opportunities at the beginning of the week. Strict risk management is paramount!

GOLD XAUUSD GOLD ,XAUUSD .THE current all time high 3892 reacted on the ascending trend line and drops like other buy rally.
we broke a major support 3871.69-3872 ,this broken structure is our current supply roof and am seeing a bearish drop into 3830...300pips drop in the current Asians session. if we reclaim 3871.69-3872 then we go long target will be 3911 and 3917.
layer by layer.
if correction kick in then we need to be prepared for such change .
#xauusd #GOLD

Continuous Profits on Bull runAs discussed throughout my morning's commentary 'As discussed throughout my yesterday's session commentary: 'My position: I am Buying Gold as planned on each reversal and local Low's test as I Bought #3,763.80 and #3,765.80 / kept it over-night and my #3,800.80 Target is hit and orders closed automatically. I have Bought minutes ago on #3,813.80 and currently holding my Buying orders / #3,827.80 test.'
I have booked excellent Profits on yesterday's Buying sequence on Gold Buying Gold multiple times as stated above and altering my orders on #3,827.80 extension.
My position: However Gold extended the upside extension towards #3,870's and since most Buyers got trapped and most of them liquidated, they didn't pay attention to end of the Month (this is last session of the Month) and possible Profit taking from Investors. I missed current Selling decline as it was delivered mostly on Asian session however I will turn to Buying now as Gold is ready for new upswing and #4,000.80 benchmark extension, maintaining it as my Medium-term Target. Gold's Short-term Bullish trend is negated if Gold closes the session below #3,800.80 mark.
My position: I have made excellent Profits on Gold Buying #3,801.80 firstly towards #3,812.80, then when #3,810.80 established decent Support zone, Bought Gold aggressively towards #3,827.80 extension. Unfortunately, I have closed most of my Buys there however Profit was excellent since I Traded with 200 Lot's. Well done for all who followed my Buying calls, well done!
Gold is on the way to test my #4,000.80 benchmark for the fractal.
Gold Retest of Demand - Bullish Momentum Will ResumePrice has just dipped into an M15 Demand zone.
Even if you do not use my SL or TP, remember, when in doubt, keep riding the trend to the upside.


Gold Holds Near Record Highs, Eyes 3,870 Test📊 Market Overview:
Gold is trading around the record area of 3,867 as the US dollar weakens and expectations rise for the Fed to shift toward monetary easing. Concerns over slowing US growth and safe-haven demand continue to support prices.
📉 Technical Analysis:
• Key Resistance: 3,870 – 3,880
• Extended Resistance: 3,900 – 3,920
• Nearest Support: 3,840 – 3,830
• Extended Support: 3,800 – 3,790
• EMA09: Price remains above the EMA09 on H1, signaling short-term bullish bias.
• Momentum: RSI is overbought, suggesting a possible pullback before further upside.
📌 Outlook:
Gold may see a short-term pullback toward 3,840 before extending gains toward 3,880 – 3,900 if USD weakness persists.
💡 Suggested Trading Strategy:
🔻 SELL XAU/USD : 3,872 – 3,875
🎯 TP: 40 / 80 / 200 pips
❌ SL: 3,878
🔺 BUY XAU/USD: 3,838 – 3,835
🎯 TP: 40 / 80 / 200 pips
❌ SL: 3,832

Gold Buys And Levels Gold finally hit 3800. All the levels which I have shared here have 100% win rate.
Ive updated levels of both sides. For upside 3811 will be an interesting area. For downside 3789 is an interesting area.
Trading these levels is extremely easy for upside ones wait for 15 min candle to close above them for buying with tight sl.
For downside levels you can tp your sells or wait for close below them for scalp sells. And if you see these levels getting rejected strongly they are discounted buys which I’m interested.

Gold Trade Plan 25/09/2025Dear Traders,
Considering the deep correction that gold experienced, if the price fails to hold above the 3770–3780 zone, we may see another decline toward 3700. Today’s daily candle will provide a strong confirmation for the continuation of the trend.
Regards,
Alireza!

Gold is approaching $3,900, is $4,000 still far away?
News:
On Wednesday (October 1st), the US government shutdown officially took effect in the early hours of US Eastern Time. Congress failed to reach a consensus on a temporary funding bill (CR) for fiscal year 2025, resulting in the suspension of operations of agencies such as the Bureau of Labor Statistics (BLS). The release of the non-farm payroll report (originally scheduled for October 3rd) and the Consumer Price Index (CPI) data (October 15th) have been delayed indefinitely (depending on the duration of the shutdown).
This has heightened uncertainty surrounding the Federal Reserve's decision-making. The probability of a 25 basis point rate cut at the originally scheduled October 28-29 meeting has fallen from 90% to approximately 80%. The market has turned to alternative indicators such as the ADP employment data, but these alternative sources are less accurate and may lead to a more conservative policy path.
The current US dollar index (DXY) is at 97.78, down 0.1% on the day and down nearly 10% this year. The RSI is neutral to weak (47.6), reflecting that the safe-haven demand has not been significantly activated; spot gold (XAU/USD) is at $3,883, up 0.6% on the day, and the RSI is overbought (64), setting a record high, highlighting its role as a non-US dollar safe-haven asset; the 10-year US Treasury yield remained stable at 4.15%, with limited intraday fluctuations. Market concerns about supply disruptions were offset by short-term safe-haven buying.
Specifically:
Judging from the 1-hour market trend, the bulls are fluctuating at a high level with a positive closing. Short-term support below is at 3860-50, and the important support at 3830 is also on the agenda. The bulls are rising strongly and there is no end in sight. The main strategy is to buy on pullbacks. In the middle, be cautious in chasing orders and wait patiently for key points to enter the market. I will provide detailed operation strategies in the channel, so please pay attention to them.
Strategy:
Long Position3850-3860,SL:3720,Target:3900

Excellent re-Buy orders on GoldAs discussed throughout my yesterday's session commentary: 'My position: I have made excellent Profits on Gold Buying #3,801.80 firstly towards #3,812.80, then when #3,810.80 established decent Support zone, Bought Gold aggressively towards #3,827.80 extension. Unfortunately, I have closed most of my Buys there however Profit was excellent since I Traded with 200 Lot's. Well done for all who followed my Buying calls, well done!
Gold is on the way to test my #4,000.80 benchmark for the fractal.'
I have closed my orders on #3,827.80 however engaged another set Buying orders last night with no Take Profit and manually closed all my orders on #3,886.80 few moments ago. This is indeed real delight for all Traders to participate on Bull trend, booking excellent Profits on the way up towards my #4,000.80 benchmark Medium-term Target.
My position: I do believe however that Gold is set for small pullback then another wave to the upside. I assume no new orders for now.

Gold’s Turning Point – Bulls Reload or Bears Take Control?Gold has reached a critical stage in its journey. After breaking higher and sweeping liquidity, price tapped into a refined premium supply zone at 3780–3795. This is the kind of area where smart money tests momentum, where late buyers often get trapped, and where sellers show their first signs of strength.
But the story doesn’t end there. Just beneath, a solid demand base at 3715–3730 is waiting. If buyers regroup here, the bullish trend can reload for another assault on the highs. Between these two extremes sits the decision zone at 3750–3760, the pivot that will dictate the next chapter.
🟪 Premium Supply – 3780–3795
The upper battlefield, marked by the last order block and wick. Liquidity was swept here, and the rejection already showed sellers defending. Any revisit into this area could trigger another sharp reaction downward.
🟦 Demand Reload – 3715–3730
The lower base, built on a clean H1 OB with a fair value gap and EMA50 alignment. If gold retraces deeper, this is where bulls are likely to step in with force. A strong defense here would reload the bullish structure and open the path back to the premium highs.
🟨 Decision Zone – 3750–3760
This is the pivot point — the short-term battleground. If buyers defend this area, momentum shifts quickly back toward 3780–3795. If it cracks, sellers gain the upper hand and the market sinks toward the deeper demand.
⚔️ Battle Scenarios
Bullish Defense: Hold 3750–3760 → push into 3780–3795. If supply fails, continuation toward new highs.
Bearish Break: Lose 3750 → retrace into 3715–3730 for the real demand test.
Deep Correction: If 3715 gives way, next structural stop is 3670–3690.
🎯 Final Word
The battlefield is set: supply above, demand below, decision zone in the middle. Gold’s structure is still bullish, but momentum is fragile. The story now depends on whether 3750–3760 holds the line — defend it, and bulls reload; lose it, and sellers drag the market into discount.
🔥 What’s your take traders — do bulls reload from 3750, or do bears drag us down into deeper discount?
👇 Drop your thoughts in the comments, smash the like button, and hit follow on GoldFxMinds for more daily sniper plans. Let’s keep building this edge together 🚀✨

XAU/USD) Bullish trend analysis Read The captionSMC Trading point update
Technical analysis of Gold (XAU/USD) 30-min chart you shared:
---
Gold (XAU/USD) – Bullish Setup (M30 Chart)
Market Structure:
Price is moving inside a bullish ascending channel.
Current retracement is pulling back toward a fair value gap (FVG, H4) highlighted in yellow.
Price is still holding above the 50 EMA (3806.16) and 200 EMA (3766.40), both sloping upward → confirming bullish momentum.
Key Levels:
Support Zone (Demand / FVG H4): 3810 – 3820 region (yellow box).
EMA 50: Acting as dynamic short-term support around 3806.
EMA 200: Stronger bullish base at 3766.
Target Point: 3857.19 (resistance zone & top of channel).
Price Expectation:
Likely scenario:
Price may retrace into the FVG support zone → bounce upward → continue inside the channel toward the target point 3857.
As long as the structure holds above 3806 (EMA 50), the bullish setup remains valid.
Mr SMC Trading point
---
Bias: Bullish
Target: 3857.19 Key Support: 3810 – 3820 zone (FVG + EMA confluence)
Please support boost 🚀 this analysis

GOLDPreferably suitable for scalping and accurate as long as you watch carefully the price action with the drawn areas.
With your likes and comments, you give me enough energy to provide the best analysis on an ongoing basis.
And if you needed any analysis that was not on the page, you can ask me with a comment or a personal message.
Enjoy Trading ;)

GOLD Buyers In Panic! SELL!
My dear followers,
This is my opinion on the GOLD next move:
The asset is approaching an important pivot point 3817.13
Bias - Bearish
Safe Stop Loss - 3826.1
Technical Indicators: Supper Trend generates a clear short signal while Pivot Point HL is currently determining the overall Bearish trend of the market.
Goal - 3799.8
About Used Indicators:
For more efficient signals, super-trend is used in combination with other indicators like Pivot Points.
Disclosure: I am part of Trade Nation's Influencer program and receive a monthly fee for using their TradingView charts in my analysis.
———————————
WISH YOU ALL LUCK
