Gold Pulls Back After Hitting $3,895 – Consolidation Before 3900📊 Market Overview
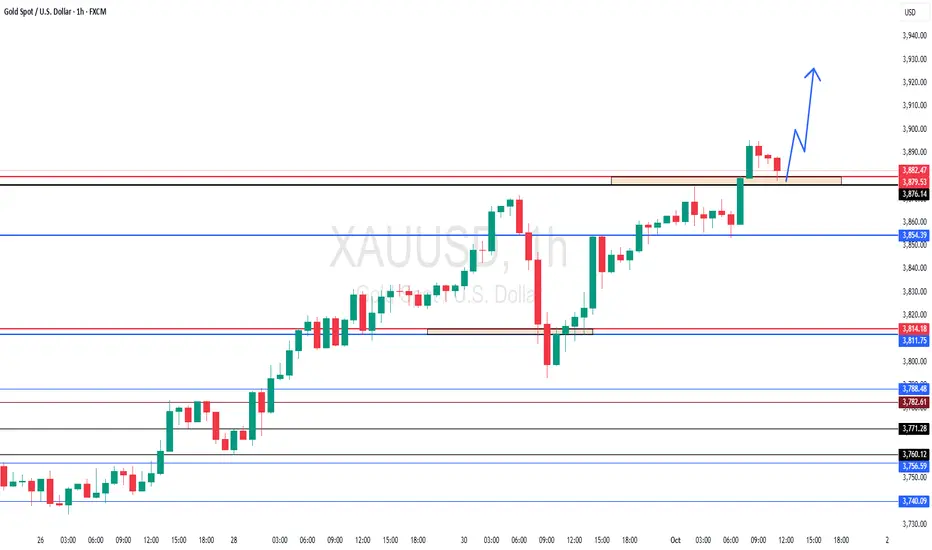
Gold reached a new high at $3,895, approaching the psychological $3,900 level, before facing profit-taking pressure and retreating toward $3,885. The market shows caution when testing strong resistance, as the USD remains weak and safe-haven demand persists.
📈 Technical Analysis
• Near-term Resistance: $3,895 – $3,900
• Strong Resistance: $3,915
• Near-term Support: $3,873 – $3,870
• Strong Support: $3,860 – $3,850
• EMA20 (H1): Price remains above EMA20, keeping the short-term uptrend intact.
• H1 Candlestick: Long upper wick at $3,895 indicates strong selling pressure at resistance, raising the risk of a short-term pullback.
📌 Outlook
Gold maintains its short-term bullish trend, but the $3,895–$3,900 zone remains a key barrier. A breakout could push price to $3,915, while a correction to $3,880–$3,872 would be normal consolidation before further gains. A break below $3,872 may drive price toward $3,860.
🎯 Trading Strategy
🔺 BUY XAU/USD
• Entry: $3,872 – $3,869
• 🎯 TP: 40 / 80 / 200 pips
• 🛑 SL: $3,866
GOLDCFD trade ideas

GOLD POSSIBLY FOR THIS WEEK Gold (XAU/USD) Buy Setup 🚀
Price is showing strong bullish momentum after holding above key support levels. Market structure indicates buyers are in control, with confirmation from moving averages and volume.
📍 Entry Zone: Above current breakout level
🎯 Target: 3929
🛡 Risk Management: Always use stop-loss below recent support
This setup is based on price action + trend confirmation. If momentum continues, we can expect Gold to push higher towards the 3929 level.

Gold Trade Plan 29/09/2025Dear traders,
📊 Gold (XAUUSD) Outlook
Gold is expected to rise sharply amid the potential NATO–Russia conflict, pushing into new highs without deep corrections.
🟢 Best strategy: Look for buy opportunities at lower zones
3799 – 3801
3775 – 3779
🎯 Target: Much higher levels as momentum accelerates 📈✨
Regards,
Alireza!

GOLD High placed? What's next??#GOLD.. market placed a very reasonable high so far and now going to break his supporting area.
Kep close upside region that can play major role in next move.
Don't be lazy here.
NOTE: we will go for cut n reverse above region not before that.
Good luck
Trade wisely
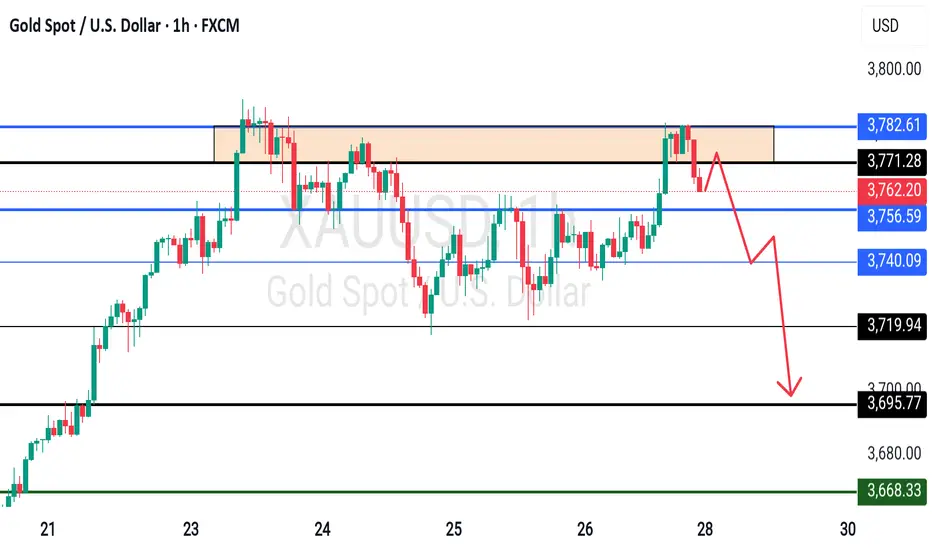
XAUUSD: MASSIVE BREAKOUT IMMINENT! Multi-Timeframe Analysis# 🚀 XAUUSD: MASSIVE BREAKOUT IMMINENT! Multi-Timeframe Analysis 📊
Closing Price: $3,761.24 | Date: Sept 27, 2025 ⏰ UTC +4
📈 INTRADAY TRADING SETUPS (Next 5 Days)
🎯 BULLISH SCENARIO
Entry Zone: $3,755 - $3,760 📍
Stop Loss: $3,740 🛑
Target 1: $3,785 🎯
Target 2: $3,810 🚀
🎯 BEARISH SCENARIO
Entry Zone: $3,770 - $3,775 📍
Stop Loss: $3,790 🛑
Target 1: $3,730 🎯
Target 2: $3,700 📉
🔍 TECHNICAL ANALYSIS BREAKDOWN
📊 KEY INDICATORS STATUS:
RSI (14): 67.2 ⚡ *Approaching Overbought*
Bollinger Bands: Price at Upper Band 🔥
VWAP: $3,752 - Acting as Dynamic Support 💪
EMA 20: $3,748 ✅ *Bullish Cross Confirmed*
Volume: Above Average 📊 *Institutional Interest*
🌊 WAVE ANALYSIS:
Elliott Wave suggests we're in Wave 3 of larger uptrend 🌊
Fibonacci Extension: $3,820 (161.8% target) 🎯
🔄 HARMONIC PATTERNS:
Bullish Gartley completion at $3,745 ✨
PRZ (Potential Reversal Zone) active 🔄
⚖️ SWING TRADING OUTLOOK (1-4 Weeks)
🚀 BULLISH TARGETS:
Weekly Resistance: $3,820 🏆
Monthly Target: $3,880 🌙
Gann Square of 9: $3,900 ⭐
📉 BEARISH INVALIDATION:
Weekly Support: $3,680 ⚠️
Critical Level: $3,650 🚨
🎭 MARKET STRUCTURE:
Trend: Strong Bullish 💪
Momentum: Accelerating 🔥
Wyckoff Phase: Mark-up Phase 📈
Ichimoku: All systems GREEN 🟢
⚡ RISK MANAGEMENT:
Max Risk per Trade: 2% 🛡️
R:R Ratio: Minimum 1:2 ⚖️
Position Size: Based on volatility 📏
🌍 MARKET CATALYSTS:
- Fed Policy Meeting Next Week 🏛️
- Geopolitical Tensions Supporting Gold 🌐
- Dollar Weakness Continuing 💵
🎯 FINAL VERDICT:
Gold shows STRONG BULLISH BIAS with multiple confluences aligning! 🚀
Watch for breakout above $3,775 for explosive move to $3,820+ 💥
Trade Management: Trail stops every 4H close above entry 📈
Key Level to Watch: $3,752 VWAP support 👀
---
*⚠️ Disclaimer: Trading involves risk. Always use proper risk management and never risk more than you can afford to lose. This analysis is for educational purposes only.*
For individuals seeking to enhance their trading abilities based on the analyses provided, I recommend exploring the mentoring program offered by Shunya Trade. (Website: shunya dot trade)
I would appreciate your feedback on this analysis, as it will serve as a valuable resource for future endeavors.
Sincerely,
Shunya.Trade
Website: shunya dot trade
🔔 Follow for Daily Updates | 💬 Comment Your Thoughts Below
XAUUSD SELL IDEAThe Draw on Liquidity is below the 4hr candle and price will go to it from this market structure reversal zone.

XAU / USD 4 Hour ChartHello traders. I have not posted much as I have been concentrating on my crypto holdings lately, buying the dips on Ethereum and Bitcoin. Saying that, I have marked my area of interest on the chart. As explained on the chart itself, I am watching that red candle to see what happens when Pre NY volume starts in in hour and a half from now. ( 7:20 am est here in the US is when pre ny volume usually starts the move for the day.) Let's see how things play out. Big G gets a shout out. Happy Friday. Be well and trade the trend.

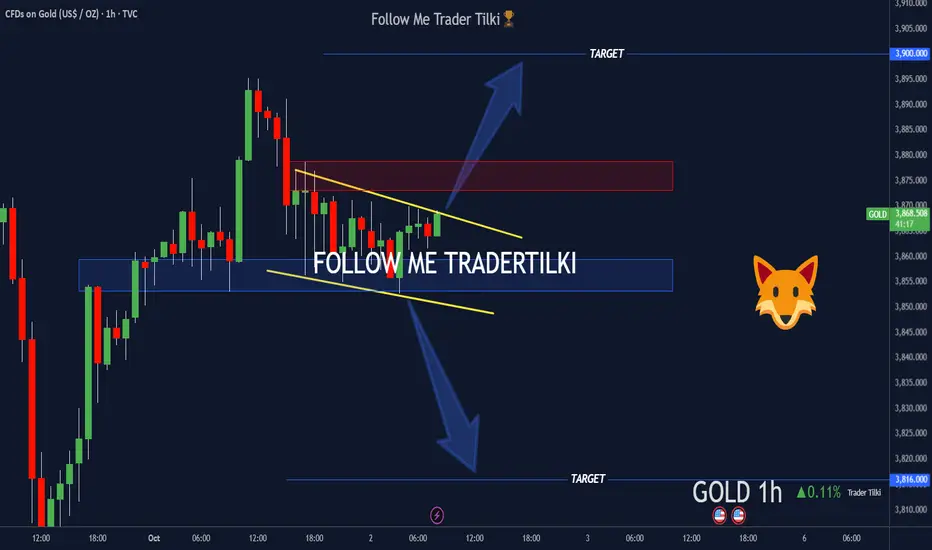
Trader Tilki’s GOLD-XAUUSD Breakdown: Silent Storm Brewing📊 XAUUSD – GOLD Critical Breakout Analysis
Hey Guys,
By popular demand, I’ve prepared the latest breakout analysis for XAUUSD-GOLD. Your support means a lot to me, so I’m sharing this breakdown based on your requests.
🔹 Buy Scenario
If we get a candle close above 3878.0, the first target will be 3900.0.
🔹 Sell Scenario
If price closes below 3850.0, then gold’s target level will be 3816.0.
Every single like is my biggest motivation to keep sharing these analyses.
Thanks to everyone showing support 🙏
Gold rebounds after a drop to $3794📌 Market Movement:
Today, gold sharply dropped to the $3794 level but quickly rebounded and is now trading around $3803. This indicates some dip-buying interest at short-term support, though selling pressure has not completely faded.
📊 Technical Analysis:
• Short-term support: $3794 – $3790
• Near-term resistance: $3810 – $3815
• EMA 50 on H1 remains an overhead barrier.
• The H1 candlestick shows a long lower wick, reflecting buying pressure at the lows.
🔎 Outlook:
Gold is consolidating in a narrow range after rebounding from $3794. If it holds above $3798, the recovery could extend toward $3810 – $3815. Conversely, a break below $3794 would bring back downside pressure.
🎯 Trading Strategy Suggestion:
• Prefer to stay cautious and wait for clear confirmation.
• BUY around $3794 – $3798 if price holds above support.
o TP: $3810 – $3815
o SL: $3790
• SELL if price fails to break $3815 and shows reversal signals.
o TP: $3800 – $3795
o SL: $3818

XAU/USD Bullish trend analysis Read The captionSMC Trading point update
Technical analysis of XAU/USD Bullish Channel Setup (4H Timeframe)
---
Chart Summary:
Pair: Gold Spot (XAU/USD)
Timeframe: 4H
Exchange: OANDA
Current Price: $3,759.85
EMA 50: $3,718.68 (short-term support)
EMA 200: $3,576.42 (major support)
---
Key Elements in Chart:
1. Ascending Channel Formation
Price is moving inside a clear rising channel (higher highs & higher lows).
Upper and lower boundaries are acting as dynamic resistance & support.
2. Support Levels (Yellow Zones)
$3,720–3,740 zone: strong support with EMA 50 confluence.
$3,600–3,620 zone: deeper support, aligned with EMA 200.
3. Breakout & Retest
Price broke a short-term descending trendline, signaling bullish continuation.
Retest of support level confirms buyers are active.
4. Bullish Projection
Based on measured move (previous impulse), projection suggests a rally towards $3,877.07 (target point).
Mr SMC Trading point
---
Conclusion:
The chart signals a bullish continuation inside the ascending channel.
Bullish Scenario: Holding above the $3,720–3,740 support zone, price is expected to rally toward the $3,877 target.
Invalidation: A 4H close below $3,718 (EMA 50) could open a deeper correction toward the $3,600 support (EMA 200).
---
Pelas support boost 🚀 this analysis

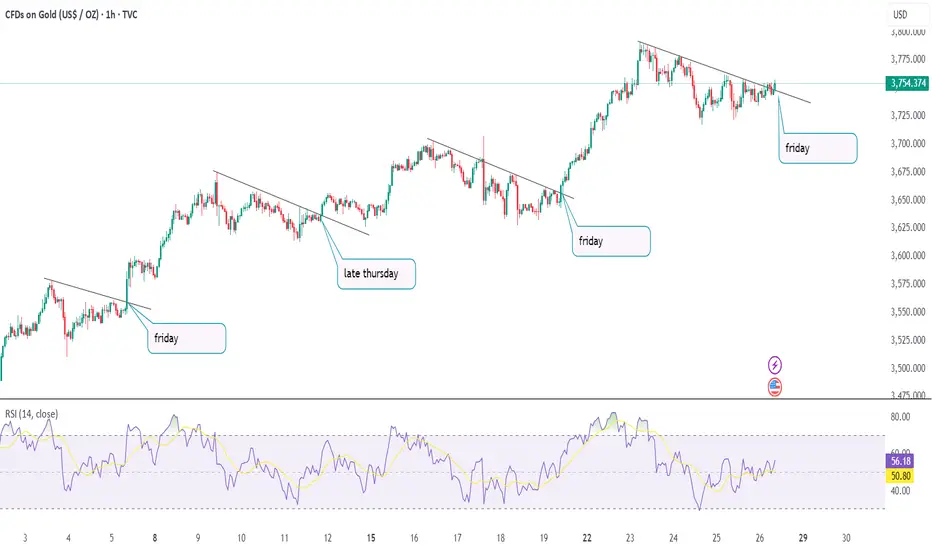
GOLD-BULLISH IDEAis GOLD is ready to print new ATH? as we can see in the chart everytime it retrace it start rally on friday or late thursday.
XAUUSD Anlaysis todayHello traders, this is a complete multiple timeframe analysis of this pair. We see could find significant trading opportunities as per analysis upon price action confirmation we may take this trade. Smash the like button if you find value in this analysis and drop a comment if you have any questions or let me know which pair to cover in my next analysis.

GOLD XAUUSD Market structure will never lie, we as traders have oversight a lot and ignore signs of potential buy and sell zone.
there is nothing like manipulation in the market, what we have is demand and supply.
the question is how do you know which demand/supply zone carry majors bias, at the end of the day price action moves in the direction of majority bias
i will be watching the break of 1hr supply roof for sell or buy.
GOODLUCK.
#XAUUSD #GOLD

GOLD at immediate Support ? whats next??#GOLD.. perfect move as per our couple of ideas regarding gold and now again market make a immediate supporting area that is around 3876 to 3880
keep close that region and if market staying above that means there is further roam to upside,.
good luck
trade wisely
GOLD H2 OUTLOOK !Letsss Goo
Selling Gold Guys
PENDING ORDER : 3850 , 3870 SELL ZONE
REASONS
TURTLE SOUP
IFVG
FVG
ORDER BLOCK
Hope You Got It ? Enjoy It

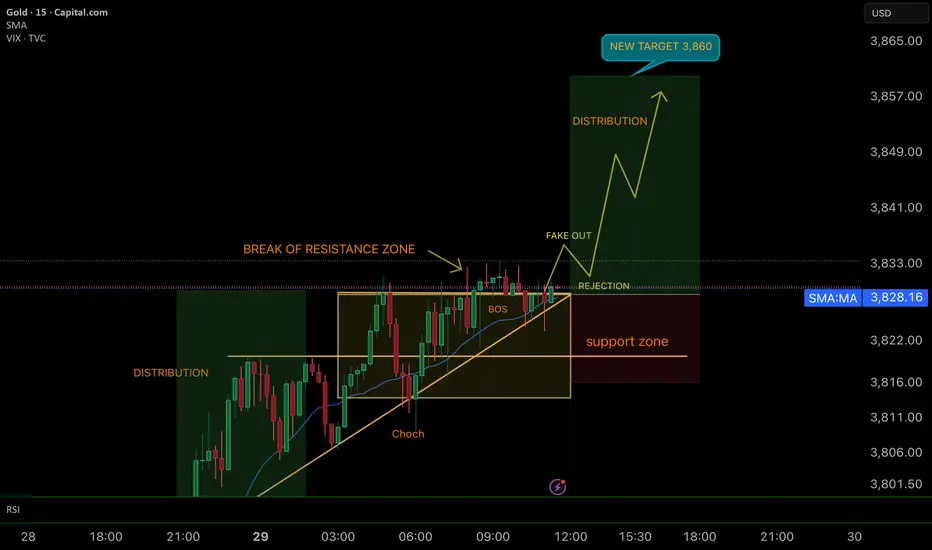
SMART MONEY CONCEPT (SMC)📊 Bullish Analysis – GOLD 15M
🔑 Key Points
1. Initial Distribution
Market created distribution, clearing liquidity before the bullish impulse.
2. ChoCh + BOS (Break of Structure)
The ChoCh confirmed a shift in character, while the BOS validated the bullish direction.
3. Break of Resistance Zone
Price broke the previous resistance, showing strong institutional buying pressure.
4. Fake Out + Rejection
After the breakout, we expect a fake out to grab liquidity, followed by a rejection zone entry before continuation upward.
🎯 Projection
• Entry: On the rejection after the fake out.
• Target (TP): 3,860 – aiming for the next distribution zone.
• Stop Loss (SL): Below the support zone to protect against invalidation.
📌 Conclusion
Gold continues to show strong bullish momentum, with clear intention to reach new highs (HH) around 3,860. Waiting for rejection confirmation after the fake out is key to a high-probability setup. GOOD LUCK TRADERS… ;)
GOLD BEARS ARE GAINING STRENGTH|SHORT
GOLD SIGNAL
Trade Direction: short
Entry Level: 3,824.27
Target Level: 3,583.49
Stop Loss: 3,983.30
RISK PROFILE
Risk level: medium
Suggested risk: 1%
Timeframe: 1D
Disclosure: I am part of Trade Nation's Influencer program and receive a monthly fee for using their TradingView charts in my analysis.
✅LIKE AND COMMENT MY IDEAS✅

GOLD Best Places To Buy And Sell Cleared , 1000 Pips Waiting !Here is m y opinion on GOLD On 30 Mins T.F , We have a Huge movement To Upside since Last 4 weeks , started between 3870.00 to 3895.00 so we can buy and sell Gold This Week from 2 areas , 3870.00 will be the best place for Buy and 3895.00 will be the best place for Sell , now the price very near buy area so we can wait the price to retest the support area and then enter a buy trade and targeting 3895.00 and when the price touch it and give us a good bearish P.A , we can enter a sell trade and targeting 3870.00 , It`s All Depend On Price action .
Entry Reasons :
1- Highest Level The Price Touch It
2- Broken Res
3- New Support Created .
4- Clear Price Action .


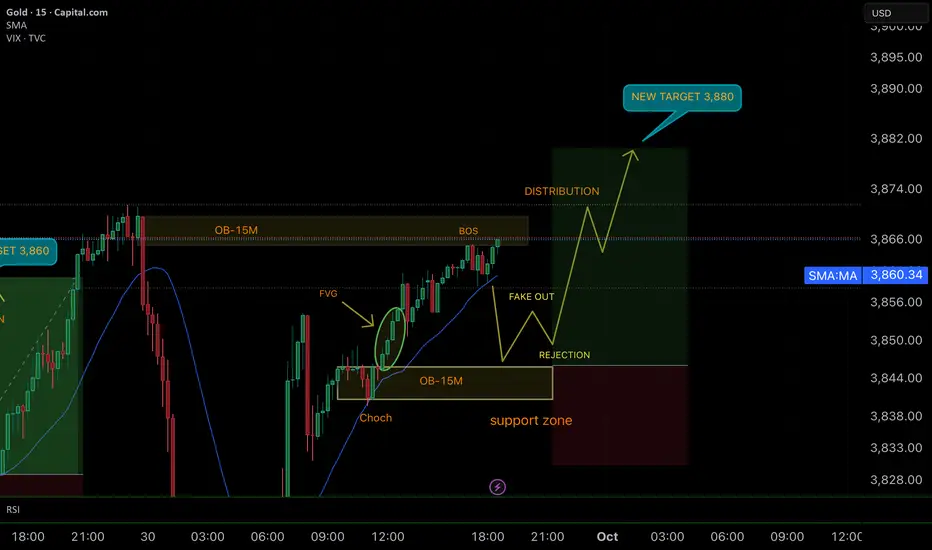
SMART MONEY CONCEPT (SMC)Bullish Analysis – GOLD 15M
✅ Market Context:
Price showed a Change of Character (ChoCh) confirming bullish intention. Then, it respected a 15M Order Block, generating an impulsive move with a Fair Value Gap (FVG) that was later mitigated.
✅ Structure and Validations:
• A Break of Structure (BOS) confirmed strength after breaking resistance.
• Market entered a distribution phase, where a potential fake out is likely before continuation.
• The support zone remains the invalidation area and serves as risk protection.
✅ Trading Plan:
1. Wait for a possible fake out and rejection in the marked zone.
2. Confirm re-entry in institutional levels.
3. Hold the bullish direction with a new target at 3,880.
🔑 Conclusion:
This analysis reflects patience, institutional reading, and clear risk management. The market is aligned to continue toward new highs. GOOD LUCK TRADERS… ;)
Gold Double Top ATHThe all-time high forecast earlier this year by Goldman Sachs was 3,700 with an exhaust level of 3,880. I believe we will see a double top formation around 3,871 and 3,880. I do think we will see resolve before a government shutdown and this is a buy the rumor sell the news event on most USDATA coming this week. Good luck!
-This is not financial advice

XAUUSDGold price today has risen to a new high of $3871 and the price has failed to break above $3871 and selling has occurred. We expect that in the short term, there is a possibility of price correction. Consider selling in the red zone.
**Very Risky Trade
🔥Trading futures, forex, CFDs and stocks carries a risk of loss.
Please consider carefully whether such trading is suitable for you.
>>GooD Luck 😊
❤️ Like and subscribe to never miss a new idea!

3820 Breakout:Chase It or Fade It?After our long position hit the TP, we just profited from our short position near 3830 by hitting the TP at 3815. This is a very good short-term trade.
Judging from the current structural form of gold, the low point of gold retracement is gradually shifting upward, and the short-term support below is moving up to the 3810-3800 area; if gold rebounds again with the help of this support area and stands above 3825, under the resonance of technical level and positive news, gold may hit the 3840-3850 area in the short term, or even reach the extreme area near 3860. The current market is bullish and it is difficult to see a reversal in the short term. At best, there will only be a short-term pullback. Therefore, in short-term trading, we mainly follow the trend trading; only after gold touches the key resistance area can we try to short gold. It should be noted that due to the limited retracement space, a reasonable TP must be set.
1. Consider going long on gold in the 3810-3800 range, initially targeting the 3835-3845 range.
2. When gold first reaches the 3840-3850 range, consider going short on gold, initially targeting the 3825-3815 range.
