October 2, 2025 - XAUUSD GOLD Analysis and Potential Oppotunity📊 Analysis:
Yesterday’s high reached 3895, still slightly short of the projected level. Watch for a breakout above 3895 — if confirmed, price may test the 3900 psychological level. If 3895 fails to break, short setups could offer good risk–reward.
For now, treat the 3850–3853 support zone as the bull–bear pivot:
Above 3853 → buy pullbacks into support.
Below 3850 → sell rallies into resistance.
Try to avoid trading in the 3868–3872 zone, as price action there is likely to be choppy and difficult to manage.
🔍 Key Levels to Watch:
• 3899–3900 – Projected bullish target
• 3895 – Yesterday’s high
• 3885 – Resistance
• 3879 – Resistance
• 3868–3872 – Resistance zone
• 3865 – Support
• 3860 – Support
• 3855 – Support
• 3850–3853 – Key bull–bear pivot / Last defense for bulls
• 3840 – Support
📈 Intraday Strategy:
SELL: If price breaks below 3853 → target 3850, with further downside toward 3845, 3840, 3834
BUY: If price holds above 3872 → target 3875, with further upside toward 3879, 3885, 3890, 3895
GOLDCFD trade ideas

Gold (Rose ) and SPX ( Jack ) relationship. 1/Oct/25XAUUSD ( Rose ) and SPX ( Jack ) since dunno when they are in closed relationship on "Titanic Ship".. But.. That "shxx" is obviously tilting heavily into 1 side.untill early/mid Oct at 7000 and 4000 nautical And when.Jack and Rose probably have to perform "you jump I jump"..But after that they will "ride" different "ships"..Where one still on sinking ship , the other is riding into "Titanic" sky ship"...

GoldXAUUSD
- Completed " 12345 " Impulsive Waves and " A " Corrective Wave
- Break of Structure
- Fibonacci Level - 50.00% - 61.80%
- Demand Zone
- Change of Characteristics

Analysis of gold trend next week!Market News:
The US dollar rose for the second consecutive week this week, but spot gold prices continued to surge, reaching a new all-time high. London gold prices have now risen for the sixth consecutive week. Market expectations of two more rate cuts this year have led to rising stocks, a weakening US dollar, and generally stable Treasury yields. Friday's US PCE data remained largely stable, with personal spending growth exceeding expectations. Spot gold surged, briefly approaching a record high, but retreated in late trading, ultimately closing up 0.28%. Next week marks a "super week" for investors, with both major and minor non-farm payroll reports focused on key speeches by Federal Reserve officials. Meanwhile, several US economic data releases, including Friday's non-farm payroll data, will be released. These data will cross-validate the Fed chairs' views and provide guidance for the Fed's interest rate meeting at the end of October.
Next Week's Analysis:
Gold prices rose strongly on Friday, with buying at 3755 in the US session. Gold also rose to 3784, but retreated in the latter part of the night, failing to break new highs. Can gold buying continue to reach new highs, continuing the frenzy, or is this just a blip? Next week will be crucial. If the one-hour gold price fails to continue its upward trend, it could form a double top pattern. Next week will feature a series of important data releases, and gold will likely remain volatile at the start of the week. Without any significant news at the start of the week, watch for resistance at 3790 and a potential pullback. Focus on support at 3720. If the rebound is weak on Monday, sell at a high price.
Trading Strategy:
Short-term gold buy at 3740-3743, stop loss at 3732, target at 3780-3800;
Short-term gold sell at 3785-3788, stop loss at 3797, target at 3740-3720;
Key Points:
First Support Level: 3743, Second Support Level: 3720, Third Support Level: 3700
First Resistance Level: 3780, Second Resistance Level: 3792, Third Resistance Level: 3800

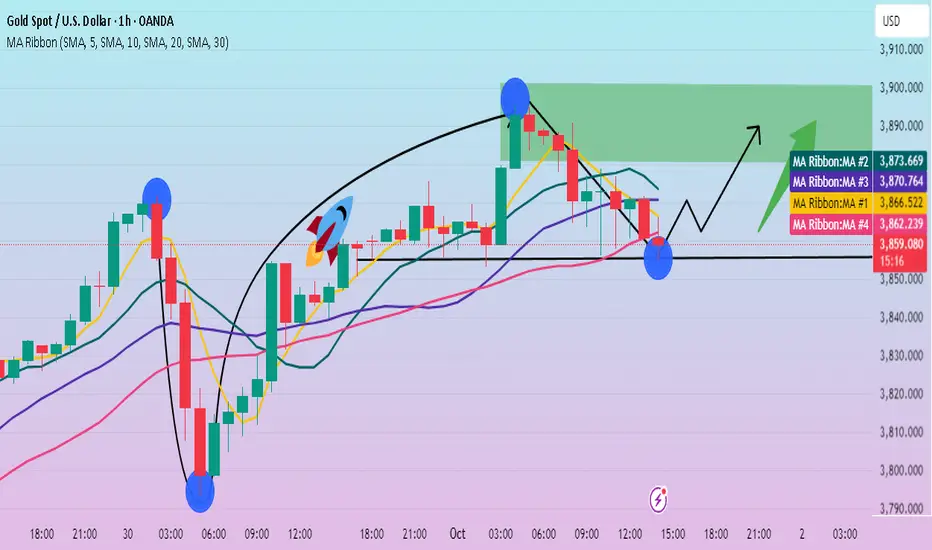
Gold continues to make new highs. Watch for key support levels.With the government shutdown, data collection and reporting by federal agencies may be delayed or suspended. Therefore, employment and inflation reports scheduled for release in the coming days may not be published, creating uncertainty and fueling a flight to safety.
Since the start of this week, gold has essentially set new all-time highs almost daily. While there have been significant pullbacks, they have been short-lived, and gold has rebounded to new highs. The surge in gold suggests that pullbacks are merely opportunities to buy.
On the 1-hour chart, after reaching its all-time high of 3895, gold's momentum has slowed. The moving average system is flattening out, and after several attempts to break below support, gold has rebounded. In the short term, there is strong support below, with the lowest point reached at 3856. As long as gold doesn't break below 3856, it is likely to continue its strong upward trend.
Trading Strategy:
Buy at 3855, stop loss at 3845, target profit range: 3880-3890-3900.
GOLD Massive Long! BUY!
My dear subscribers,
This is my opinion on the GOLD next move:
The instrument tests an important psychological level 3874.0
Bias - Bullish
Technical Indicators: Supper Trend gives a precise Bullish signal, while Pivot Point HL predicts price changes and potential reversals in the market.
Target - 3886.6
My Stop Loss - 3866.8
About Used Indicators:
On the subsequent day, trading above the pivot point is thought to indicate ongoing bullish sentiment, while trading below the pivot point indicates bearish sentiment.
Disclosure: I am part of Trade Nation's Influencer program and receive a monthly fee for using their TradingView charts in my analysis.
———————————
WISH YOU ALL LUCK

Gold Breaks Above $3,800 per OunceXAU/USD started the week with a strong bullish bias, posting a gain of about 1.8% in the first session and maintaining solid upward momentum. Buying pressure has held firm as political uncertainty in the United States grows amid the risk of a potential government shutdown if Congress fails to approve essential budget legislation. This has triggered continued weakness in the U.S. dollar and boosted demand for gold as a safe-haven asset, a trend that could persist in the short term if political risks remain and lead to a broader paralysis.
Unstoppable Uptrend
Since late August, gold has been following a marked bullish trend, consistently driving prices to new all-time highs in the short term. At the moment, there are no clear signs of exhaustion in this trend, and in the absence of significant bearish corrections, the technical structure is likely to remain dominant in the coming sessions, provided that buying pressure holds steady. However, given the speed of the recent rally, the market may soon see a phase of technical pullbacks in the short term.
RSI
The RSI continues to hover above the 70 level, firmly in overbought territory. At the same time, the indicator has begun showing lower highs while gold prices continue to post higher highs, creating a clear divergence signal in the short term. Together, these factors suggest that the speed of recent buying activity has caused a market imbalance, which could eventually pave the way for steady corrective pullbacks.
MACD
The MACD histogram remains in positive territory but is moving closer to the zero line, which represents price equilibrium. As long as the histogram fails to recover decisively, indecision is likely to become a feature of gold’s short-term price action.
Key Levels to Watch:
$3,900 – Psychological Resistance: In the absence of historical references, this is the most immediate level to monitor as resistance. Sustained buying above this zone would reinforce the current uptrend and consolidate a dominant bullish bias.
$3,800 – Nearby Barrier: A recent neutrality level that may act as immediate support against potential short-term corrections.
$3,640 – Key Support: Corresponds to the most recent lows. A break below this level would put the ongoing uptrend at risk and could open the door to a more relevant bearish bias in the short term.
Written by Julian Pineda, CFA – Market Analyst

Gold is sold at 3753-3755!The gold market began a period of volatile correction yesterday. This is a normal technical correction after a significant surge. Today's strategy is for short-term volatility. The overall trend is bullish. While the trend isn't quite clear, we can capitalize on the 1-hour highs and lows to trade. Furthermore, the daily and weekly charts will close today, and hopefully, a bullish candlestick will be seen! If this closes positive, gold will continue to rise next week! 3791 isn't the high point of this rally; 3800 is just around the corner!
Analyzing the 1-hour chart shows a triangle consolidation. Today's chart focuses on a breakout of this correction. The 1-hour correction range is 3722-3762. As long as it remains within this range, buy and sell based on the highs and lows!
If it breaks through 3762, buy gold! If it falls below 3720, sell without a second thought!
Support 3732-3722, Strong Support 3717
Resistance 3753-3758, Strong Resistance 3762
Market Strength Dividing Line 3753
Strategy Signal 1: Sell at 3753-3755
TP 3740-3722
Strategy Signal 2: Buy small if 3740 is not broken! TP 3755
Best Buy Point 3722-3717!

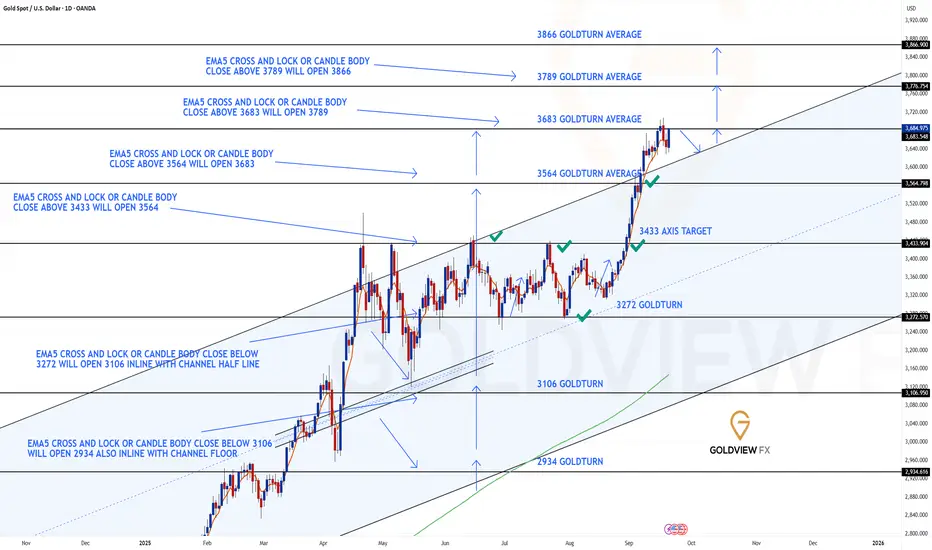
GOLD DAILY CHART ROUTE MAPDaily Chart Update
3683 Target Achieved, Long-Range 3789 Opens
Great finish last week as we got the 3683 target hit following candle body and EMA5 lock above 3564. This clean breakout move confirms the strength of the bullish momentum and completes the next phase of our projected sequence.
We are now seeing candle body close above 3683, which has opened the long-range upside target at 3789. A sustained EMA5 lock above this zone will further confirm continuation strength.
For this momentum to remain healthy, we want to see the channel top act as support on any correction, establishing a solid base for the range expansion. A hold here would validate the breakout structure, while failure to maintain support risks fading back into the channel.
Current Outlook
🔹 3683 Target Reached
Projection played out with precision as the EMA5 lock above 3564 confirmed continuation, giving us the upside completion into 3683.
🔹 Next Objective – 3789
Price action now extends higher, with body closes above 3683 opening the door toward the 3789 target. EMA5 lock here will be the key confirmation for strength.
🔹 Channel Top Support Crucial
The channel top now flips into potential support. Holding above it will sustain the bullish breakout narrative, while any breakdown back below risks a fake-out.
Updated Key Levels
📉 Support – 3433 & 3564
📉 Deeper Support – 3272 (pivotal floor)
📈 Resistance / Next Upside Objective – 3789
Thanks as always for your continued support,
Mr Gold
GoldViewFX
GOLD WEEKLY CHART MID/LONG TERM ROUTE MAPWeekly Chart Update
3659 Retested & Closed Above, 3732 Gap Opens
Last week we saw 3659 tested again, and this time we finished with a weekly candle body close above the level, officially opening the gap toward 3732. This marks a significant step in confirming continuation of the bullish sequence.
At the same time, we must note a detachment left below at 3576. Both 3659 and 3576 now act as correctional support zone levels to keep in mind should price pull back before continuation higher.
Current Outlook
🔹 3659 Retest & Close Above
The weekly body close above 3659 clears resistance and validates upside progression.
🔹 Long-Range Gap Toward 3732
With 3659 cleared, momentum now shifts focus to 3732 as the next upside objective. EMA5 lock confirmation here will further solidify strength.
🔹 Correctional Supports at 3659 & 3576
While the path to 3732 is open, 3659 and 3576 both serve as important levels of support. A healthy correction into these zones would help establish a strong base for continuation.
Updated Levels to Watch
📉 Supports – 3659 & 3576 (correction zones), deeper floor at 3482
📈 Resistance / Next Upside Objective – 3732
Plan
The long-range gap above 3732 is now active. A continuation higher depends on holding recent breakout levels:
Thanks as always for your support,
Mr Gold
GoldViewFX

GOLD 4H CHART ROUTE MAP UPDATE & TRADING PLAN FOR THE WEEKHey Everyone,
Please see our updated 4h chart levels and targets for the coming week.
We are seeing price play between two weighted levels with a gap above at 3696 and a gap below at 3655. We will need to see ema5 cross and lock on either weighted level to determine the next range.
We will see levels tested side by side until one of the weighted levels break and lock to confirm direction for the next range.
We will keep the above in mind when taking buys from dips. Our updated levels and weighted levels will allow us to track the movement down and then catch bounces up.
We will continue to buy dips using our support levels taking 20 to 40 pips. As stated before each of our level structures give 20 to 40 pip bounces, which is enough for a nice entry and exit. If you back test the levels we shared every week for the past 24 months, you can see how effectively they were used to trade with or against short/mid term swings and trends.
The swing range give bigger bounces then our weighted levels that's the difference between weighted levels and swing ranges.
BULLISH TARGET
3696
EMA5 CROSS AND LOCK ABOVE 3696 WILL OPEN THE FOLLOWING BULLISH TARGETS
3738
EMA5 CROSS AND LOCK ABOVE 3738 WILL OPEN THE FOLLOWING BULLISH TARGET
3778
EMA5 CROSS AND LOCK ABOVE 3778 WILL OPEN THE FOLLOWING BULLISH TARGET
3811
EMA5 CROSS AND LOCK ABOVE 3811 WILL OPEN THE FOLLOWING BULLISH TARGET
3845
BEARISH TARGETS
3655
EMA5 CROSS AND LOCK BELOW 3655 WILL OPEN THE FOLLOWING BEARISH TARGET
3615
EMA5 CROSS AND LOCK BELOW 3615 WILL OPEN THE FOLLOWING BEARISH TARGET
3583
EMA5 CROSS AND LOCK BELOW 3583 WILL OPEN THE SWING RANGE
3546
3509
EMA5 CROSS AND LOCK BELOW 3509 WILL OPEN THE SECONDARY SWING RANGE
3458
3409
As always, we will keep you all updated with regular updates throughout the week and how we manage the active ideas and setups. Thank you all for your likes, comments and follows, we really appreciate it!
Mr Gold
GoldViewFX

GOLD → The rally continues. We are waiting for a pullback to buyFX:XAUUSD is rallying since the opening of the trading session. The movement has been continuing since Friday, after the end of the correction. The market is realizing the potential for interest rate cuts...
The metal is showing gains for the fifth week in a row, despite the local recovery of the dollar.
Key supporting factors: The forecast of two rate cuts before the end of the year continues to fuel interest. Tensions in US trade relations with India and other sources of instability. Upcoming PCE data on Friday may confirm the need for a soft policy. BUT! Caution is needed, as a short-term correction (profit-taking) is possible after record growth.
Resistance levels: 3730, 3740, 3750
Support levels: 3703, 3685, 3674
The price is in the ATH zone, having come a long way since the opening of the session, and a correction may form. It is dangerous to sell in the current zone, and for trading within the bullish trend, it is worth waiting for a pullback to the nearest local support levels...
Best regards, R. Linda!

XAUUSD SELL TRADE SETUP📊XAU/USD SELL Trade Setup
Date: 09/24/25
🔵 Entry Details: 3,765.69
🔴 Stop Loss (SL): 3,776.64
✅ Take Profits (TP):
TP1: 3,750
TP2: 3,740
TP3: 3,731
📐 Risk to Reward (RR):
1% Risk
Approximate RR: 1:3

XAUUSD Journey Recap – Target Reached (3870+)✅ The Journey So Far
From our earlier case studies (shared step by step since 2700+ levels), we tracked XAUUSD through:
Head & Shoulders formations
Bullish engulfing + Evening/Morning star traps
Sustaining confirmations above 3752–3767 levels
Every stage was a battle between fear & patience. The market respected our ranges and eventually fulfilled the higher targets near 3808+.
📊 Lessons Learned
Win Ratio Improves with Structure – Our mapped levels and confirmation rules gave us a high success rate.
Patience Pays – Holding through retracements was tough emotionally, but the trend rewarded discipline.
Psychology Matters More Than Prediction – Early exits or over-leverage would have spoiled the journey. Those who followed structure reaped steady gains.
Case Study Value – Each analysis became a live classroom for risk, timing, and conviction.
🧭 Win Ratio Overview
Majority of setups hit targets with minor SL hits on traps.
Consistency > Accuracy → Even when a pattern failed (morning star fakeout), recovery came with discipline.
Net outcome = Profitable series.
🔔 Closing This Series
This chapter concludes with our final target reached at 3808+.
We now close this cycle of case studies with gratitude – every move was a teacher.
🚩 What’s Next?
From here, we begin a fresh series of XAUUSD case studies, with renewed levels, updated strategies, and deeper psychological integration.
⚠️ This is an educational case study, not financial advice. Trade at your own risk.
#XAUUSD #Gold #TradingCaseStudy #PriceAction #RiskManagement #MultiTimeframeAnalysis #Tradyoga #Yogeshonale

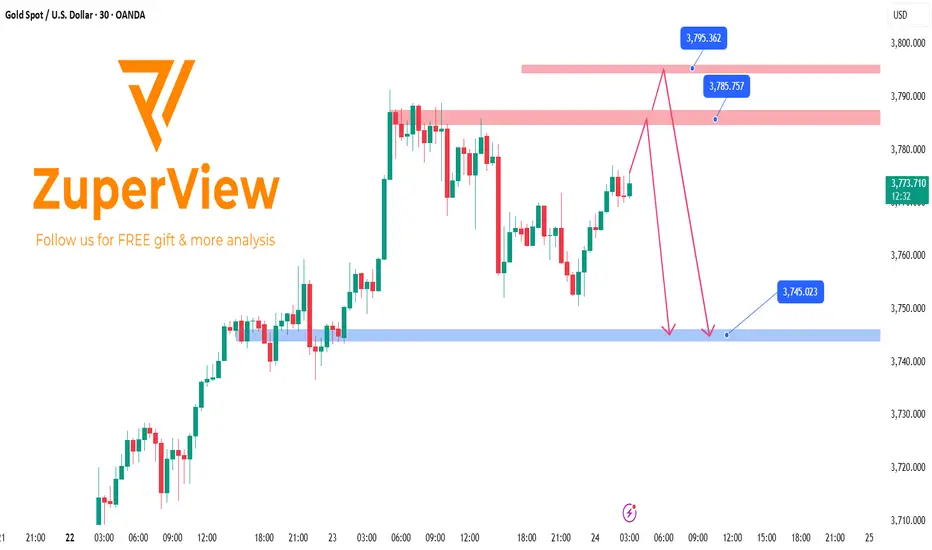
XAUUSD: Could 3790 Be the Top?After the 3740 → 3790 rally, upside momentum has weakened . Therefore, 3790 is likely a temporary top , and a short-term pullback may begin from here. However, we cannot rule out a retest of the top area or even a marginal higher high today before a sharper correction develops.
📉 Analysis
• After the push to 3,790 , price rotated within 3,778–3,788 and then broke the lower bound (3,778) on high volume . This supports the view that a swing high formed at 3,790 . However, price is currently drifting higher on lighter volume , so a retest of the top or even a marginal higher high before the pullback remains possible.
• Resistance zones: 3,784.5–3,787, 3,794–3,796 .
• Key support zones: 3,746–3,744, 3,723–3,718.
📊 Trading Plan
• Wait for reversal signals with heavy volume at the marked support/resistance zones.
• Highest-probability trigger: an 5m engulfing candle with high volume when price taps these levels.
Example: As in ENTRY 1 , if an 5m engulfing candle prints with high volume (as indicated by Superior Volume ) at a marked support/resistance zone, entry on the candle close .
• Entry on the signal and place the stop just above the signal candle (or above the resistance zone ). Move to break-even at +1R .
Gold keeps hitting new highs, let’s see how I cope with it! Before updating my views, I would like to remind all my friends again: the market is always full of possibilities. There is no so-called "highest point", only higher possibilities. When the trend is clearly upward, going with the flow is the core strategy to achieve stable profits. Avoid trading against the trend or on an emotional basis, especially in the current volatile market environment. Trading without clear thinking and discipline can easily lead to unnecessary losses. For those who are still on the sidelines and haven't yet developed an effective trading strategy, please follow my channel. We will continue to provide professional market analysis, comprehensive trading plans, and precise buy and sell instructions to help you better grasp the market's rhythm.
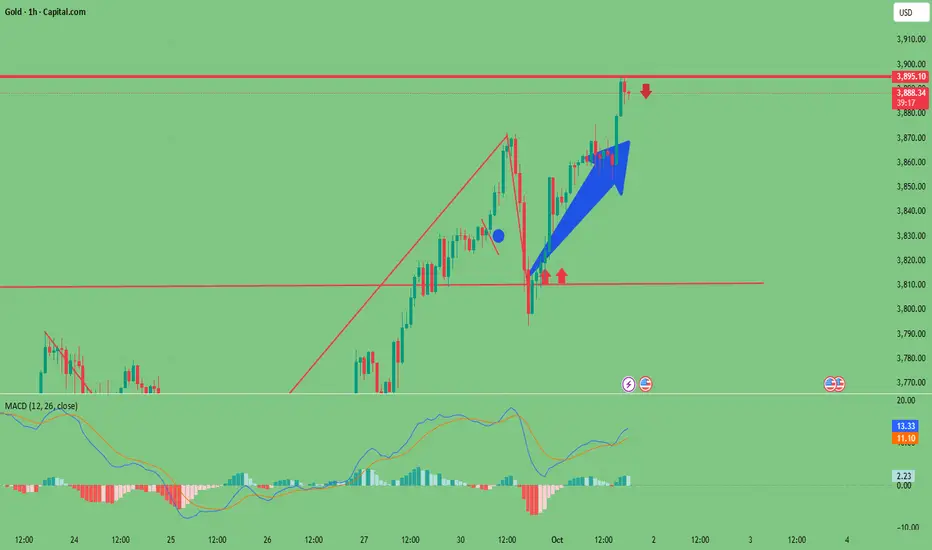
Every recent pullback in gold prices has shown the characteristics of consolidating the foundation for the rise, with highs continuing to move up and bulls significantly strengthened. The current price is once again approaching the key integer mark of 3900, which is the second important integer mark price this week and also the core area of the game between bulls and bears.
Despite the strong performance of bulls, from a technical perspective, there is pressure from profit-taking on buying orders and psychological suppression of integer levels. In the short term, the possibility of gold prices effectively stabilizing at 3,900 during the day is relatively limited. Even if the upward trend remains strong, the market still needs to accumulate energy through periodic pullbacks. Based on the current trend analysis, it is expected that the gold price may hit the 3900 mark again, and may even briefly break through this level before falling back.
Based on the above analysis, it is recommended that today's trading strategy can be to arrange short orders in the range of 3895 to 3905 by building positions in batches, and formulate a plan to cover positions in advance, while being alert to the risk of recurrence of short-term market wash-out.
The following are my personal opinions. If you agree, please like and follow me! If you have better trading ideas, you can also leave a message in the comment section to share them!
ANFIBO | XAUUSD this week. I'm still bullish up to $3880/ozHi guys, Anfibo's here!
OANDA:XAUUSD Analysis – Start of the Week
Overall Picture:
As I predicted earlier, gold has skyrocketed past the $3,800/oz mark, delivering more than 700 pips of profit from the strategy I previously outlined . This is clear evidence of the strength of the prevailing bullish trend, as safe-haven flows continue to pour into gold amid ongoing global economic uncertainties.
Looking ahead to this week, the outlook remains in favor of the bulls. If no adverse news emerges, I believe gold is highly likely to continue its breakout and challenge the $3,880/oz level – the next key resistance zone.
Technical Outlook:
Short-term trend: Strong increase, momentum remains stable on H4 and Daily frames.
> SUPPORT KEY / BUY ZONES : 3800- 3787 - 3750 - 3723 - 3713 - 3703
> RESISTANCE KEY / SELL ZONES : 3825 - 3835 - 3865 - 3880
Here's my Trading Plan today:
>>> SELL ZONE:
ENTRY: 3834 - 3836
SL: 3840
TP: 3800 - 3790
>>> BUY ZONE:
ENTRY: 3790 - 3800
SL: 3780
TP: 3825 - 3835 - 3865
Risk Management:
- Prioritize buy trades in line with the dominant trend, limit countertrend shorts.
- Maintain a R:R ratio of at least 1:2 on all setups.
- Manage capital strictly, avoid overtrading during sideways phases before breakout.
HAVE A GREAT WEEK, GUYS!!!

XAU/USD - TRADER EDGE🎯 KEY PIVOT ZONE
DEMAND ZONE: 3,840.00-3,865.00
➡️3 POC lines converge with prominent VRVP node forming active support
➡️Recent consolidation area absorbing selling pressure with bullish structure
➡️Price currently WITHIN pivot - holding at demand zone
📊 PRICE TARGETS
UPSIDE TARGETS ⬆️
T1: 3,920.00-3,945.00
T2: 3,980.00-4,010.00
DOWNSIDE TARGETS ⬇️
T1: 3,780.00-3,810.00
T2: 3,720.00-3,750.00
⚡💎⚡ EDGE - HIGHEST PROBABILITY PLAY
Long from 3,845.00-3,855.00 bounce targeting 3,920.00-3,945.00 then 3,980.00-4,010.00
🔍 PRE-ENTRY CONFIRMATION SIGNALS
✅ Price dips to 3,850.00 or below showing bullish reversal candle (hammer/pin bar)
✅ Higher low formation above 3,840.00 with upward momentum confirmation
✅ Volume spike on bounce confirming institutional buying interest
📈 TRADE SETUP
🟢PRIMARY BIAS: BULLISH
Long Setup:
Entry: 3,846.00-3,854.00 after confirmations
Stop Loss: 3,825.00
🎯Target 1: 3,920.00-3,945.00
🎯Target 2: 3,980.00-4,010.00
Risk/Reward: 1:2.5 / 1:4.8
🔄 BIAS FLIP CONDITIONS
🔴TURNS BEARISH IF:
Decisive break and 2H close below 3,835.00
Volume expansion exceeds 1.5x average on breakdown
Failed retest of 3,845.00-3,860.00 as new resistance
⚡Then Target:
🎯3,780.00-3,810.00
🎯3,720.00-3,750.00
⚠️ RISK MANAGEMENT
Max Risk: $28 per 0.01 lot ($2,800 per standard lot)
Position Size: Risk 1-2% of account capital
Time Stop: Only trade within LONDON, EUROZONE & NYSE's peak volume segments

Gold continues to hit new highs; avoid chasing highs.Market expectations of further Federal Reserve easing and the risk of a US government shutdown have fueled safe-haven demand, supporting the continued rise in gold prices, pushing them to new all-time highs. Gold maintains a bullish trend and avoids guessing at the top. Trading principles prioritize buying on dips. Monday's gold trend mirrored last Monday's, showing potential for a unilateral uptrend.
Gold's rapid rise has been accompanied by no pullback. However, if this market trend continues, it could represent a market shakeout. The higher the price, the greater the risk of a sharp decline. It's advisable to continue investing in gold during price pullbacks. Maintain a bullish stance, but avoid blindly chasing gains. From a technical perspective, some pullbacks are necessary, so avoid blindly chasing highs to avoid market volatility and a pullback.
Gold's current bullish trend on the weekly and daily charts indicates the bullish trend is not over. It's simply because a pullback after a sharp rise is likely, and a pullback could be a good time to enter a long position.

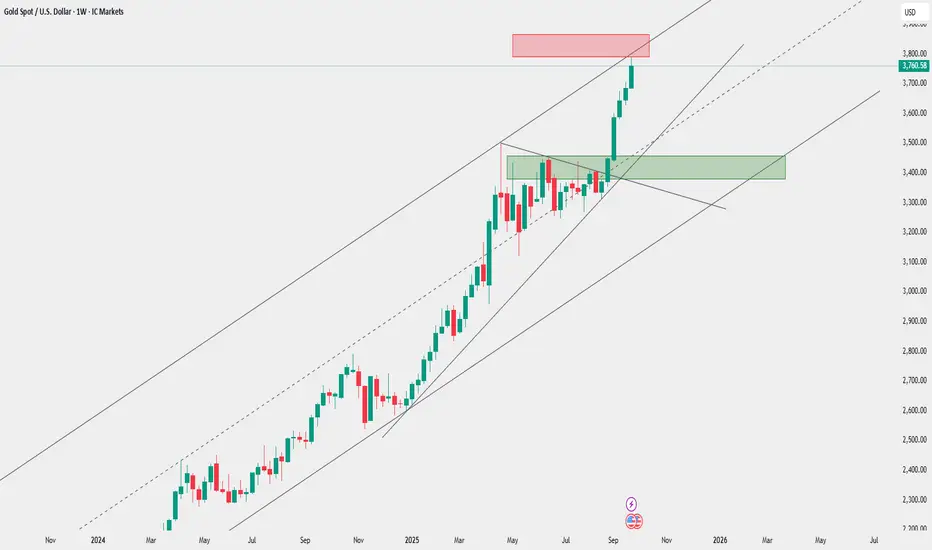
XAU/USD | GOLD Weekly AnalysisOverall Analysis View:
The chart depicts a sustained bullish trend through 2025–2026, featuring recent consolidation that hints at impending upward momentum upon breakout. If price reaches these key areas and important trend lines, we can take buy signals (in support areas with bullish trend confluence) or sell signals (in resistance areas with bearish trend confluence)—of course with proper risk management.
Key Confluence Note:
The drawn zones hold validity solely when combined with the trend lines for reliable setups—isolated use diminishes their credibility.
Buy gold to supply $$$Hello, traders!
My previous forecast was slightly off, as the price didn't show the liquidity grab I was expecting. Therefore, I adjusted my plan.
My new plan was to wait for the price to complete one swing up and then find an entry if it retraced before reaching the anticipated supply zone. As you can see in the image, I decided to enter the trade using a smaller than usual lot size. I must admit, I wasn't thrilled with this price zone, but I felt there was enough probability to justify an entry.
The H4 swing on gold is still bearish. I believe the price will pull back to the supply zone (SZ) before continuing its move down to the discount zone. However, there are still opportunities to trade this pullback. The best and highest-probability trade would be to wait for a short signal at the SZ, as this would offer a better risk-to-reward ratio.
My reasons for entering this trade were:
The price broke down on the M15 timeframe and retraced into the demand zone I had anticipated.
The previous high shows good liquidity, which will likely act as fuel to push the price toward the SZ.
Targets:
The anticipated supply zone (SZ).
If the price breaks the previous high, I will move my stop-loss to breakeven.

The opportunity for gold short position at 3780-3790 is hereThe gold market saw a slight rebound after opening today, indicating that bulls and bears are still in a game in the short term. Although prices have rebounded, the overall trend has not yet broken away from the previously formed range of fluctuations, indicating that market sentiment is relatively cautious. From a technical perspective, gold prices have recently attempted to rise many times but have failed to effectively break through the key resistance area, indicating that the selling pressure from above is still relatively obvious. Combining last week's trading performance, prices repeatedly encountered resistance and retreated within the 3775-3785 range, forming a relatively clear technical resistance zone and providing a valuable trading reference.
In this context, today's trading strategy can continue last week's overall thinking and maintain a judgment framework based on range fluctuations. If the gold price rebounds to the 3780 to 3790 area during the session and then shows signs of pressure again, such as a long upper shadow or insufficient trading volume, investors may consider establishing short positions in batches within this range and set reasonable stop-loss levels to control risks. At the same time, it is important to closely monitor the market's reaction to key economic data or macroeconomic policy developments, particularly changes in the US dollar index and US Treasury yields, as these factors will directly influence gold's short-term trend.
Furthermore, the market is currently at a critical stage of selecting a corrective direction. If prices effectively break through previous highs and stabilize above the range, this could trigger a surge in technical buying, necessitating timely adjustments to holding strategies. Conversely, if prices fall below the lower limit of the range, the downward trend could accelerate. Therefore, before a clear breakthrough signal appears, it is recommended to wait and see or adopt a high-selling and low-buying approach to avoid blindly chasing highs and selling lows. Overall, a cautious approach is recommended at this stage, combining technical indicators with market dynamics to respond flexibly and enhance trading discipline and success rates.

Gold (Sep 22–26): Can Bulls Defend $3,700 as ETF Inflows Slow?1. Institutional Forecast Updates
Goldman Sachs (Sep 4, 2025): Targets $3,700/oz for Q4 2025 and $4,000/oz for Q2 2026.
J.P. Morgan (Apr 22, 2025): Projects $3,650/oz for Q4 2025 and sees prices above $4,000/oz by Q2 2026.
References:
www.reuters.com
www.reuters.com
2. Key Drivers & Risks
🟪 Gold ETF flows: Gold-backed ETF inflows surged in 2025, but high prices have caused those inflows to slow.
🟧 Central Bank Statistics: Central bank demand increased in 2025, but they largely held their reserves with little buying or selling.
🟨 Markets are anticipating further Fed rate cuts, which would lower real interest rates and reduce the opportunity cost of holding gold.
🟩 Political and geopolitical tensions have eased recently, with no new developments providing additional support for gold prices.
🟦 The economic environment appears stable (the S&P 500 VIX is currently low), which could shift capital toward higher-risk markets.
⇨ There are no clear signs of a sustained decline in gold prices, but caution is advised around the $3,700/oz level, as institutional inflows are weakening and downside risks are present.
Source: World Gold Council
3. 🏦📊 Technical Analysis
* Trend: assessed using at least three trend indicators, with market structure as the primary guide.
** Weak or Reversal Signals: Assessed based on one of our criteria for trend reversal signals.
*** Support/Resistance: Selected from multiple factors – static (Swing High, Swing Low, etc.), dynamic (EMA, MA, etc.), psychological (Fibonacci, RSI, etc.) – and determined based on the trader’s discretion.
**** Our advice takes into account all factors, including both fundamental and technical analysis. It is not intended as a profit target. We hope it can serve as a reference to help you trade more effectively. This advice is for informational purposes only and we assume no responsibility for any trading results based on it.
How do you think about this idea? Let us know your thoughts below :)
