Gold keeps hitting new highs, let’s see how I cope with it! Before updating my views, I would like to remind all my friends again: the market is always full of possibilities. There is no so-called "highest point", only higher possibilities. When the trend is clearly upward, going with the flow is the core strategy to achieve stable profits. Avoid trading against the trend or on an emotional basis, especially in the current volatile market environment. Trading without clear thinking and discipline can easily lead to unnecessary losses. For those who are still on the sidelines and haven't yet developed an effective trading strategy, please follow my channel. We will continue to provide professional market analysis, comprehensive trading plans, and precise buy and sell instructions to help you better grasp the market's rhythm.
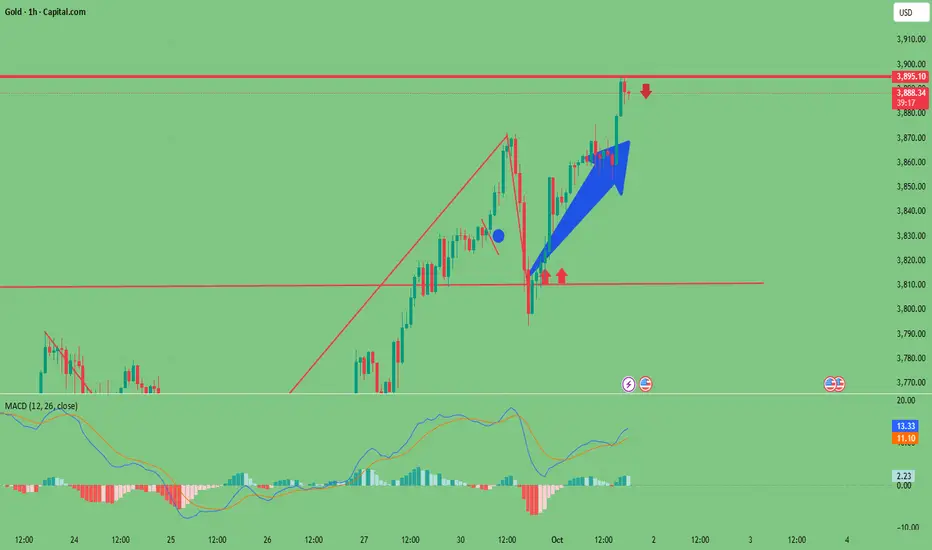
Every recent pullback in gold prices has shown the characteristics of consolidating the foundation for the rise, with highs continuing to move up and bulls significantly strengthened. The current price is once again approaching the key integer mark of 3900, which is the second important integer mark price this week and also the core area of the game between bulls and bears.
Despite the strong performance of bulls, from a technical perspective, there is pressure from profit-taking on buying orders and psychological suppression of integer levels. In the short term, the possibility of gold prices effectively stabilizing at 3,900 during the day is relatively limited. Even if the upward trend remains strong, the market still needs to accumulate energy through periodic pullbacks. Based on the current trend analysis, it is expected that the gold price may hit the 3900 mark again, and may even briefly break through this level before falling back.
Based on the above analysis, it is recommended that today's trading strategy can be to arrange short orders in the range of 3895 to 3905 by building positions in batches, and formulate a plan to cover positions in advance, while being alert to the risk of recurrence of short-term market wash-out.
The following are my personal opinions. If you agree, please like and follow me! If you have better trading ideas, you can also leave a message in the comment section to share them!
GOLDCFD trade ideas
ANFIBO | XAUUSD this week. I'm still bullish up to $3880/ozHi guys, Anfibo's here!
OANDA:XAUUSD Analysis – Start of the Week
Overall Picture:
As I predicted earlier, gold has skyrocketed past the $3,800/oz mark, delivering more than 700 pips of profit from the strategy I previously outlined . This is clear evidence of the strength of the prevailing bullish trend, as safe-haven flows continue to pour into gold amid ongoing global economic uncertainties.
Looking ahead to this week, the outlook remains in favor of the bulls. If no adverse news emerges, I believe gold is highly likely to continue its breakout and challenge the $3,880/oz level – the next key resistance zone.
Technical Outlook:
Short-term trend: Strong increase, momentum remains stable on H4 and Daily frames.
> SUPPORT KEY / BUY ZONES : 3800- 3787 - 3750 - 3723 - 3713 - 3703
> RESISTANCE KEY / SELL ZONES : 3825 - 3835 - 3865 - 3880
Here's my Trading Plan today:
>>> SELL ZONE:
ENTRY: 3834 - 3836
SL: 3840
TP: 3800 - 3790
>>> BUY ZONE:
ENTRY: 3790 - 3800
SL: 3780
TP: 3825 - 3835 - 3865
Risk Management:
- Prioritize buy trades in line with the dominant trend, limit countertrend shorts.
- Maintain a R:R ratio of at least 1:2 on all setups.
- Manage capital strictly, avoid overtrading during sideways phases before breakout.
HAVE A GREAT WEEK, GUYS!!!

XAU/USD - TRADER EDGE🎯 KEY PIVOT ZONE
DEMAND ZONE: 3,840.00-3,865.00
➡️3 POC lines converge with prominent VRVP node forming active support
➡️Recent consolidation area absorbing selling pressure with bullish structure
➡️Price currently WITHIN pivot - holding at demand zone
📊 PRICE TARGETS
UPSIDE TARGETS ⬆️
T1: 3,920.00-3,945.00
T2: 3,980.00-4,010.00
DOWNSIDE TARGETS ⬇️
T1: 3,780.00-3,810.00
T2: 3,720.00-3,750.00
⚡💎⚡ EDGE - HIGHEST PROBABILITY PLAY
Long from 3,845.00-3,855.00 bounce targeting 3,920.00-3,945.00 then 3,980.00-4,010.00
🔍 PRE-ENTRY CONFIRMATION SIGNALS
✅ Price dips to 3,850.00 or below showing bullish reversal candle (hammer/pin bar)
✅ Higher low formation above 3,840.00 with upward momentum confirmation
✅ Volume spike on bounce confirming institutional buying interest
📈 TRADE SETUP
🟢PRIMARY BIAS: BULLISH
Long Setup:
Entry: 3,846.00-3,854.00 after confirmations
Stop Loss: 3,825.00
🎯Target 1: 3,920.00-3,945.00
🎯Target 2: 3,980.00-4,010.00
Risk/Reward: 1:2.5 / 1:4.8
🔄 BIAS FLIP CONDITIONS
🔴TURNS BEARISH IF:
Decisive break and 2H close below 3,835.00
Volume expansion exceeds 1.5x average on breakdown
Failed retest of 3,845.00-3,860.00 as new resistance
⚡Then Target:
🎯3,780.00-3,810.00
🎯3,720.00-3,750.00
⚠️ RISK MANAGEMENT
Max Risk: $28 per 0.01 lot ($2,800 per standard lot)
Position Size: Risk 1-2% of account capital
Time Stop: Only trade within LONDON, EUROZONE & NYSE's peak volume segments

Gold continues to hit new highs; avoid chasing highs.Market expectations of further Federal Reserve easing and the risk of a US government shutdown have fueled safe-haven demand, supporting the continued rise in gold prices, pushing them to new all-time highs. Gold maintains a bullish trend and avoids guessing at the top. Trading principles prioritize buying on dips. Monday's gold trend mirrored last Monday's, showing potential for a unilateral uptrend.
Gold's rapid rise has been accompanied by no pullback. However, if this market trend continues, it could represent a market shakeout. The higher the price, the greater the risk of a sharp decline. It's advisable to continue investing in gold during price pullbacks. Maintain a bullish stance, but avoid blindly chasing gains. From a technical perspective, some pullbacks are necessary, so avoid blindly chasing highs to avoid market volatility and a pullback.
Gold's current bullish trend on the weekly and daily charts indicates the bullish trend is not over. It's simply because a pullback after a sharp rise is likely, and a pullback could be a good time to enter a long position.

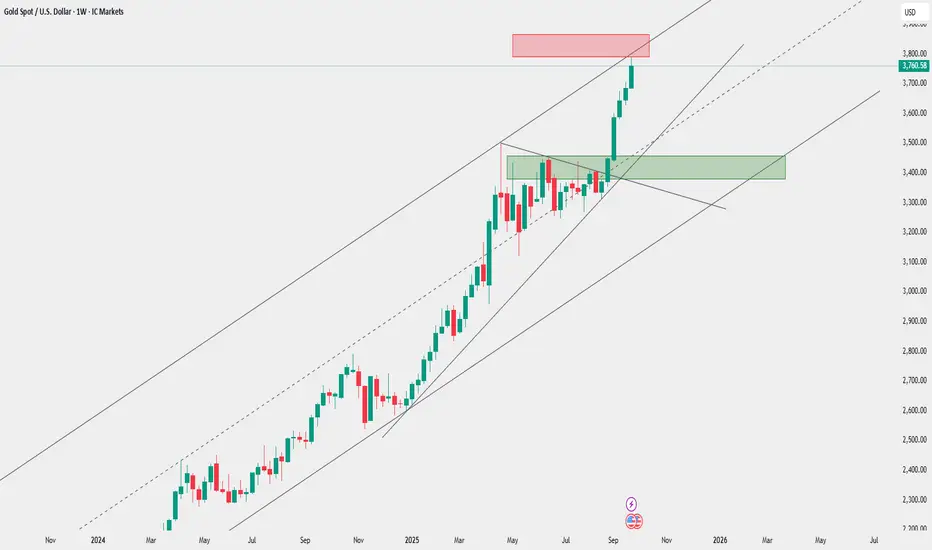
XAU/USD | GOLD Weekly AnalysisOverall Analysis View:
The chart depicts a sustained bullish trend through 2025–2026, featuring recent consolidation that hints at impending upward momentum upon breakout. If price reaches these key areas and important trend lines, we can take buy signals (in support areas with bullish trend confluence) or sell signals (in resistance areas with bearish trend confluence)—of course with proper risk management.
Key Confluence Note:
The drawn zones hold validity solely when combined with the trend lines for reliable setups—isolated use diminishes their credibility.
Buy gold to supply $$$Hello, traders!
My previous forecast was slightly off, as the price didn't show the liquidity grab I was expecting. Therefore, I adjusted my plan.
My new plan was to wait for the price to complete one swing up and then find an entry if it retraced before reaching the anticipated supply zone. As you can see in the image, I decided to enter the trade using a smaller than usual lot size. I must admit, I wasn't thrilled with this price zone, but I felt there was enough probability to justify an entry.
The H4 swing on gold is still bearish. I believe the price will pull back to the supply zone (SZ) before continuing its move down to the discount zone. However, there are still opportunities to trade this pullback. The best and highest-probability trade would be to wait for a short signal at the SZ, as this would offer a better risk-to-reward ratio.
My reasons for entering this trade were:
The price broke down on the M15 timeframe and retraced into the demand zone I had anticipated.
The previous high shows good liquidity, which will likely act as fuel to push the price toward the SZ.
Targets:
The anticipated supply zone (SZ).
If the price breaks the previous high, I will move my stop-loss to breakeven.

The opportunity for gold short position at 3780-3790 is hereThe gold market saw a slight rebound after opening today, indicating that bulls and bears are still in a game in the short term. Although prices have rebounded, the overall trend has not yet broken away from the previously formed range of fluctuations, indicating that market sentiment is relatively cautious. From a technical perspective, gold prices have recently attempted to rise many times but have failed to effectively break through the key resistance area, indicating that the selling pressure from above is still relatively obvious. Combining last week's trading performance, prices repeatedly encountered resistance and retreated within the 3775-3785 range, forming a relatively clear technical resistance zone and providing a valuable trading reference.
In this context, today's trading strategy can continue last week's overall thinking and maintain a judgment framework based on range fluctuations. If the gold price rebounds to the 3780 to 3790 area during the session and then shows signs of pressure again, such as a long upper shadow or insufficient trading volume, investors may consider establishing short positions in batches within this range and set reasonable stop-loss levels to control risks. At the same time, it is important to closely monitor the market's reaction to key economic data or macroeconomic policy developments, particularly changes in the US dollar index and US Treasury yields, as these factors will directly influence gold's short-term trend.
Furthermore, the market is currently at a critical stage of selecting a corrective direction. If prices effectively break through previous highs and stabilize above the range, this could trigger a surge in technical buying, necessitating timely adjustments to holding strategies. Conversely, if prices fall below the lower limit of the range, the downward trend could accelerate. Therefore, before a clear breakthrough signal appears, it is recommended to wait and see or adopt a high-selling and low-buying approach to avoid blindly chasing highs and selling lows. Overall, a cautious approach is recommended at this stage, combining technical indicators with market dynamics to respond flexibly and enhance trading discipline and success rates.

gold analysis 30/9/2025 ( The Gold Map )Based on gold analysis using My own strategy that I use digital analysis combined with mathematics and physics :
Selling Zones :
3869 - 3881
3901 - 3922
3936 - 3951
3976 - 3994
4008 - 4020
4033 - 4056
4101 - 4118
4137 - 4157
4187 - 4202
4264 - 4285
4346 - 4362
buying zones
3778 - 3764
3751 - 3761
3717 - 3738
3693 - 3710
3670 - 3688
3654 - 3668
3636 - 3648
3612 - 3628
3596 - 3607
3561 - 3579
3503 - 3523

GOLD PLAN TODAY | XAUUSD SEP.30 ☄️ Gold Market Outlook 09/ 30 (Based on SMC) ☄️
📊Trend Analysis
🔤Price is at 3865+, marking a continuation of the strong bullish trend.
🔤Clear BOS (Break of Structure) at multiple levels confirms order flow remains bullish.
🔤Several FVGs are stacked below (3,850 – 3,835 – 3,800), acting as potential demand zones where Smart Money may retrace to fill liquidity gaps.
🔤No CHoCH (Change of Character) yet → trend bias stays bullish.
💡 Trading Plan
🔼Scenario 1: Buy on Shallow Retracement
Entry: 3850 – 3855 (first FVG zone).
Reason: Trend continuation, price often respects first FVG in strong bullish momentum.
Condition: Wait for bullish rejection on M5/M15.
🔼Scenario 2: Buy on Deeper Retracement
Entry: 3835 – 3840 (second FVG).
Reason: High-probability demand zone where liquidity may be collected.
Condition: Look for BOS upwards on lower timeframe before entering.
🔼Scenario 3: Breakout Buy
Entry: On a clean BOS above 3870 with retest confirmation.
Reason: If momentum continues without retracement, Smart Money may drive price higher directly.
Condition: Candle close above 3870 + retest as support.

#GOLD is trading around $3,860. Earlier in my premium channel, #GOLD is trading around $3,860. Earlier in my premium channel, I mentioned that confirmation above $4,000 could open the path toward $4,800 when gold was trading near $3,000.
🔸 Key Support Zone at $3,250–$3,550:
Price is currently mixed around $3,900–$4,000, with a real chance of cooling down toward $3,400–$3,200 before resuming higher. This remains a strong accumulation zone.
🔸 Upside Target: $4,700–$4,800
The long-term bullish outlook is intact, with targets above $4,700 once the consolidation phase ends.
🔸 Risk Level at $3,200:
A breakdown below $3,200 would invalidate the bullish scenario and open the door for deeper downside.
🔸 Outlook:
If you are holding: Stay patient and keep positions for the upside target.
If you are not holding: Fresh buying opportunities may come near $3,500–$3,200.

Gold Price Analysis — XAU/USD (Daily)Overview:
Gold has staged an impressive rally, climbing from the 3,200–3,300 area to the 3,870 region within a strong bullish structure. Price action shows higher highs and higher lows, signaling continued demand from buyers.
Technical Outlook:
• Trend: Both the medium- and long-term trends remain bullish, with price above the 50-day and 200-day moving averages.
• Momentum: Strong upward momentum confirmed by MACD histogram expansion and RSI hovering near overbought territory (~70).
• Key Levels:
• Resistance: ~3,900 (psychological & structural level).
• Support: 3,400–3,600 zone.
Trading Scenarios:
1. Bullish Continuation:
• Enter on pullbacks to support (3,600–3,700).
• Targets: 3,950–4,000.
• Use trailing stop to secure profits.
2. Rejection at Resistance (~3,900):
• Look for bearish candlestick patterns (pin bar, engulfing).
• Short-term correction toward 3,400–3,200.
• Stop-loss above 3,920 to manage risk.
3. Breakout Play:
• If price closes above 3,900 decisively with volume, expect continuation toward 4,100+.
• Ideal for breakout traders with risk managed via tight SL below breakout candle.
Risk Management:
• Do not risk more than 1–2% per trade.
• Use trailing stops to lock in gains.
• Accept losing trades early; capital preservation is priority.
Conclusion:
Bias remains bullish while above 3,600. Traders should monitor the 3,900 level closely — a breakout could extend the rally, while rejection could trigger a corrective pullback.

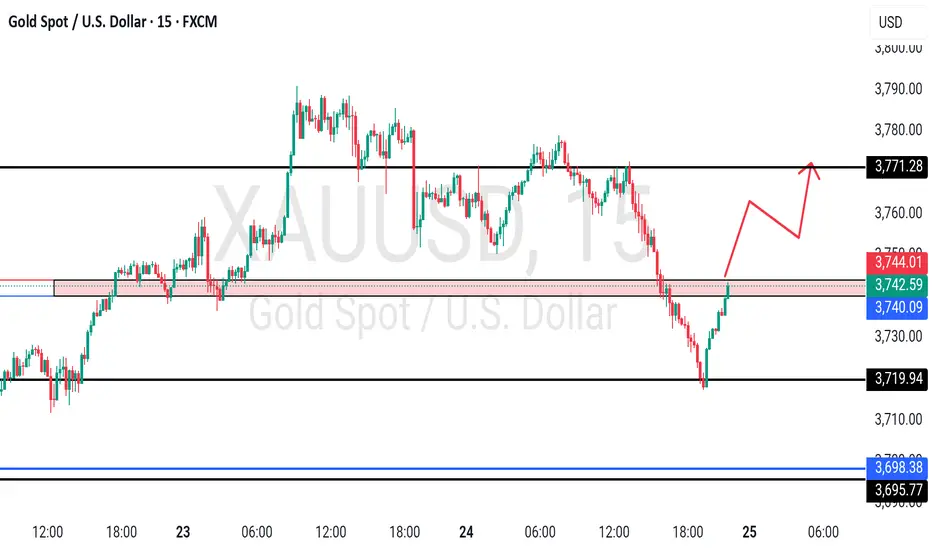
GOLD at breakout region? What's next??#GOLD - after a fantastic move now market again at his breakout area.
3740-45 that will be our current resistance area and above that we can expect again further rise.
Keep close and don't hold your shorts above that.
Good luck
Trade wisley
Will gold fall back on September 24th?
Key Strategy: Follow the trend, but be wary of a reversal risk after an extreme short squeeze.
I. Comprehensive Analysis
The current gold market is showing a strong bullish trend, with fundamentals and technicals in sync. The Fed's rate cuts and Powell's "two-way risk" comments have provided macroeconomic support for gold; while the strong technical breakout and short squeeze have accelerated the price increase. However, given the significant gains, caution is warranted as any deeper pullback could signal a reversal in the short-term trend.
Trend Direction: Bullish
Trading Style: Invest primarily on dips, cautiously chase higher prices, and avoid shorting against the trend for now.
Key risk points: Technical pullback caused by sudden changes in market sentiment and profit-taking.
II. Core Fundamental Drivers
Federal Reserve Policy Tone: After last week's 25 basis point rate cut, Powell confirmed that policy remains "moderately restrictive," opening the door to further rate cuts. This is bearish for the US dollar and bullish for gold.
"Two-Way Risk" Positioning: The Federal Reserve acknowledges the dilemma between curbing inflation and maintaining employment and frames this rate cut as "risk management." This uncertain environment enhances gold's safe-haven appeal.
External factors: We need to continue to pay attention to external factors such as tariffs that may put upward pressure on inflation. If inflation expectations pick up, it will strengthen the anti-inflation properties of gold.
III. Detailed Technical Analysis
Daily Chart:
Consecutive large bullish candlesticks have broken through previous highs, demonstrating extremely strong bullish momentum.
Price remains firmly above the 5-day moving average, with the Bollinger Bands opening upward, indicating a clear trend.
Theoretical target: Referring to the increase in April (US$540), the theoretical limit target of this round of increase is in the US$3850-3900 area. But it should be noted that this is a goal under extreme circumstances, and the current market is already in an acceleration phase.
4-Hour and Hourly Charts:
The market exhibits a perfect unilateral upward trend, with the candlestick chart moving along the upper Bollinger Band, and minimal pullbacks (short squeeze characteristics). Key Support Areas:
First Support: Near $3750-3760 (Nearest intraday support).
Second support: $3735-3740 area (an important defensive position for strong bulls).
Core Support: $3725-3728.
Resistance:
Near-term resistance: $3790-3800 (Important psychological and technical barrier).
IV. Specific Trading Strategies
Main Strategy: Buy on dips
Aggressive Long:
Entry Time: When the price pulls back to the $3750-3760 area and a sign of stabilization appears (such as a bullish candlestick with a lower shadow on a short-term chart).
Stop Loss: Set below $3745.
Target: Targeting the $3780-3790 area, gradually reduce your position.
Conservative Long:
Entry Time: Buy on a deep pullback to the $3730-3735 area and stabilize. Stop-loss: Set below 3725.
Target: Also targeting the 3780-3800 area.
Secondary Strategy: Short-term short selling upon encountering resistance at high levels (proceed with caution).
Strategy: This strategy is only suitable for experienced traders and is designed to speculate on pullbacks to key resistance levels. A small position and strict discipline are required.
Entry Time: The price first touches the 3790-3800 area and a clear resistance signal (such as a long upper shadow or bearish engulfing candlestick pattern) appears.
Stop-loss: Set above 3810.
Target: Short-term target: 3760-3750.
V. Risk Warning and Position Management
Short Squeeze Risk: Any contrarian short selling carries significant risks.
Reversal Risk: The price has already accumulated significant gains. A pullback below the key support level of 3708 could trigger a larger technical correction, necessitating a timely exit of long positions.
Position management: Be sure to operate with a light position and set a stop loss. In a market with increasing volatility, avoid being wiped out by short-term fluctuations due to excessive positions.

GOLD M30 – SHORT-TERM SETUP (NEW YORK SESSION UPDATE)Hello traders 👋
On the M30 chart, the ascending trendline shows signs of a breakdown. However, the bearish momentum is not yet convincing, as selling volume remains relatively weak. This suggests caution, but also highlights a possible short-term pullback opportunity.
🔎 Key Level to Watch
The 3,855 – 3,860 zone is the critical confirmation area.
A decisive break below this level would strengthen bearish momentum and open the way for deeper downside.
⚖️ Trade Idea
🔴 Short-term Sell Setup:
Entry: 3,880 – 3,878 (on a retest of the broken trendline)
Stop loss: 3,885
Take profit: 3,862 → 3,845 → 3,822
👉 Note: This is a counter-trend trade. Wait for clear rejection candles at the entry zone to improve the win rate.
📊 Market View
The broader trend remains bullish, but short-term weakness on M30 suggests a corrective move may be unfolding.
Sell setups should be treated as scalps, while dip-buying remains the higher-probability strategy in line with the main trend.
📌 Conclusion:
For the New York session, watch for a potential corrective drop. Selling near 3,875 – 3,878 could provide short-term opportunities, but strict risk management is essential as this setup goes against the prevailing trend.

Bulls Charge Ahead—Gold’s Path to 3835–3845Brothers, it seems that we were too conservative in setting the TP. Now gold has broken through 3810, far exceeding the TP: 3785 set in our last long transaction.
Because a large amount of safe-haven buying funds poured into the gold market, it continued to set new historical highs, stimulating gold to break through 3800 and continue its rise to above 3810, fully highlighting the strong bullish sentiment in the market. At present, with the support of fundamental factors that are bullish for gold, it is difficult for the gold market to reverse in a short period of time. At best, it is just a short-term adjustment.
In addition, we can look for wave patterns from the candlestick chart. From the previous trend, it is not difficult to see that after a short-term consolidation, gold will pull up and retrace to form a secondary low point, and then it will wave again to $75-80 to reach a new high. Then according to this rule, after the volatile rise, gold formed a secondary low near 3760 on Friday. If we look up to the fluctuation range of $75-80, gold is likely to continue to rise to the 3835-3845 area.
So, for current short-term trading. First of all, we still consider going long on gold.
1. If gold first retreats to the 3800-3790 area, we can prioritize going long on gold.
2. If gold continues its upward trend and first reaches the 3835-3845 area, we can consider going short on gold.


GOLD 30 YEAR BULL MARKET CYCLESAn obvious pattern for gold in the last 120 years is that the duration of a bull market is around 30 years. Now of course we are in another bull market that is probably going to dwarf the previous ones. My target is around 18500$ near the end of the decade, but of course it can easily be broken if in the next 2 or 3 years we see major black swan or other devastating events. Notice that the last major run in the previous bull markets occured in the last 4-5 years of the cycle, therefore i believe that from next year we will probably see a similar pattern until 2030.

GOLD-BULLISH IDEAGOLD is in bull run as it is moving in bullish perallel channel and repeating same characterstics.

Gold's rise encountered resistance and launched adeep correctionGold maintains high-level fluctuations at the daily level, but the short-term trend shows weakness. The price on the 4-hour chart has fallen below the previous fluctuation range and is currently obviously constrained by the 3760-3770 pressure zone. The K-line continues to run below the short-term moving average. The overall structure shows a weak and volatile pattern. The recent rebound has approached the previous key pressure area. It is expected that the downward trend will most likely continue after the rebound repair is completed. Although a V-shaped reversal has formed in the smaller cycle, the price has stagnated near the pressure zone. The technical indicators show a top divergence signal, indicating that the short-term momentum is gradually weakening and there is a tendency to turn to adjustment again. The comprehensive technical aspect shows that gold faces downside risks in the short term. It is necessary to focus on the adjustment strength and the performance of the key support level below. The operation suggestion is to short on rallies. Focus on the rebound resistance of 3760-3770 on the top and the support of 3715-3700 on the bottom.

ANFIBO | XAUUSD - A psychological zone $3800 ? [09.25.2025]Hi guys! Anfibo's here!
Overall Picture Today:
OANDA:XAUUSD is currently maintaining stability within the H4 bullish channel, reflecting the sustainability of the prevailing uptrend. Although no major breakout has occurred in recent sessions, the technical structure indicates that buyers still hold the advantage. However, the market is showing signs of stalling at a key resistance zone, so short-term trading plans should focus on resistance and support levels to optimize profits.
> SUPPORT KEY LEVELS: 3748 - 3733 - 3703
> RESISTANCE KEY LEVELS: 3768 - 3777- 3788 - 3799
Here's my Trading Plan today:
>>> SELL SCALP:
ENTRY: 3770 - 3765
SL: 3780
TP: 3720 - 3705
>>> BUY ZONE:
ENTRY: 3700 - 3705
SL: 3695
TP: 3760 - 3800
Always set stop-loss and good money management for success!
GOODLUCK GUYS!!!

Gold next move (Read Description). Hello Traders, gold has created new ATH, New ATH at every new week.
Gold is still wants to fly and can create another ATH this week again.
If gold pullbacks it can touch 3784 - 3771 and can continue the bullish trend. Gold is still in bullish trend.
Stay tune by every update.

XAU/USD Technical Setup: Reversal Brewing Inside Bearish ChannelAbsolutely! Let's break down the technical analysis chart for **Gold Spot U.S. Dollar (XAU/USD)** on the 1-hour timeframe. Here's what it's signaling:
---
### 📉 Chart Structure: Descending Channel
- The price action is confined within a **descending channel**, marked by two parallel trend lines sloping downward.
- This typically indicates a **short-term bearish trend**, but also sets the stage for a potential **bullish breakout** if momentum shifts.
---
### 🔄 Reversal Signal: Rounded Bottom
- Inside the channel, there's a **rounded bottom pattern**—a classic reversal formation.
- This suggests that selling pressure is weakening and buyers may be preparing to take control.
---
### 📈 Trade Setup Overview
| Component | Level | Purpose |
|----------------|-------------|----------------------------------|
| **Entry Point**| 3,754.95 | Buy trigger after breakout |
| **Target Point**| 3,726.91 | Profit-taking level |
| **Stop Loss** | 3,775.95 | Risk control if breakout fails |
> ⚠️ Note: The **target point is lower than the entry**, which is unusual for a bullish breakout. This might be a labeling error or a short-term scalp strategy. Typically, you'd expect the target to be **above** the entry in a long trade.
### 🧠 Strategic Interpretation
- **Bullish Bias**: The rounded bottom and breakout arrow suggest a bullish move is expected.
- **Risk Management**: The stop loss is placed above the entry, which is unconventional. Normally, you'd place it below the entry in a long setup.
- **Channel Breakout**: If price breaks above the descending channel with volume confirmation, it could trigger a strong upward

Gold Going Up Hard , Can We Get 250 Pips From This Wave ?Here is My 15 Min Gold Chart , and here is my opinion , the price going up very hard without any correction so we should move with it and we have a 4H Candle closure above our Res 3872.00 And Perfect Breakout and this give us a very good confirmation , so we have a good confirmation now to can buy after the price go back to retest the broken area 3872.00 , and we can be targeting 100 to 200 pips . if we have a daily closure below this area this mean this idea will not be valid anymore .
Reasons To Enter :
1- Perfect Touch For The Area .
2- Clear Bullish Price Action .
3- Bigger T.F Giving Good Bullish P.A .
4- The Price Take The Last High .
5- Perfect 4H Closure .
