Gold Trade Set Up Sep 30 2025Price made ATH once again but pushed down 700 pips in London session making a LL and creating a big 4h FVG so i will either want to see price trade into the 4h FVG or Fib levels, make a LH before trading lower or wait for a BOS on the 5m of the most recent low followed by a test of 5m Supply to trade lower to PDL
GOLDCFD trade ideas

GOLD XAUUSD GOLD DROPS over 700pips drop as i earlier said for liquidity + volatility to happen we need 700pips drop and it came complete..its the hand of GOD.
and the pay day zone at 3810-3806 was challenged by strong take profit during London session because trading is 100% probability. now i see caution applied too in newyork session. If newyork retest London high at 3872 they will extend it into 3880-3885 -3875 and sell.
the structure is already showing a sell price action on the ascending trendline and a supply roof.
technically expect sell in the zone of 3885-3880-3875.
TECHNICAL BUY FLOOR 3755-3758 RETEST FLOOR .
GOODLUCK
#XAUUSD #GOLD #DOLLAR #US10Y

GOLD XAUUSD GOLD ,THE STRUCTURE NEVER LIES, WE WILL WATCH THE 3760-3758 ZONE .break and close below this level will be watching 3741 demand floor and the next will be 3685-3690 zone .
if we hold 3760-3758 as demand floor then we are taking out 3785-3782 supply roof .
and 3800 swing and possible price play into 3835-3845 will be watched for sell on the ascending trendline .
#gold #xauusd #dollar #us10y

“Gold (XAU/USD) – Breakout Play from Resistance (1-Hour ViewChart Structure & Key Levels
You’ve drawn a resistance zone above current price. The label “this is the resistance area here if break we will hold” points to a horizontal resistance line or zone.
You also show a descending trendline acting as dynamic resistance.
On the lower side, you mark LL (Lower Low) and LH (Lower High) points, implying the prior structure was in a downtrend or consolidation.
Your trade setup (green = target area, red = stop area) suggests you are expecting a break above resistance and a move upward with three target levels:
• TP1 at ~ 3,759.74
• TP2 at ~ 3,779.03
• TP3 at ~ 3,799.67
What Your Setup Implies (and Risks)
Bullish Bias on Breakout
You are expecting that if price breaks above the resistance zone + trendline, that resistance may flip into support, allowing the price to rally further. This is a classic breakout reversal expectation.
If the breakout is confirmed (with strong candle close above, ideally with volume), then the path is “clearer” for your targets.
Stop / Risk Control
Your red zone (stop area) is placed below the resistance/trendline region. If price fails and falls back below this, your trade idea would be invalidated.
Target Levels Logic
TP1 is relatively conservative, just above resistance.
TP2 and TP3 stretch further to capture the upside momentum if the breakout has strength.
Additional Considerations & Technical Tips
Confirm the Breakout
Don’t just enter on a quick wick above resistance. Wait for a sustained close above the zone (on your timeframe) to reduce the chance of a false breakout.
Check volume: higher-than-average volume on the breakout gives it more credibility.
Watch for Retest
Often after a breakout, price returns to retest the broken resistance (which now may act as support). This retest can offer a better entry with lower risk.
Manage Risk Aggressively
The more distant your TP3, the more room for price to reverse. Consider scaling out of the trade (taking partial profits as price hits TP1, TP2) to lock in gains.
Keep an Eye on Macro / Fundamental Factors
Gold (XAU/USD) is sensitive to U.S. monetary policy, the strength of the U.S. dollar, inflation expectations, and geopolitical risk.
For example, stronger U.S. data or hawkish Fed statements could work against a bullish breakout in gold.
Divergences & Momentum Indicators
Use RSI / MACD / ADX to check whether momentum supports your breakout idea. If momentum is weak or showing divergence, be cautious.
Timeframe Alignment
Make sure that higher timeframes (4H, daily) are not giving strong bearish signals conflicting with your breakout bias on the 1-hour chart.

BEARS READY FOR SELL (READ CAPTION)Hi traders, what do you think about XAUUSD Market
gold is currently trading near a strong support resistance zone 3819
price has shown bearish rejection from this area, indicating selling pressure.
if buyers fail to push above 3819(risk level),seller are likely to dominate.
downside targets align with support at 3791 and the demand zone at 3777.
stop loss above 3828 keeps this setup safe and controlled.
CURRENT PRICE:3817
RESISTANCE:3819
SUPPORT:3891
DEMAND ZONE: 3877
for educational purpose, not financial advice

Gold Price Analysis – XAU/USD Hits New All-Time High at 3812🌍 Market Developments
Gold prices continue to surge, reaching a new record high at $3,810/oz in today’s session. The rally is driven by expectations that the Federal Reserve will maintain a dovish policy stance, a weakening US dollar, and falling US Treasury yields. Safe-haven demand is also supported by ongoing geopolitical tensions and fears of a global economic slowdown.
📈 Technical Analysis
• Key Resistance: 3815 – 3825
• Immediate Support: 3785 – 3770, with deeper support at 3750
• EMA 50 & 100: both trending upward, confirming strong bullish momentum
• H1 and H4 candles show powerful upward momentum, though RSI is approaching overbought territory → possible pullbacks or short-term volatility
💡 Outlook
The primary trend remains bullish, but the sharp rally after setting a new record may trigger profit-taking around the 3815 – 3830 zone. As long as gold holds above 3770, the bullish bias remains intact.
🎯 Trading Strategy Suggestion
🔺 BUY XAU/USD : 3780 – 3777
🎯 TP: 40/80/200 pips
🛑 SL: 3773
🔻 SELL XAU/USD : 3817 – 3822
🎯 TP: 40/80/200 pips
🛑 SL: 3827

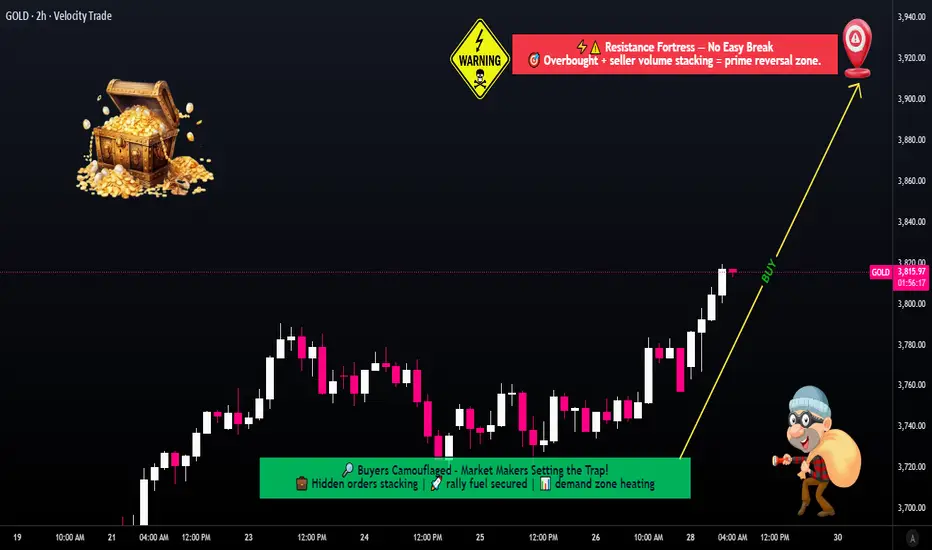
XAU/USD Metals Outlook: Bullish Path with Layered Buy Entry Plan🔥 XAU/USD: Thief’s Gold Heist Strategy Map (Swing/Day Trade) 💰
🎯 Asset: XAU/USD (Gold vs. U.S. Dollar) — The Shiny Metal’s Wealth Hunt!📈
Market: Metals Market
🏆 Strategy Vibe: Bullish Bandit Plan with a Thief-Style Layering Twist! 😎
🕵️♂️ The Thief’s Bullish Plan: Steal the Gold!
We’re diving into the XAU/USD market with a bullish swing/day trade setup using a slick Thief Layering Strategy. This involves stacking multiple buy limit orders to catch the price at key levels. No boring single entries here — we’re building a multi-layered trap to snag those pips! 🪤
📊 Key Setup Details
🎯 Entry Levels:
Deploy the Thief Layering Strategy with multiple buy limit orders at:
💰 3760
💰 3780
💰 3800
Pro Tip: Feel free to add more layers based on your risk appetite! Stack those limits like a master thief planning a heist. 😏
🛑 Stop Loss:
Thief’s SL set at 3720.
Note: Dear Ladies & Gentlemen (Thief OG’s), this SL is my take — you’re the boss of your trades! Set your stop loss based on your risk tolerance. Trade smart, steal smarter! 💡
🎉 Take Profit Target:
Aim for the Electric Shop High Voltage Trap at 3920. This zone screams strong resistance, overbought signals, and a potential trap for the unprepared. Escape with your profits before the market zaps you! ⚡️
Note: Thief OG’s, this TP is my suggestion. Grab your profits at your own pace and risk level — make it rain when you’re ready! 💸
🔗 Related Pairs to Watch (Dollar-Based Correlations)
Keep an eye on these USD-based pairs for market synergy and correlation:
FX:USDJPY : A stronger USD could pressure gold prices, so watch for inverse moves. If USD/JPY spikes, XAU/USD might dip. 📉
OANDA:USDCHF : Another safe-haven pair. If CHF strengthens, it could signal risk-off vibes impacting gold. 👀
TVC:DXY (U.S. Dollar Index): Gold often moves inversely to the dollar. A rising DXY could cap XAU/USD’s upside — stay sharp! 🧠
OANDA:XAGUSD (Silver): Gold’s shiny cousin often follows XAU/USD’s lead. Check for confirmation in silver’s price action. ✨
Why Watch These? Correlations help you spot market sentiment. If USD strengthens across pairs, gold’s bullish run might face resistance. Use these as your Thief’s Radar to time your entries! 🕵️♀️
🔑 Key Points of the Thief Strategy
Layering Entries: Multiple buy limits spread risk and increase chances of catching a favorable entry. Think of it as setting multiple traps for the price! 🪤
Risk Management: The suggested SL at 3720 keeps losses tight, but adjust based on your account size and risk tolerance.
Resistance Watch: The 3920 zone is a high-voltage trap with overbought signals. Secure profits early to avoid getting caught in a reversal. ⚡️
Market Context: Gold thrives in uncertainty, so keep an eye on global events, Fed news, or inflation data that could spark volatility. 📡
⚠️ Disclaimer
This is a Thief-Style Trading Strategy crafted for fun and educational purposes. Trading involves risks, and past performance doesn’t guarantee future results. Always conduct your own analysis and trade at your own risk. Stay sneaky, stay safe! 😎
✨ If you find value in my analysis, a 👍 and 🚀 boost is much appreciated — it helps me share more setups with the community!
#️⃣ #XAUUSD #GoldTrading #ThiefStrategy #SwingTrading #DayTrading #BullishSetup #ForexTrading #TradingView
XAU/USD (Gold vs USD) on the 2H timeframe..XAU/USD (Gold vs USD) on the 2H timeframe with trendlines, Ichimoku cloud, and a highlighted demand zone.
From the markup:
Current price: $3,768.28
Demand/support zone: $3,750 – $3,760 (red box)
Uptrend line holding price above Ichimoku cloud (bullish structure).
My chart already has a "Target Point" marked at around $3,840.
Target Analysis:
Short-term target: $3,820 (first resistance zone).
Main target: $3,840 (as marked on My chart).
If momentum continues and breaks above $3,840, the next possible extension would be $3,860–$3,880.
📌 But if price breaks below $3,750 support, downside risk opens towards $3,720 – $3,700.
👉 So your immediate target = $3,840, with bullish continuation possible up to $3,860–$3,880 if the uptrend stays intact.

Gold's cycle analysis. 28/Sept/25 XAUUSD's medium cycle is trending down toward medium cycle number 15 ( bold black ) which is due at around mid of Oct 2025.. "Buying deep" price would be around 3468 - 3478...

I just think so therfore I am.Everything is on the chart. I don't know everything so if you can correct me if I'm wrong it would be really nice!

Gold May Retest 3800 — How to Trade It?Today, gold pulled back to the 20 area and formed a short-term bottom confirmation on the 30M chart with several long lower wicks.
Next, watch the 58 resistance. If price breaks and holds above, bulls will gain a clear advantage, with a likely move to test 3800.
During this move, the 72–77 zone may provide resistance, but strong bullish momentum is likely to break through it.
If gold reaches around 3800 and pulls back, this level will become a new support zone.

Gold fall to 3750According to my personal analysis, gold is likely to drop to the lower level on the 1-hour timeframe, as the 15-minute timeframe has turned bearish.
Please note that this is only my personal view and the responsibility lies solely with you.

XAUUSD NEW OUTLOOK According to H1 analysis Gold market going in buying pressure from morning now market will be touch the RESISTANCE LEVEL then it will falling from resistance level so if you are interested then go short from Given blow
be careful use proper money management
TRADE AT YOUR OWN RISK
REGARD ALBERT

XAUUSDPreferably suitable for scalping and accurate as long as you watch carefully the price action with the drawn areas.
With your likes and comments, you give me enough energy to provide the best analysis on an ongoing basis.
And if you needed any analysis that was not on the page, you can ask me with a comment or a personal message.
Enjoy Trading ;)

Market just swept stoploss – time for the next 1000 pips BUY 📊 Trading Plan for Today
Main Trend: Gold has broken structure (BOS) and built strong bullish momentum. The recent sharp drop was a stoploss sweep – a liquidity grab before the next leg up.
Buy Zone:
CP Order Buy Zone: 3786 – 3784
Stop Loss: 3779
Targets (TP):
Short-term: 3820 – 3840 (Fib 1.0 – 1.272)
Long-term: 3870 – 3880 (Fib 1.618)
💡 Market Psychology
The sell-off flushed weak hands (stop hunts).
Liquidity is collected → 3786–3784 becomes a strategic buy zone.
Holding above this zone may trigger a 1000 pips bullish wave.

Time to Fade the Rally—Gold Shorts Aim for 3835–3825Driven by the market's risk aversion sentiment, gold continues to maintain its strong upward position and has now reached our long target area: 3850-3860 as expected. It is obvious that gold is still in a bull trend, but as gold prices have risen sharply, more and more high-level risks have accumulated. Therefore, it is actually very difficult to directly participate in gold long trading now.
But according to the current trend, it is not difficult to find that after each surge in gold, there is a trend of falling back and testing support. Therefore, even if gold is in an upward trend, there is still a need to retrace support locally, and the retracement range is relatively not small, and can reach a retracement space of $20-30, so there is enough profit space for short-term trading.
In addition, in the short term, gold is currently facing the influence of the trend channel resistance area of 3855-3865. The current upward momentum has converged and the willingness to rise has tended to weaken. Under the influence of the resistance in this area, gold may have a need to retreat in the short term.
So in the short term, we might first consider shorting gold with the 3855-3865 area as resistance, and first look at the target area of 3835-3825 area. Of course, to gamble on short-term retracement profits in an upward trend, you need to set up protection!

XAU/USD Bullish Continuation Setup Based on SMCThe chart for XAU/USD (Gold vs. U.S. Dollar) on the 30-minute timeframe shows a bullish market structure with a strong upward trend. A clear Break of Structure (BOS) has occurred, followed by price expansion. Two key supply and demand zones are marked with purple rectangles, indicating possible areas of interest for future price action. The price is currently hovering near 3,867, with an anticipated short-term pullback to the demand zone around 3,850 before a continuation to the upside. The projected bullish path (illustrated by the blue arrow) suggests a higher high targeting above the current resistance area, where a weak high has been identified. This setup aligns with smart money concepts and order block trading strategies, suggesting a potential buying opportunity upon retracement.

Gold Buy Setup – Buy the Dip Towards 3868 Target1. Trend:
Price is in a clear uptrend within a rising channel (highlighted in pink).
Currently, price is at the upper boundary of the channel, showing a potential short-term pullback before continuing higher.
2. Key Levels:
Entry Point: Around 3,766 – 3,765 (blue zone).
Stop Loss: Around 3,748 (below the channel support).
Target Point: 3,868 (top blue line).
3. Chart Pattern:
Price has formed a bullish flag/channel.
The projected move suggests a pullback to support (blue entry zone), then a bounce to the target area.
4. Risk-to-Reward Ratio:
Risk: ~18 points (from 3,766 entry to 3,748 stop loss).
Reward: ~100 points (from 3,766 entry to 3,868 target).
R:R ≈ 1:5.5, which is very favorable.
---
Trading Idea
Bias: Bullish (Buy setup)
Plan:
Wait for price to drop near 3,765 entry zone.
Place stop loss just below support at 3,748.
Target the upper zone around 3,868.
---
Summary
This chart shows a buy-the-dip strategy within an uptrend.
The plan is to enter near the channel support, with a tight stop loss, aiming for a continuation of the bullish move toward the target.
✅ Strong R:R setup
✅ Trend-following trade
⚠ Risk: If price breaks below 3,748, trend may reverse or consolidate deeper.

Deep correctionGold is likely to face a deep correction ahead. After breaking down from the red support zone, I’ll be watching for a potential breakdown of the blue trend line. This could signal further bearish momentum. Keeping an eye on key levels will be crucial for future movements.

Expecting more drop Gold As per chart mentioned its falling triangle pattern . Price should visit below 3700 and if marked circle passed it will be straight blood bath ‼️‼️

Bearish Momentum Builds: Gold Aims for 3850–3840Gold touched around 3895 during its rise and then began to retreat, reaching a low of around 3856. Currently, gold is fluctuating in a narrow range around 3870. According to the current trend, gold will not continue to maintain its strong position in the short term, and because of the US government shutdown, there may be no economic data in the short term. Out of caution, the market may also press the pause button on gold to ease the upward trend!
From a technical perspective, gold fell from around 3872 to around 3793 yesterday, with a retracement of as much as $79; while today gold only fell from 3895 to around 3856, with a retracement of only $39. Judging from the adjustment space and testing cycle, the gold correction is not sufficient and there is still demand to continue to fall, at least to the 3850-3840 area.
As gold retreats, it may be difficult for the bullish momentum to regain its strength in the short term. Under the counterattack and pull of the bears, the high-level volatility trend may be exacerbated. In the short term, gold is under pressure in the 3870-3880 area. If it is difficult for gold to break through this area in the short term, gold may continue to fall to the 3850-3840 area through this resistance area. Once it falls below this area, gold may continue to fall to the 3820-3810 area.
So in terms of trading, I still think we can continue to try to short gold in the 3870-3880 area, first looking at the retracement target area: 3860-3850.

XAUUSD (Gold vs USD)XAUUSD | Eyeing All-Time High 🚀
📌 Price retraced into demand and showing signs of reversal.
📌 Expecting a pullback → continuation to the upside.
📌 Target: New All-Time High above 3896.
🔥 Bias remains bullish as long as support holds.
⚡️ Clean structure + strong demand zone confirmation.
🎯 Setup: Buy after retest, aiming for liquidity grab and breakout.

Signal Type: Short-Term Buy Asset: Gold (XAUUSD)Signal Type: Short-Term Buy
Asset: Gold (XAUUSD)
Overview:
This buy signal is generated when price action meets key market conditions, providing a high-probability short-term opportunity. It is intended for traders looking to capture quick upside moves while managing risk carefully.
Why This Signal Occurs:
Market Structure Shift – The price shows early signs of strength after holding a higher low.
Indicator Confirmation – Our proprietary indicator confirms a bullish bias at the current level.
Entry Level – The signal identifies an optimal zone where buyers are likely to dominate.
Risk Management – Stop-loss levels are set tightly (max 50 pips) to protect capital.
Suggested Action:
Traders may consider entering long positions near the marked zone.
Take-profit targets are based on recent resistance levels or indicator guidance.
Position size should reflect individual risk tolerance.
Note:
This signal is designed for short-term trading only. Always follow your personal risk management rules and use this as a trade idea rather than a guaranteed outcome.
