Market just swept stoploss – time for the next 1000 pips BUY 📊 Trading Plan for Today
Main Trend: Gold has broken structure (BOS) and built strong bullish momentum. The recent sharp drop was a stoploss sweep – a liquidity grab before the next leg up.
Buy Zone:
CP Order Buy Zone: 3786 – 3784
Stop Loss: 3779
Targets (TP):
Short-term: 3820 – 3840 (Fib 1.0 – 1.272)
Long-term: 3870 – 3880 (Fib 1.618)
💡 Market Psychology
The sell-off flushed weak hands (stop hunts).
Liquidity is collected → 3786–3784 becomes a strategic buy zone.
Holding above this zone may trigger a 1000 pips bullish wave.
GOLDCFD trade ideas

Time to Fade the Rally—Gold Shorts Aim for 3835–3825Driven by the market's risk aversion sentiment, gold continues to maintain its strong upward position and has now reached our long target area: 3850-3860 as expected. It is obvious that gold is still in a bull trend, but as gold prices have risen sharply, more and more high-level risks have accumulated. Therefore, it is actually very difficult to directly participate in gold long trading now.
But according to the current trend, it is not difficult to find that after each surge in gold, there is a trend of falling back and testing support. Therefore, even if gold is in an upward trend, there is still a need to retrace support locally, and the retracement range is relatively not small, and can reach a retracement space of $20-30, so there is enough profit space for short-term trading.
In addition, in the short term, gold is currently facing the influence of the trend channel resistance area of 3855-3865. The current upward momentum has converged and the willingness to rise has tended to weaken. Under the influence of the resistance in this area, gold may have a need to retreat in the short term.
So in the short term, we might first consider shorting gold with the 3855-3865 area as resistance, and first look at the target area of 3835-3825 area. Of course, to gamble on short-term retracement profits in an upward trend, you need to set up protection!

XAU/USD Bullish Continuation Setup Based on SMCThe chart for XAU/USD (Gold vs. U.S. Dollar) on the 30-minute timeframe shows a bullish market structure with a strong upward trend. A clear Break of Structure (BOS) has occurred, followed by price expansion. Two key supply and demand zones are marked with purple rectangles, indicating possible areas of interest for future price action. The price is currently hovering near 3,867, with an anticipated short-term pullback to the demand zone around 3,850 before a continuation to the upside. The projected bullish path (illustrated by the blue arrow) suggests a higher high targeting above the current resistance area, where a weak high has been identified. This setup aligns with smart money concepts and order block trading strategies, suggesting a potential buying opportunity upon retracement.

Gold Buy Setup – Buy the Dip Towards 3868 Target1. Trend:
Price is in a clear uptrend within a rising channel (highlighted in pink).
Currently, price is at the upper boundary of the channel, showing a potential short-term pullback before continuing higher.
2. Key Levels:
Entry Point: Around 3,766 – 3,765 (blue zone).
Stop Loss: Around 3,748 (below the channel support).
Target Point: 3,868 (top blue line).
3. Chart Pattern:
Price has formed a bullish flag/channel.
The projected move suggests a pullback to support (blue entry zone), then a bounce to the target area.
4. Risk-to-Reward Ratio:
Risk: ~18 points (from 3,766 entry to 3,748 stop loss).
Reward: ~100 points (from 3,766 entry to 3,868 target).
R:R ≈ 1:5.5, which is very favorable.
---
Trading Idea
Bias: Bullish (Buy setup)
Plan:
Wait for price to drop near 3,765 entry zone.
Place stop loss just below support at 3,748.
Target the upper zone around 3,868.
---
Summary
This chart shows a buy-the-dip strategy within an uptrend.
The plan is to enter near the channel support, with a tight stop loss, aiming for a continuation of the bullish move toward the target.
✅ Strong R:R setup
✅ Trend-following trade
⚠ Risk: If price breaks below 3,748, trend may reverse or consolidate deeper.

Deep correctionGold is likely to face a deep correction ahead. After breaking down from the red support zone, I’ll be watching for a potential breakdown of the blue trend line. This could signal further bearish momentum. Keeping an eye on key levels will be crucial for future movements.

XAUUSD H1 Bullish Momentum Likely to ExtendGold (XAU/USD) has bounced off the buy entry at 3,854.03, which is a pullback support that lines up with the 38.2% Fibonacci retracement and could bounce from this level to the take profit.
Stop loss is at 3,831.23, which is a pullback support that aligns with the 61.8% Fibonacci retracement.
Take profit is at 3,893.04, which is a swing high resistance.
High Risk Investment Warning
Trading Forex/CFDs on margin carries a high level of risk and may not be suitable for all investors. Leverage can work against you.
Stratos Markets Limited (tradu.com ):
CFDs are complex instruments and come with a high risk of losing money rapidly due to leverage. 65% of retail investor accounts lose money when trading CFDs with this provider. You should consider whether you understand how CFDs work and whether you can afford to take the high risk of losing your money.
Stratos Europe Ltd (tradu.com ):
CFDs are complex instruments and come with a high risk of losing money rapidly due to leverage. 66% of retail investor accounts lose money when trading CFDs with this provider. You should consider whether you understand how CFDs work and whether you can afford to take the high risk of losing your money.
Stratos Global LLC (tradu.com ):
Losses can exceed deposits.
Please be advised that the information presented on TradingView is provided to Tradu (‘Company’, ‘we’) by a third-party provider (‘TFA Global Pte Ltd’). Please be reminded that you are solely responsible for the trading decisions on your account. There is a very high degree of risk involved in trading. Any information and/or content is intended entirely for research, educational and informational purposes only and does not constitute investment or consultation advice or investment strategy. The information is not tailored to the investment needs of any specific person and therefore does not involve a consideration of any of the investment objectives, financial situation or needs of any viewer that may receive it. Kindly also note that past performance is not a reliable indicator of future results. Actual results may differ materially from those anticipated in forward-looking or past performance statements. We assume no liability as to the accuracy or completeness of any of the information and/or content provided herein and the Company cannot be held responsible for any omission, mistake nor for any loss or damage including without limitation to any loss of profit which may arise from reliance on any information supplied by TFA Global Pte Ltd.
The speaker(s) is neither an employee, agent nor representative of Tradu and is therefore acting independently. The opinions given are their own, constitute general market commentary, and do not constitute the opinion or advice of Tradu or any form of personal or investment advice. Tradu neither endorses nor guarantees offerings of third-party speakers, nor is Tradu responsible for the content, veracity or opinions of third-party speakers, presenters or participants.

XAUUSD (Gold vs USD)XAUUSD | Eyeing All-Time High 🚀
📌 Price retraced into demand and showing signs of reversal.
📌 Expecting a pullback → continuation to the upside.
📌 Target: New All-Time High above 3896.
🔥 Bias remains bullish as long as support holds.
⚡️ Clean structure + strong demand zone confirmation.
🎯 Setup: Buy after retest, aiming for liquidity grab and breakout.

Signal Type: Short-Term Buy Asset: Gold (XAUUSD)Signal Type: Short-Term Buy
Asset: Gold (XAUUSD)
Overview:
This buy signal is generated when price action meets key market conditions, providing a high-probability short-term opportunity. It is intended for traders looking to capture quick upside moves while managing risk carefully.
Why This Signal Occurs:
Market Structure Shift – The price shows early signs of strength after holding a higher low.
Indicator Confirmation – Our proprietary indicator confirms a bullish bias at the current level.
Entry Level – The signal identifies an optimal zone where buyers are likely to dominate.
Risk Management – Stop-loss levels are set tightly (max 50 pips) to protect capital.
Suggested Action:
Traders may consider entering long positions near the marked zone.
Take-profit targets are based on recent resistance levels or indicator guidance.
Position size should reflect individual risk tolerance.
Note:
This signal is designed for short-term trading only. Always follow your personal risk management rules and use this as a trade idea rather than a guaranteed outcome.

3930 on Mark!!XAUUSD is still intact on bullish rising wedge channel trend towards 3930!!
My stance on XAUUSD?
I'm buying gold on every DIP
✅️ First point of buying will be 3855-3850 area
- if the market drops and for retest on structure support for liquidity sweeps my second buying area will be 3822-3828.
-My target will be 3890 then
In extension 3930!!
- Secondly if H4 candle closes below 3820 then our buying will be compromised & I will wait till the bottom supply zone at 3780 for buying.
Additional TIP: Buy the dips

Beyond the Chart - GOLD Market Technical Analysis📉 XAUUSD Update
Price has entered the sell range after a newly formed Bearish FVG + rejection. The trendline is still holding, and buyers have not managed to break above it.
⚡️ Volatility is high (blue zone), signaling that the next move could be sharp.
🎯 Targets:
• First target → 3,795
• If price sweeps the gap here and confirms with a strong bearish close → 3,765

XAUUSD H1 Outlook XAUUSD (1H) 📊
Buy Zone ---> 3809
TG1 ---> 3845
TG2 ---> 3870
SL--> Below Liquidity Zone

Gold 1H – Will the Breakout from Range Sustain?Gold on the 1H timeframe has broken out of its previous consolidation range and is now testing a premium supply zone near 3828–3826. The structure shows a clear BOS after the range, supported by strong bullish momentum. However, engineered liquidity sweeps remain likely before the market establishes sustained direction.
From the macro side, today’s headlines highlight persistent inflation worries and a stronger U.S. dollar as traders anticipate upcoming remarks from Federal Reserve officials. Geopolitical tensions in energy markets have also underpinned safe-haven flows, adding volatility to gold price action.
This alignment of macro drivers and technical liquidity pools suggests two tactical scenarios: fading rejections at supply while preparing to buy dips into the defined demand zone.
________________________________________
📌 Key Structure & Liquidity Zones (1H):
• 🔴 SELL GOLD 3828–3826 (SL 3835): Premium supply zone with upside liquidity sweep potential, offering downside targets at 3810 → 3790 → 3775.
• 🟢 BUY GOLD 3757–3759 (SL 3750, Demand Zone): Discount demand area aligned with BOS, with upside targets at 3765 → 3780 → 3795+.
________________________________________
📊 Trading Ideas (Scenario-Based):
🔻 Sell Setup – Supply Rejection (3828–3826)
• Entry: 3828–3826
• Stop Loss: 3835
• Take Profits:
TP1: 3810
TP2: 3790
TP3: 3775
🔺 Buy Setup – Demand Mitigation (3757–3759)
• Entry: 3757–3759
• Stop Loss: 3750
• Take Profits:
TP1: 3765
TP2: 3780
TP3: 3795+
________________________________________
🔑 Strategy Note
Gold remains volatile after breaking out of consolidation. Expect engineered sweeps into both supply and demand zones before directional clarity develops. With macro headlines keeping the dollar firm and inflation risks alive, traders should watch for sharp intraday reversals:
• Fade supply rejections if momentum stalls at 3828–3826.
• Buy dips into demand if liquidity is swept cleanly around 3757–3759.
The broader narrative supports a two-sided strategy until the Fed provides clearer guidance.

9.30 Gold New High Technical Analysis!!!Technical Analysis:
From a 4-hour perspective, short-term support is seen at 3800-05, with key support remaining around 3785-90. Short-term resistance is seen at 3830-35. Trading strategies should prioritize buying on dips. In the interim, caution is advised with caution when buying, patiently waiting for key entry points.

The peak has been reached, SL3840, continue selling.Waiting for the US market to open, gold may experience a correction, but it will only be short-lived. In the long term, it will continue to push higher.
Sell short-term, target 3800. A break below 3800 would be even better.


Gold: Undervalued Safe-Haven Amid Macro Shifts?Gold: Undervalued Safe-Haven Amid Macro Shifts? $4,000 Target in Sight? 🚀
Gold at $3,817 (+1.28%), undervalued on central bank demand and inflation hedges amid trade barrier concerns—analysts forecast $4,000-$4,289 for 2025, average $4,000 implying 5% upside, asking if Fed cuts boost inflows. 📈
**Fundamental Analysis**
Demand up with central bank buys and 1,271.7t investment in 2019; undervalued vs. historical inflation-adjusted highs, strong fundamentals from geopolitical risks, limited supply adding scarcity premium.
- **Positive:** Inflation protector; ETF inflows rising.
- **Negative:** No yield; opportunity cost with rates.
**SWOT Analysis**
**Strengths:** Dual monetary/industrial role; deficit outlook.
**Weaknesses:** Price volatility; mining costs.
**Opportunities:** Rate cut cycles; emerging demand.
**Threats:** Strong dollar; crypto alternatives.
**Technical Analysis**
Chart in strong uptrend nearing records. Price: $3,817, VWAP $3,800.
Key indicators:
- RSI: 68 (bullish, approaching overbought).
- MACD: 20 (positive crossover).
- Moving Averages: Above 50-day $3,500, 200-day $3,200 (strong).
Support/Resistance: $3,600/$3,900. Patterns/Momentum: Cup-and-handle targeting $4,200. 📈 Bullish.
**Scenarios and Risk Management**
- **Bullish:** Inflation data lifts to $4,000; DCA on pulls to $3,700.
- **Bearish:** Rate hike fears drop to $3,500.
- **Neutral:** Trades $3,800 on PMI data.
Risk Tips: Stops at $3,600, max 5% exposure, diversify with bonds, DCA for fluctuations. ⚠️
**Conclusion/Outlook**
Bullish pending Fed signals. Watch inflation reports. Fits macro theme with hedge upside. Take? Comment!


XAUUSDGold is currently moving within Wave 5, and the bullish momentum could extend toward the 4000 zone. This area represents a long-term target in line with the Elliott Wave structure. Traders should stay aligned with the uptrend, while watching for temporary corrections that may offer strateg

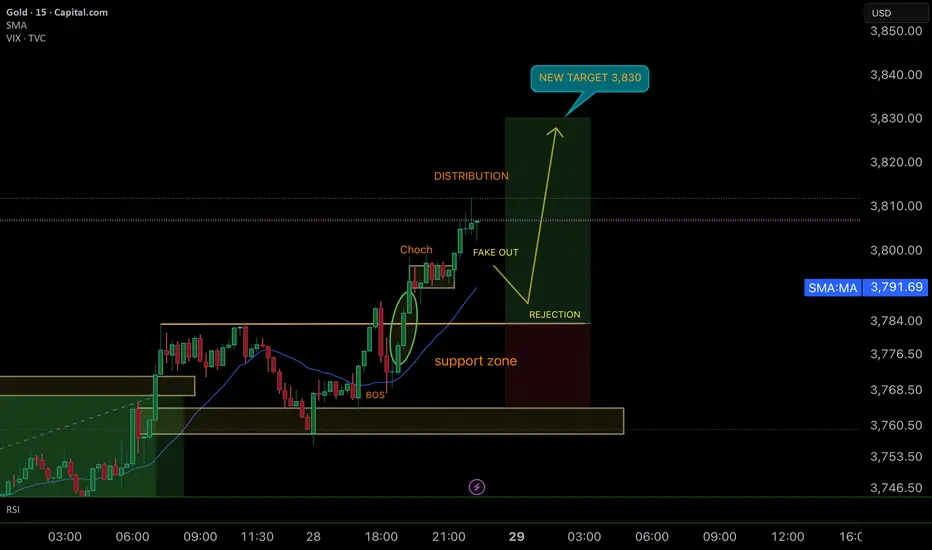
SMART MONEY CONCEPT (SMC)📊 Bullish Analysis – GOLD 15M
🔑 Technical Context
1. Support Zone Exhausted
Price respected the support base and then broke upwards with strength, showing institutional buyers defended the area.
2. BOS (Break of Structure)
The break of the previous bearish structure confirmed the start of bullish momentum.
3. ChoCh (Change of Character)
A clear ChoCh confirmed the shift in direction, validating the intention to reach new highs.
4. Fake Out & Rejection
After distribution, a fake out cleaned liquidity before projecting higher. The rejection zone is the key confirmation for the entry.
🎯 Projection
• Entry: At the rejection after the fake out.
• Target (TP): 3,830 – aiming for new highs (HH).
• Stop Loss (SL): Below support zone to protect invalidation.
📌 Conclusion
Market has consolidated, grabbed liquidity, and is ready to continue bullish momentum towards 3,830. Waiting for confirmation at rejection is key for high-probability setups.
GOOD LUCK TRADERS…. ;)
XAUUSD approaching buy zone!GOLD open with a gap, as past week it has broken out of the intial structure, with new market open has sown significant bullish price action. From daily price action, it is in long term uptrend. Current 15minute price is about to cross the daily support and 4h support which in turn could lead the price to bouce off and a good area for potential buy entry, however, would like to see the support been tested with longer ATR candle.
My SL in this entry would be 1.5ATR which is 91 pip in 15min which is well below the intraday support level.

XAUUSD Short Criteria
1-Daily bearish
2-4h bearsih MSS
3-Taking Asia high
4-15 min bearish MSS
Target PDL

3717 Won’t Hold—Gold’s Next Breakdown AheadThe highest point of gold during the day was around 3761. It can be clearly seen that as the bullish momentum of gold gradually declines, the high point of the candlestick chart is also gradually moving downward. Judging from the daily candlestick chart, a bearish candlestick chart appeared for the second consecutive day today, and it is very likely to close in a doji pattern, suggesting that gold is likely to continue to fall.
From the perspective of short-term morphological structure, gold has currently perfectly constructed a downward trend channel based on the wave top areas of 3790, 3778 and 3761; and upper shadows appear on many candlestick charts, suggesting that the selling pressure from above is relatively large, and the center of gravity continues to move downward and test the lower support area many times. Based on the current structure, 3717 is likely not the current low, and gold will continue to fall. The upper short-term resistance is in the 3750-3760 area; the lower support is in the 3715-3705 area, followed by the 3695-3690 area.
Therefore, for short-term trading:
1. Prioritize waiting for a gold rebound and then continue shorting gold within the 3750-3760 area; the short-term target is 3725-3715.
2. If gold first retreats to the 3715-3705 area, we can take advantage of the initial pullback and go long gold in that area, with the short-term target being 3730-3740.

Sept 26, 2025 - XAUUSD GOLD Analysis and Potential Opportunity📊 Analysis:
Yesterday, price neither broke above the previous high nor below the previous low. Ahead of next week’s NFP, a major breakout is unlikely. Expect wide range-bound movement between 3730–3761. Within this zone, the strategy is to sell near highs and buy near lows, following the intraday trend.
🔍 Key Levels to Watch:
• 3777–3781 – Resistance zone
• 3772 – Resistance
• 3765 – Resistance
• 3761 – Resistance
• 3750 – Psychological level
• 3740 – Support
• 3730 – Support
• 3728 – Support
📈 Intraday Strategy:
SELL: If price breaks below 3740 → target 3736, with further downside toward 3732, 3728, 3723
BUY: If price holds above 3746 → target 3750, with further upside toward 3752, 3759, 3765
👉 If you find this helpful or traded using this plan, a like 👍 would mean a lot and keep me motivated. Thanks for the support!
⚠️ Disclaimer: This is my personal view, not financial advice. Always use proper risk control.
