XAUUSD H4 TF BULLISH 🧭 1. Directional Bias: Bullish
Higher timeframe (HTF) structure is clearly in a strong uptrend:
Consistent Higher Highs (HH) and Higher Lows (HL) are printed on the chart.
Pice has respected ascending trendlines.
The most recent break of structure confirms bullish momentum continuation.
This is the first thing I look at:
"Am I trading with the trend, or against it? I don't argue with structure."
✅ I'm trading with the dominant HTF momentum — smart move.
🧱 2. Demand Zone + Fair Value Gap (FVG)/Imbalance Confluence
A clear H4 FVG/Imbalance between ~3765 and ~3787
That overlaps with a structural support zone / demand area
Trendline support is also sloping up into this zone
i'm not buying into extended price, i'm waiting for a discounted entry into demand, where:
Buyers previously stepped in aggressively
Liquidity (sells into demand) can be used to fuel longs
Thought Process:
“If I were an institution, I’d want to accumulate in this FVG at a discount after breaking structure — and that’s exactly where I’ll position myself.”
🔍 3. Break of Structure = Confirmation of Intent
Price previously consolidated, then:
Broke above a previous HH
Left behind imbalance and demand
Now retracing back for a retest
This is classic market maker behavior:
Break structure
Create imbalance
Retrace to demand
Continue the move
I'm planning to enter on the retrace, not chasing the breakout.
🛡 4. Risk Defined Precisely
Stop-loss is placed below the demand zone and FVG, outside the “noise zone”
My take profit is well above — at a clear level (potentially ATH or next resistance)
I'm giving the trade room to breathe, while keeping R:R healthy — a minimum 2:1 looks likely here.
Note:
“If the trade fails, it means structure is invalidated, not just noise. I don’t want to be stopped on wicks.”
🔺 5. Liquidity Logic
I'm showing you clear understanding of liquidity, not just technical levels:
I'm not longing after impulsive moves — I'm waiting for liquidity to be built up and swept
I'm entering after stop hunts, not before
I'm thinking institutionally, not retail.
Thought Process:
“Where are weak hands positioned? Where are stops sitting? Where would smart money enter against them?”
GOLDCFD trade ideas

XAUUSD IS TRENDING!Xauusd is trending! We should be looking for a beautiful buy opportunities across the trend. I’m positioning for a buy once price makes a significant support from the lower timeframe. We can see how healthy the trend is also, the 20EMA is servings as a support too. A buy opportunity is envisaged.

Gold continues to rise. Where will the highs be?Gold prices resumed their record-breaking upward momentum at the start of this week, breaking through 3,800 for the first time and briefly exceeding 3,850. The US government shutdown sparked safe-haven demand, while the Russian military advance has fueled geopolitical unrest, fueling safe-haven flows. Declining US Treasury yields are also positive for gold prices, and these signs are driving another surge in gold prices.
Currently, the gold price is trading around 3846, and the bullish defense line is around 3810. As long as the short-term price rise remains above this area, the bulls will continue to break through the highs.
Conversely, if the month-end close shows a reversal, turning bearish, the first factor to consider is a break below 3,810 before a significant correction is expected. Currently, the focus is on 3,820 for a bullish buy.
Strategy:
Go long around 3,820, with a stop-loss at 3,810 and a profit target at or above 3,850.
After falling below 3810, short sell when it rebounds to around 3815, with a stop loss of $10 and a profit range of 3780.


Don't HOLD GOLD after a full year full of bull run the Gold industry might need to consolidate a litlle bit and force the sellers to sell

GOLD Local Rebound Ahead! Buy!
Hello, Traders!
GOLD closed above the horizontal demand area, confirming bullish participation. Price will surge from the zone in alliance with Smart Money principles, seeking to mitigate inefficiency while clearing sell-side liquidity. Target sits higher. Time Frame 1H.
Buy!
Comment and subscribe to help us grow!
Check out other forecasts below too!
Disclosure: I am part of Trade Nation's Influencer program and receive a monthly fee for using their TradingView charts in my analysis.

XAUUSD – New Week Scenario on D1 FrameXAUUSD – New Week Scenario on D1 Frame: Prioritize buying, the 3790 – 3720 zone determines the trend
Hello Trader,
Trading is a journey, and the most important destination is conquering oneself.
On the D1 frame, gold has experienced a series of consecutive strong increases, indicating that the buyers still maintain the advantage. The buying force shows no clear signs of weakening, even though gold has just slightly reacted downward around 3790. Currently, the price is consolidating around 3760 – the closing zone of this week's candle.
Fundamental View
Political pressure from President Trump on the Fed is increasing, as the market expects easing measures soon. However, Chairman Powell remains cautious, prioritizing price stability over inflation concerns.
This factor may continue to keep gold as a key safe-haven asset, especially amid policy uncertainty.
Technical View
The 3790 – 3720 price zone will play a decisive role in the medium-term trend next week.
If 3790 is broken, gold will have the opportunity to advance to the Fibonacci Extension zone of 3822. Further, strong resistance lies around 3840 – 3860.
If 3720 is breached, selling pressure will retest the strategic support zone at 3650. This is also the confluence area with the rising trendline on D1.
MACD Indicator: continues to support the buyers, the histogram remains positive, not giving a clear signal of decline.
Volume: no significant selling pressure has appeared, indicating that gold is entering an accumulation phase, awaiting a breakout.
Trading Scenario for Next Week
Buying Scenario (priority):
Buy around 3650 – 3660 (if there is a correction).
SL: below 3640.
TP: 3720 – 3790 – 3822.
Selling Scenario at Resistance:
Sell around 3822 – 3830 (Fibo + strong resistance).
SL: above 3840.
TP: 3790 – 3760 – 3720.
Conclusion
In the medium term, the upward trend still prevails. Next week, gold will revolve around the 3790 – 3720 mark, and reactions here will pave the way for the next trend. The priority strategy is to buy at the 3650 support zone, while observing reactions at 3822 to consider short-term sell orders.
Short-term scenarios will be updated during the day, helping you be more proactive with market fluctuations.
Follow me and the community to update the earliest scenarios.

XAUUSD (GOLD) Short to take out liquidityI think that gold will take out the trendline liquidity first before making new ATH again

ANFIBO | XAUUSD - The week's last day, I'm bullish over $3800Hi guys, Anfibo's here!
OANDA:XAUUSD Analysis – Daily Trading Strategy
Overall Picture:
At present, gold (XAUUSD) continues to hold steadily within the H4 bullish channel, without any unusual volatility. The dominant uptrend remains intact, and the market structure still favors buyers. Personally, I remain optimistic that gold will soon head toward a new ATH above $3,800/oz in the medium term. However, in the short term, the market may continue to fluctuate around key support and resistance levels before confirming its next move.
Technical Outlook:
Short-term trend: Solidly bullish, though momentum is slowing; accumulation may form before the next breakout.
> SUPPORT KEY / BUY ZONES : 3740 - 3723 - 3713 - 3703
> RESISTANCE KEY / SELL ZONES : 3770 - 3777- 3788 - 3799 - 3836
Here's my Trading Plan today:
>>> SELL ZONE:
ENTRY: 3769 - 3775
SL: 3780
TP: 3740 - 3723
>>> BUY ZONE:
ENTRY: 3700 - 3705
SL: 3695
TP: 3760 - 3800 - 3836
Risk Management:
- Prioritize buy trades in line with the dominant trend, limit countertrend shorts.
- Maintain a R:R ratio of at least 1:2 on all setups.
- Manage capital strictly, avoid overtrading during sideways phases before breakout.
✅ Conclusion:
Gold is maintaining a stable uptrend on H4, with market structure still supporting buyers.
Main scenarios: Buy on dip around 3700 – 3705.
A clear move beyond 3780 would likely pave the way toward a new ATH above $3,800.
HAVE A NICE WEEKEND, GUYS!!!

Gold Intraday Trading Plan 9/26/2025Yesterday gold indeed dropped from 3760 and attempted to break 3730 for a couple of times but still failed. It went up and closed around 3750. Currently it is stuck in between 3730 and 3750. I am expecting correction to be over and bulls continue its rise.
I am looking to buy from 3745 today. First target is 3790.

Gold Trading Strategy | September 25-26✅ 4-Hour Chart: Gold prices pulled back after reaching 3791, with the lowest dip to 3717. It has since rebounded to oscillate around 3755–3760. The overall movement shows high-level consolidation, with frequent fluctuations between bulls and bears. No clear one-sided trend has formed yet, and we need to wait for a breakout direction.
The moving averages MA5 and MA10 are entangled at the highs, with price swinging above and below them, reflecting a tug-of-war between bulls and bears. MA20 (around 3755) serves as a critical support/resistance, currently at a pivotal state.
✅ 1-Hour Chart: Price rebounded from the 3717 low but faced resistance again around 3760–3765. It is currently fluctuating in the 3740–3760 range, showing a typical consolidation pattern.
The moving averages MA5, MA10, and MA20 are intertwined, with price oscillating around them. If the price fails to hold above 3760 in the short term, the rebound momentum will remain limited.
🔴 Resistance Levels: 3760 / 3785 / 3791
🟢 Support Levels: 3730 / 3717 / 3709
✅ Trading Strategy Reference:
Focus on range trading with selling at highs and buying at lows.
🔰 If gold rebounds to around 3760 and faces resistance, consider light short positions with a target of 3730–3720.
🔰 If price pulls back and stabilizes within the 3730–3717 range, consider short-term long positions with a target of 3760.
🔥Trading Reminder: Trading strategies are time-sensitive, and market conditions can change rapidly. Please adjust your trading plan based on real-time market conditions.

XAUUSD 1H – Bearish Rejection from SBR ZonePrice is currently retesting a key SBR (Support Becomes Resistance) area near 3760, following a break of structure to the downside with clear lower highs and lower lows. The move up appears corrective, and this SBR zone aligns with a recent weak high, making it a potential area for price to reject and resume the downtrend toward 3730 – 3717 support.
This bearish idea will be invalid if the SBR zone is broken and price closes above the 3760.347 level. Until then, I’ll be watching this zone closely for signs of bearish rejection to enter short, in line with the prevailing market structure.

Gold (XAU/USD) Short-Term Bullish OutlookThis gold (XAU/USD) 30-minute chart shows a recent price recovery after a bearish move, with support forming around the 3,722 zone. A change of character (CHOCH) suggests a potential bullish shift, supported by the rejection from the demand zone. The projection indicates a possible pullback before price continuation toward the 3,770 supply area, aligning with the weak high above. Overall, the chart signals short-term bullish momentum unless support breaks.


xauusd monthly
---
🔹 Elliott Wave Structure
The 1 to 5 waves are clearly counted on the chart.
Gold is currently in wave 5 uptrend, reaching very close to the 2.618 Fibonacci extension (around $3895).
This level can potentially mark the top of wave 5, since wave 5 often ends around the 1.618–2.618 extension of waves 1–3.
---
🔹 RSI (Relative Strength Index)
RSI is around 90, which shows extreme overbought conditions.
Historically, whenever RSI reached such levels (like in 2011 or 2020), a strong correction followed.
This indicates the market is overheated and a pullback is highly probable.
---
🔹 Summary & Scenarios
1. Main Scenario (Correction):
Wave 5 is likely complete or very close to completion.
A larger corrective structure (A-B-C) may begin, which could last for years.
Key support zones to watch:
$3200–3300
$2700–2800
2. Alternative Scenario (Continuation – less likely):
If strong bullish momentum holds above $3900, the next targets could extend toward $4200–$4400.
However, based on RSI and Elliott count, this scenario is weaker.
---
✅ Conclusion:
Gold is currently at all-time highs and in an extreme overbought zone. According to Elliott Wave theory, we are likely at the end of wave 5. A long-term correction is expected. For traders, the best strategy now is risk management and avoiding chasing buys at the top.

Gold Holding Above Support – Can Bulls Push Toward 3880?XAUUSD is showing steady momentum after holding above recent support, suggesting buyers remain active. Price structure favors continuation as long as the support zone is respected, keeping the bullish swing outlook valid.
Key Levels:
Buy Entry: 3860
Take Profit: 3880
Stop Loss: 3845
Reasoning:
Gold is forming higher lows while staying above its moving averages, showing a supportive structure for another upward move. The defined stop-loss at 3845 limits downside risk while targeting the next resistance area near 3880.
Disclaimer:
This analysis is for educational purposes only and not financial advice. Trade at your own risk and follow your personal trading plan.

XAUUSD Analysis Target ReachedXAUUSD Analysis Target Reached, after much push from the 4H support level, price reached our target with ease.

XAUMO GOLDEN REPORT - XAUUSD Technical Breakdown📊 XAUMO GOLDEN REPORT - XAUUSD Technical Breakdown
🗓 Date: Wednesday, October 1st, 2025
🔍 15-Min Chart (Scalping / Fast Entries)
Current Situation: Heavy sideways chop around 3863, low volume, neutral delta = no clear control by buyers or sellers.
Fib Levels: Price failed to hold above the 100% Fib (3875.45) and is now trading below 61.8%.
Pressure: No real bullish or bearish pressure → market in "decision-making" phase.
Decision: Stay OUT for now. Wait for a strong break above 3870 or below 3855 with high volume.
⏱ 1H Chart (Intraday Movement)
Momentum: Clearly fading, consistent negative delta, decreasing volume on the way up.
Fibonacci: After hitting the 125% level, price failed to push through 138% (a classic resistance zone).
Divergence: Negative delta divergence forming = buyers are losing strength while price tries to climb.
Decision: Watch 3858. A confirmed break opens the door to 3840 — fast pullback likely.
🕓 4H Chart (Mid-Term Outlook)
Trend: Still bullish, but the most recent candle shows clear loss of momentum.
Structure: Double top formation likely — two peaks without higher high breakout.
Support Zones: Strong support around 3840–3820 zone.
Decision: DO NOT buy highs. Wait for a correction or a strong 4H candle close above 3875.
🗓 Daily Chart (Macro Direction)
Overall Trend: Strong bullish trend still intact.
Volume: Volume is decreasing with each new high — clear volume divergence.
Candlestick: Today's daily candle might close as a "Spinning Top" — signaling indecision.
Warning: Market likely needs to breathe; profit-taking could be around the corner.
🔥 Final Summary & Hypothetical Trade (Not a signal – analysis only)
Order Type Entry Stop Loss Take Profit Confidence
Sell Sell Limit 3869.50 3875.50 3844.00 🔥 84%
🧠 Justification:
Strong resistance at the 100% Fib (3875).
High sell volume & inability to print new highs.
Negative divergence in Delta & Volume on lower TFs.
Signs of exhaustion showing up in recent candles.

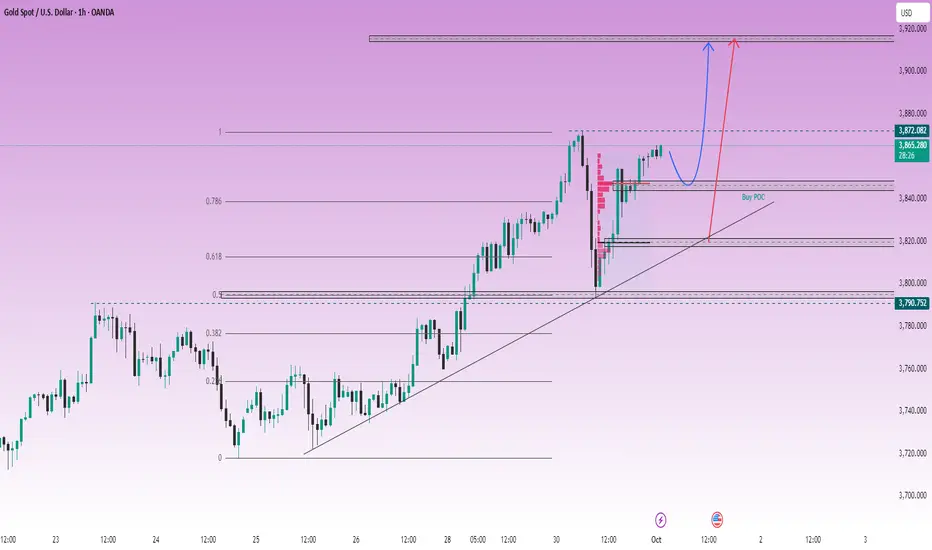
LiamTrading – Follow the Buy trend, target ATH 3915
The gold market continues to show the strength of the upward trend. After yesterday's shakeout, we witnessed a very clear Long Squeeze: all buying forces were forced to exit, but immediately after, the price quickly rebounded. This is the hallmark of a strong trend – the more it shakes out, the more momentum it creates for a new peak.
Today's perspective:
Continue to follow Buy, do not SELL against the trend.
The Buy position from 3797 is still held, if the price returns to retest, we will continue to add orders.
Prioritize observing the POC of the Volume Profile to place Buy orders, in case the price adjusts deeper, the VAL area coinciding with the rising trendline will be an extremely safe buying point.
Trading scenario
Buy 3847–3844, SL 3840, TP 3868 – 3880 – 3900 – 3915
Buy 3821–3819, SL 3814, TP 3835 – 3850 – 3868 – open
In summary: The upward trend remains extremely strong, the short-term target is ATH 3915. Just follow the trend, prioritize Buy to maximize profits.
This is my personal view on XAUUSD. Please follow the scenario and follow me to get the earliest updates.
GOLD GOLD DROPS over 700pips drop as i earlier said for liquidity + volatility to happen we need 700pips drop and it came complete..its the hand of GOD.
and the pay day zone at 3810-3806 was challenged by strong take profit during London session because trading is 100% probability. now i see caution applied too in newyork session. If newyork retest London high at 3872 they will extend it into 3880-3885 -3875 and sell.
the structure is already showing a sell price action on the ascending trendline and a supply roof.
technically expect sell in the zone of 3885-3880-3875.
GOODLUCK
#XAUUSD #GOLD #DOLLAR #US10Y

XAUUSD POSSIBLE NEXT MOVEGold (XAU/USD) Bearish Setup 📉
Gold is facing resistance and showing weakness at higher levels. A fresh selling opportunity is developing.
📍 Entry: Sell from 3802
🎯 Target: 3740
🛡 Stop-loss: Above recent resistance zone
If sellers maintain pressure, Gold could drop toward the 3740 support level. This is a high-probability short trade with good risk-reward potential.

Long gold, h1 OB reachedLong opportunity as trend continuation.
SL below the most recent low structure
TP at previous high

XAUUSD – Will ATH Diminish Gold's Value?Hello Traders,
Gold once accounted for up to 21% of total global assets, but now this figure is only about 5%. Two perspectives are clear:
Gold is gradually losing its relative importance in the financial system.
The total value of global assets has surged (expanding the denominator), reducing gold's proportion, while its absolute value still plays a crucial role.
Technical Analysis
In today's Asian session, gold continues to set higher price marks, indicating that the upward momentum remains very strong.
The ascending channel on H1 has reached the upper boundary, showing slight hesitation, but the main trend is still upward.
The H1 and H4 frames maintain strong buying power, with market sentiment leaning heavily towards buyers, ready to push prices to higher levels.
According to Elliott Wave, the price is currently in wave 5 (the market psychology wave). The current task is to observe the reaction when this wave completes, to prepare for the ABC correction cycle.
Regarding Fibonacci, the next important resistance area is at 3880, where a bearish reaction may occur.
Trading Scenario
Sell (at Fibo resistance 3880):
Entry: 3880
SL: 3886
TP: 3866 – 3850 – 3835
Buy (trend-following priority):
Entry: 3813 – 3816
SL: 3809
TP: 3828 – 3843 – 3860 – 3878
👉 Note: Smaller frames H1 – M15 will provide additional confirmation signals to optimize entry points.
Conclusion
The upward trend of gold is still prioritized, wave 5 has not ended, and the scenario towards 4000 – 4050 is entirely plausible.
Short-term selling at strong resistance areas can be considered, but risk management must be tight.
Traders need to closely monitor support – resistance areas in smaller frames to maximize profits.
Follow me for the fastest updates when the price structure changes and to further discuss scenarios in the community.
