GOLD IS MOVINGfor a lot of you commodity amateur , i'm sharing with you my last gold set up for those who want to take a look or dive deep into the strategy dm me
GOLDCFD trade ideas

XAUUSD Analysis todayHello traders, this is a complete multiple timeframe analysis of this pair. We see could find significant trading opportunities as per analysis upon price action confirmation we may take this trade. Smash the like button if you find value in this analysis and drop a comment if you have any questions or let me know which pair to cover in my next analysis.

Gold is Ready For Bull From Trendlines Hello Traders
In This Chart GOLD HOURLY Forex Forecast By FOREX PLANET
today Gold analysis 👆
🟢This Chart includes_ (GOLD market update)
🟢What is The Next Opportunity on GOLD Market
🟢how to Enter to the Valid Entry With Assurance Profit
This CHART is For Trader's that Want to Improve Their Technical Analysis Skills and Their Trading By Understanding How To Analyze The Market Using Multiple Timeframes and Understanding The Bigger Picture on the Charts

XAUUSD – Need confirmation before entering trades
Hello everyone,
Last week, gold experienced a strong rally, but after hitting the 378x resistance, selling pressure became quite evident, causing the price to drop and close the week with a corrective candle. This indicates a market sentiment of hesitation, especially for those trading on margin, as fear can easily take over.
Technical Analysis
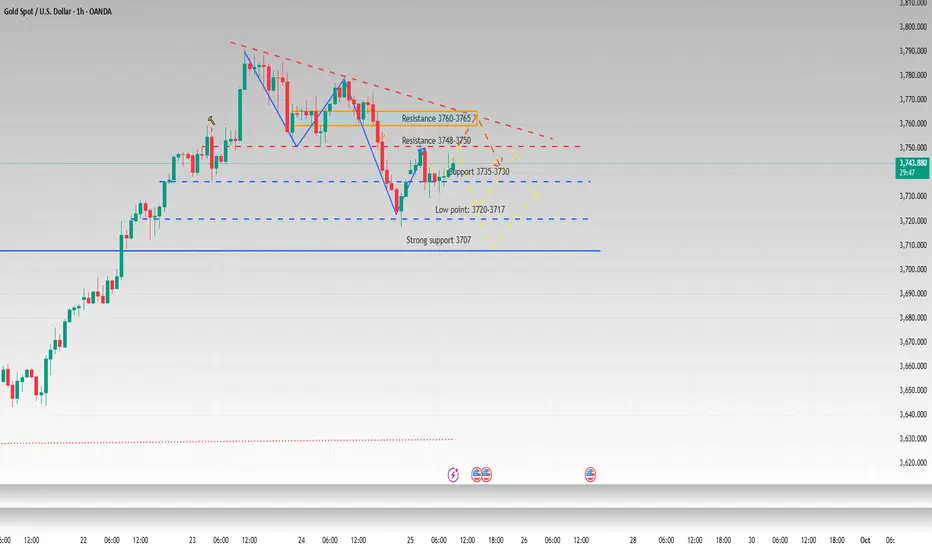
Currently, the price is returning to test the trendline around 3752. This is a crucial area and can be considered for a reactive Buy, with a safe stop-loss set below 3743. However, this is merely a crowd psychology reaction trade, so it's important to closely observe price action.
In the event that the price breaks the upward channel, we will wait for a pullback around 3760 to enter a Sell order. When this scenario occurs, the downtrend will become more clearly established, and the target expectation could be in the 366x–367x range.
Additionally, pay special attention to the support area of 3717–3723. This is a critical price zone, and if broken, gold is likely to enter a medium-term downtrend. In this context, a reactive Buy at 3715 could also be a reasonable scalping option for those who prefer short-term trading.
Trading Scenarios
Buy around 3752, SL 3743.
Sell when breaking the trendline and pulling back to 3760, expecting a decline to 366x–367x.
Buy scalping at 3715, SL 3709, short TP to 3723–3735.
📌 As the new week begins, be patient and observe the price reactions at key areas to obtain clear confirmation signals before entering trades.
Hopefully, this scenario will be helpful for everyone's trading process. I will continue to share more so that everyone can keep up with the market better.

Gold still bullish making cup and handle type , trend line as asuport , double top , sutance still bullish

Incoming Consolidation zone for goldGeopolitical events may push gold to new highs before end of 2025. Looking at how the fib lines I made by using the 0.382 fib = to the 1.0 fib from a previous idea, then extending it up to match other potential zones, price is currently bouncing around the 0.618 fib.

XAUUSD H1 OUTLOOK FOR NEXT WEEKI’ve Setup My Sniper Shot For A Sell From The Premium IFVG
Who’s With Me ?
Selling on IFVG And FVG Zones
Target Is Sell Side Liquidity
Good Luck Guys

Gold – patience versus greedThe current rise in gold to the 3640–3650 range resembles a protracted consolidation rather than a confident trend. The price remains within the upward channel, but there is a risk of correction accumulating near the current values. Key levels to watch are 3629 and 3618: a break and consolidation below will open the way to 3575, where important support lies. Within the range, the market is behaving nervously – false breaks are becoming commonplace, which increases uncertainty for those who are rushing into positions.
Fundamentally, pressure on gold is being driven by expectations ahead of the Fed meeting and weak dollar statistics: investors remain in “wait-and-see mode.” While the dollar is correcting in a downtrend, gold is receiving support, but without new catalysts, an upward breakout is unlikely. Rather, the market is looking for a balance of forces to determine who will lead - buyers or sellers.
The tactical plan boils down to not playing guessing games. In the event of a decline below 3618, confirmation of the bearish scenario with a target of 3575 will appear. If buyers keep the price above 3640, another attempt to storm the highs is likely. At such moments, it is important not to try to outsmart the market, but to wait until it shows the direction itself.
Sometimes the best trade is simply not to rush.

Gold Weekly Summary and Forecast 9/27/2025Last week based on the slowing down of the bullish bars, I expected some serious corrections from 3750. However, the bulls are really strong and without many retraces, it went up all the way to 3791. Currently the bulls are highly extended. I do expect some corrections coming soon but based on current strong bullish trend, I don't recommend to sell at least for the early part of next week.
Therefore, I expect gold to rise from 3750 to at least 3820, maybe even to 3857. Let's see how the market plays out next week.

Bullish momentum strengthens. Trend change?Gold remained volatile before the release of the PCE data, touching around $3761 before retracing to around $3722, consistent with short-term range-bound trading. Recent significant price gains and continuous new highs have boosted bullish sentiment in the market.
However, these continuous new highs have also instilled fear and caution among many traders. Each pullback has served to build momentum for further upward breakouts. With these new highs, short-term bullish sentiment has rebounded.
Looking at the 1-hour chart, the moving average system is running upward. The early price correction touched the lower track of the Bollinger band, and then rebounded to maintain volatility. After the PCE data release, bullish momentum surged, pushing the price sharply higher, currently trading near the upper Bollinger Band. Indicators suggest that bullish strength is gradually recovering.
On the last trading day of this week, the market is likely to maintain a high-level fluctuation trend, but be wary of sudden black swan events. If the price retraces to around $3740, Quaid recommends establishing a long position at that level and waiting for a rebound.

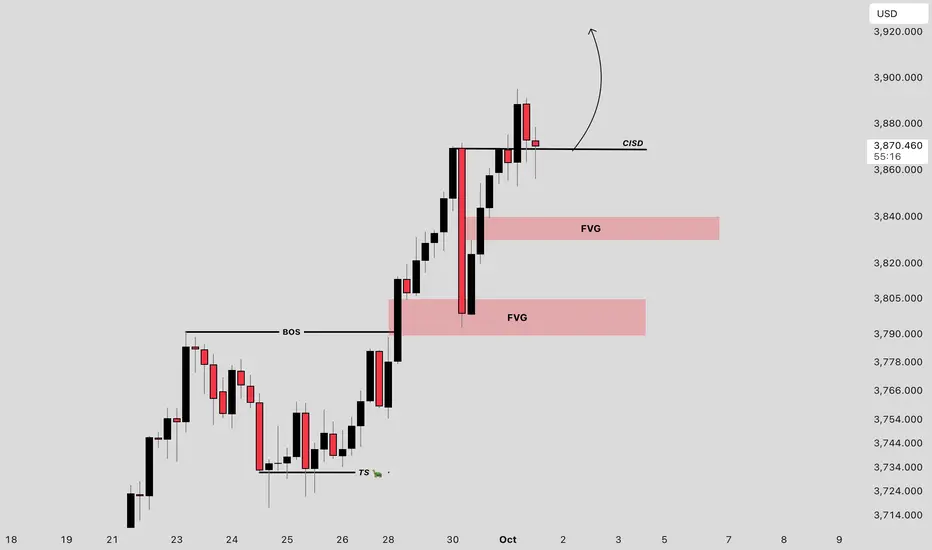
XAUUSD on range aiming 3930 on mark!!XAUUSD in Accumulation zone 3730-3760 area.
My stance on XAUUSD?
-First point of buying will be 3730-3725 area , H1 -H4 candle closes above it , my target will be 3785.
- Secondly if H4 candle closes above 3760 then I will took buy as well and target Target will be 3830.
Additional Tip :
On the otherhand, the 3690–3700 supply zone is the perfect buyying opportunity aiming target 3830.
On long term I'm watching gold at 3930!!


XAUUSDWeekly timframe, sill very bullish after the breakout of the symetric triangle, but we need a pullback, in order to keep pushing up, for a correct move

GOLD Is back in a Strong Support Zone. Bullish ConfirmationsI am seeing a strong sign of a bullish reversal from this zone. Whether this move will break ATHs remains to be seen but I believe it is time to go long.

The trend has not changed, continue to shortAfter yesterday's high-level fluctuations, gold prices retreated significantly in the US market due to news, hitting a low near 3717.
Yesterday's daily gold price closed in the red, with the MA5 moving average near 3735. If today's daily closing price falls below the MA5 and reaches the MA10, bears will regain control of the market. Looking at the 4-hour Bollinger Bands, after breaking below the middle line, the price has fluctuated, briefly stabilizing near 3735. Currently, it is consolidating sideways, but if the European/US session breaks below 3735-3720, further declines to 3710-3700 are possible. The short-term downward trend is still under pressure and the market is in a weak state. Therefore, intraday gold trading is still mainly short selling, with long buying as an auxiliary.
The main pressure range above is 3750-3765. If the rebound touches the upper resistance range without breaking it, you can continue to short gold. The short-term support is at 3735-3720 below. If it falls back but does not break through, you can go long with a light position. Strong support focuses on the previous top and bottom conversion of 3710-3700.
XAUUSD Swing Trade PlanGold (XAUUSD) has broken out of the descending structure and is showing strong bullish momentum. The market has respected the key support zone near 3740 – 3720 and is now building a higher-low formation.
🔹 Entry: 3756
🔹 Target: 3838
🔹 Stop Loss: 3720
Technical Rationale:
Trendline Breakout: Price successfully broke the descending trendline, shifting structure back to bullish.
Wave Structure: Market is developing Wave (5) in Elliott Wave count, projecting further upside.
Fibonacci Confluence: Target zone aligns with the 0.618–0.786 retracement extension, strengthening the bullish setup.
Support Confirmation: Multiple rejections at 3740–3720 provide a strong base for upward continuation.
📌 Bullish Bias: As long as price holds above 3720, the bullish scenario remains valid with upside targets toward 3838 and potentially higher into the 3890–3900 zone.

XAU/USD Intraday Plan | Support & Resistance to WatchGold is following the analysis — after failing to break the $3,782 resistance yesterday, price dropped into the First Reaction Support Zone. Currently trading around $3,741, the rejection has pushed price below the 50MA, keeping near-term pressure on the downside.
A clean reclaim and hold above $3,753 could shift momentum back to test $3,768–$3,782.
Failure to hold above the First Reaction Zone risks a deeper pullback into $3,712–$3,690, in line with the 200MA, which may act as dynamic support. If this breaks, sellers may target the Deeper Support Zone $3,665–$3,642.
📌 Key Levels to Watch
Resistance:
$3,753
$3,768
$3,782
Support:
$3,728
$3,712
$3,690
$3,665
🔎 Fundamental Focus – Thu, Sep 25
Heavy data day for USD with several high-impact releases:
🔴Final GDP q/q
🔴Unemployment Claims
🔶Core & Durable Goods Orders
🔶GDP Price Index
🔶 Existing Home Sales
👉 For gold, today’s data cluster is critical — stronger numbers could weigh on price, while weaker outcomes may support upside. Expect elevated volatility.

Gold - Sell around 3750, target 3720-3700.Gold Market Analysis:
We sold at 3742 in today's Asian session and have already made a profit. Gold is no longer in a one-sided rally and has begun a major correction. We need to follow the trend and trade at the right pace. We are now entering a major trend. The most common questions we receive are: has a major decline begun? Has gold peaked? The daily chart closed with a negative candle yesterday, and the previous trading day also formed a vague tombstone candlestick pattern. At this point, we can only confirm short-term resistance, but we cannot confirm that the overall trend has peaked or that the weekly chart is bullish. Furthermore, the short-term correction has not yet disrupted the bullish trend in the 4H. Today, we will focus on gains and losses at 3700. A break of this level will trigger a sell signal on both the 4H and daily charts. Strong support in the 4H is around 3717. This level is supported by the 30-day moving average and also serves as a support pattern. Remember, the low point of a major pullback was around 3712? The reason why it rebounded so quickly yesterday was because it hit strong 4H support. Gold is unlikely to decline directly today. I predict a correction first, and then a rebound near 3717. If it breaks, watch out for large buys, as this could signal another surge.
Resistance levels are 3751 and 3763, with strong resistance at 3773. Support levels are 3700 and 3717. The dividing line between strength and weakness is 3751.
Fundamental Analysis:
Gold surged and then retreated. The US dollar rebounded sharply after hitting a bottom. No major market data was released, and the Fed's policy action had no sustained impact on the market in the short term.
Trading Recommendation:
Gold - Sell around 3750, target 3720-3700.


GOLD - TRADER EDGE💎 Diamond Difference Maker:
Everyone sees the same chart, but only those who read the full breakdown see the edge.
The complete setup is served on a silver platter - you still have to pick up the fork -
Take action and apply your own special skills, insight, and adaptability with ever-changing markets.
🎯 KEY PIVOT ZONE
DEMAND ZONE: 3,720 - 3,740
Strong volume concentration at VRVP node around 3,730
Multiple session POCs clustering in this range
Key support area showing institutional buying interest
📊 PRICE TARGETS
UPSIDE TARGETS ⬆️
T1: 3,780 - 3,800 (Resistance POC cluster)
T2: 3,820 - 3,850 (Higher volume node)
DOWNSIDE TARGETS ⬇️
T1: 3,720 - 3,740 (Primary demand zone test)
T2: 3,680 - 3,700 (Lower support cluster)
⚡⚡ EDGE - HIGHEST PROBABILITY PLAY
Long from 3,720-3,740 demand zone with volume confirmation for 3,780-3,800 target
🔍 KEY CONFIRMATION SIGNALS
✅ Strong bounce from 3,720-3,740 with volume spike
✅ Break above 3,770 current resistance with momentum
✅ Session POCs acting as steppingstone support levels
📈 TRADE SETUP
🟢PRIMARY BIAS: BULLISH
Long Setup:
Entry: 3,720 - 3,740 (on demand zone bounce)
Stop Loss: 3,700 (below demand invalidation)
Target 1: 3,780 - 3,800
Target 2: 3,820 - 3,850
Risk/Reward: 1:2.5
🔄 BIAS FLIP CONDITIONS
🔴TURNS BEARISH IF:
Break and close below 3,700 with volume expansion
Failure to reclaim 3,720-3,740 as support
POCs start acting as resistance on bounces
⚡Then Target:
3,630 - 3,650 (major support cluster)
⚠️ RISK MANAGEMENT
Max Risk: $40 per ounce position
Position Size: Risk 1-2% of account per trade
Time Stop: Close positions before major economic releases

Gold’s Bullish Run: Ascending Channel Targets $3715Hi guys!
Gold has been showing incredible strength lately. Earlier, it formed a Head and Shoulders pattern, broke out, and hit its target perfectly.
Now
Things are getting even more exciting. We’ve just seen a widening pattern develop , and price has already broken out of it to the upside. That’s another strong signal that bulls are firmly in control.
At the same time, gold is respecting a clear ascending channel, and with momentum pushing higher, the next key target sits around $3715, near the upper boundary of the channel.
As long as price holds above the broken pattern zone, the outlook stays strongly bullish, and dips are likely to be bought up quickly.
Trend: Bullish
Target: $3715
Disclaimer: As part of ThinkMarkets’ Influencer Program, I am sponsored to share and publish their charts in my analysis.

GOLD XAUUSD GOLD ,the yellow metal is taking correction from the current all time high,3830-3828 rsky demand floor will be watched .
GOODLUCK
#XAUUSD #GOLD