GOLDCFD trade ideas
Gold Price Outlook – Key Day Ahead of U.S. Government Shutdown Analysis:
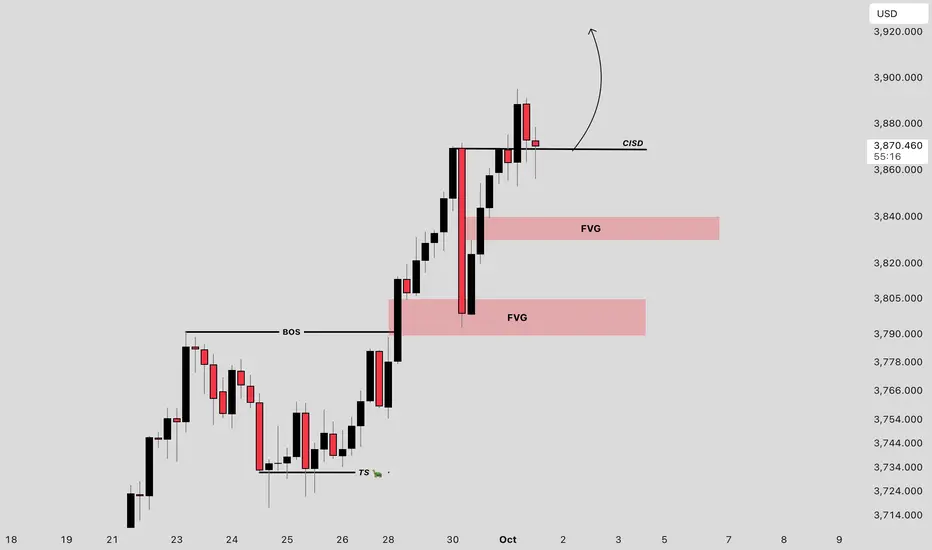
Gold has reached a fresh all-time high at $3,872. Today is particularly critical due to heightened uncertainty surrounding the potential U.S. government shutdown, which could fuel significant volatility. Traders should remain cautious, monitor breaking news closely, and always protect positions with a well-placed stop-loss.
Bullish Scenario (Long):
Entry: Above 3,873
Targets: 3,877–3,880 → 3,890 → 3,900–3,904 → 3,924 → 3,933 → 3,940
Bearish Scenario (Short):
Entry: Below 3,860
Targets: 3,853 → 3,844 → 3,836 → 3,825 → 3,817 → 3,809 → 3,802 → 3,790 → 3,780
⚠️ Disclaimer:
This analysis reflects only my personal market perspective and should not be considered financial advice. Trading in financial markets involves high risk, and each trader is solely responsible for their own decisions.

9/29 markup for goldSupport and resistance are my bread and butter, sometimes it pays to keep it simple.

XAUUSD upside target 3850-3900On the 4-hour chart, XAUUSD continues to break upward, with a clear bullish trend. Currently, attention can be paid to the support near the previous high of 3791. If it rebounds and stabilizes, consider buying again. The upside target is 3850-3900 area.

Gold momentum on Trendline XAUUSD GOLD Update H1 Timeframe
This analysis is based on educational purposes using Technical aspect
We are looking for the bullish opportunitiy on the base of trendline which is at 3750 - 3743.00
Our milestone would be at 3761.00 - 3778.00
#XAUUSD

XAUUSD H1 OUTLOOK I’ve Setup My Sniper Shot For A Sell From The Premium IFVG
Who’s With Me ?
Selling on IFVG And FVG Zones
Target Is Sell Side Liquidity
Good Luck Guys

A weak rebound? Bearish sentiment persists.Gold saw a correction in the market on Wednesday, starting to decline after rebounding from the high of around 3778 in the European session and continuing into the U.S. session. The lowest point was around 3717, a drop of about 60 US dollars, which was also a heavy blow to the bulls in the recent continuous market.
In a pattern of significant gains, without a significant correction, upward momentum will eventually falter. The previous day's high and Wednesday's early Asian session levels also act as key resistance points for bulls. After hitting 3717 in the US market, prices are currently rebounding.
Considering the previous gains, the current pullback is not significant. Key resistance is currently around 3755, a key short-term watershed. In the short term, try to short at this position and wait for the second pullback correction. Quaid recommends maintaining short positions near 3755. If there is a significant upward movement in the European session, consider adjusting positions before the US market opens.
Trading strategy:
Short around 3755, stop loss at 3765, profit range 3730-3720-3700.

Gold’s Bullish Run: Ascending Channel Targets $3715Hi guys!
Gold has been showing incredible strength lately. Earlier, it formed a Head and Shoulders pattern, broke out, and hit its target perfectly.
Now
Things are getting even more exciting. We’ve just seen a widening pattern develop , and price has already broken out of it to the upside. That’s another strong signal that bulls are firmly in control.
At the same time, gold is respecting a clear ascending channel, and with momentum pushing higher, the next key target sits around $3715, near the upper boundary of the channel.
As long as price holds above the broken pattern zone, the outlook stays strongly bullish, and dips are likely to be bought up quickly.
Trend: Bullish
Target: $3715
Disclaimer: As part of ThinkMarkets’ Influencer Program, I am sponsored to share and publish their charts in my analysis.

Gold correction trendJust like in the previous analysis, the gold trend has completely reached the overlap range, and from here, to enter a gold trade, we must wait until the price reaches one of the swap fl ranges.

Trap Continuation & Discipline in Focus – XAUUSD (Gold)In Case Study #8 (24th Sept), we highlighted a Bullish Engulfing Trap with Evening Star while noting that the earlier Morning Star had already failed.
👉 Market did not sustain above 3752/3767 and our stoploss was hit again.
This shows how traps extend longer than expected and why strict risk management keeps us alive in such phases.
🔎 Today’s Scenario (26th Sept Update)
Price continues to respect our mapped zones but lacks strength above confirmation levels.
Upside: Only if 3752 / 3767 sustains, momentum can build toward 3788 → 3812 → 3832+.
Downside: Failure at these levels opens path toward 3737 → 3710 → 3699 → 3680 zones.
Standby entry: Waiting for higher timeframe close remains the safest choice.
🧠 Expert Guidance / Precautions
SL hit = protection, not failure. Risk control keeps us in the game while traps unfold.
Patterns alone are not enough. Morning Star & Engulfing both failed → context is key.
Flexibility wins. Don’t marry bias; adapt to new confirmations.
Wait for HTF closes. Lower timeframe noise misleads during traps.
Precaution: Avoid aggressive entries on first breakout attempts; let the market prove direction.
📊 Case Study Recap (1 → 10)
Case Study Pattern / Setup Market Reaction Key Learning
#1–2 Head & Shoulders (initial) Played out as expected Classic pattern respect
#3–4 Head & Shoulders breakdown Measured move completed Market memory works
#5–6 Retests & Continuations Levels respected Flexibility in targets
#7 H&S near 3750 SL hit Importance of invalidation
#8 Morning Star Failed, SL hit HTF confirmation is essential
#9 Bullish Engulfing Trap + Evening Star Trap confirmed Never trust patterns blindly
#10 Trap continuation SL hit again Discipline + patience > prediction
⚠️ This is an educational case study, not financial advice. Trade at your own risk.
#XAUUSD #Gold #TradingCaseStudy #PriceAction #RiskManagement #MultiTimeframeAnalysis #Tradyoga #Yogeshonale

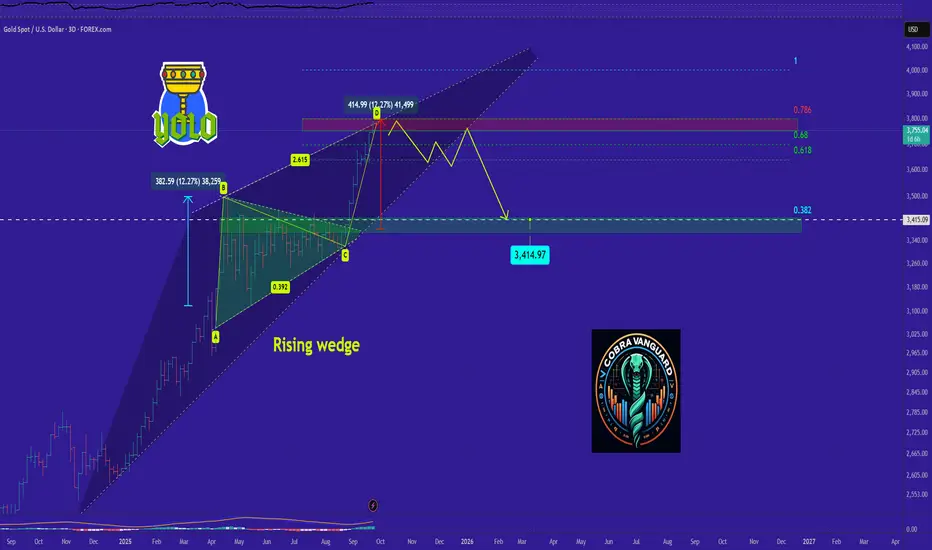
GOLD is bearish now and many Traders don't see it !!As you can see, the price is within a descending wedge, and it has reached the upper boundary of this wedge. According to technical analysis patterns, the price has closely followed the AB=CD pattern, indicating a need for a slight correction. In the coming days, the price may range within this wedge, and if the pattern breaks, the price could drop to the Fibonacci levels shown.
Adding more gold to my portfolioIn a way , thanks to President Trump for creating this mess! Think about it ! Had he not initiated the tariff war, the market would not be in a topsy turvy situation and therein lies opportunities and threats for us.
Now the bond yield are spiking up which means bond prices are crashing. Oh no, the US bonds were once highly sought after but with faltering price, who is buying or renewing? So people are dumping the dollars through the 10 and 30 years bonds and bond funds as well.
So where is an alternative to park their money when they cashed out ? Gold is an obvious choice and no matter who convinced you that there is no productivity in Gold or it is not part of value investing or WB is not into GOLD (why would you want to copy exactly his trade, not a peer to peer comparison), it remains a safe heaven , a flight to safety asset for centuries.
Of course, I would LONG gold

XAUUSD – Levels Respected Perfectly: Coincidence or Skill?Over the past weeks, we’ve been mapping out key structures on XAUUSD step by step – from Head & Shoulders, to bullish engulfing traps, to sustaining confirmations above 3752/3767.
Today, price action gave us another important confirmation:
👉 The market rejected exactly at the marked resistance zone and is respecting every level we outlined earlier.
🤔 Coincidence or Skill?
Many might call it coincidence.
But in trading, repeated alignment is not random.
This comes from:
Market Structure – Price respects liquidity & supply-demand zones.
Skill – Years of practice sharpen your ability to read patterns.
Intuition – With experience, analysis evolves into inner conviction.
Visualization – Not imagination, but mapping probabilities with discipline.
📚 Lessons from This Case Study
Respect Your Levels – If price keeps respecting them, it’s because your process works.
Discipline > Prediction – The challenge isn’t marking levels, it’s patiently trading them.
Psychology is the Sarathi – Emotions can pull us away, but discipline keeps us on track.
No Luck, Only Structure – When levels align consistently, it’s skill meeting intuition.
🧭 Closing Thought
The market is our Kurukshetra. Levels are the battlefield, the trader is Arjuna, emotions are the restless horses, and intuition is Krishna guiding the reins. Victory belongs to those who follow discipline with patience.
🔔 From here, we will continue with a new series of XAUUSD case studies, building on these foundations with deeper precision and psychological integration.
⚠️ This is an educational case study, not financial advice. Trade at your own risk.
#XAUUSD #Gold #TradingCaseStudy #PriceAction #RiskManagement #MultiTimeframeAnalysis #Tradyoga #Yogeshonale

XAUUSD SELL TRADE SETUP📊XAU/USD SELL Trade Setup
Date: 09/24/25
🔵 Entry Details: 3,765.69
🔴 Stop Loss (SL): 3,776.64
✅ Take Profits (TP):
TP1: 3,750
TP2: 3,740
TP3: 3,731
📐 Risk to Reward (RR):
1% Risk
Approximate RR: 1:3

XAUUSD: Market Analysis and Strategy for September 24thGold Technical Analysis
Daily resistance is at 3800, support at 3632
Four-hour resistance is at 3800, support at 3716
One-hour resistance is at 3780, support at 3750
From a technical perspective, spot gold fell intraday in the previous trading day and has begun to fluctuate and consolidate to build upward momentum, which may provide support for a resumption of the upward trend. Meanwhile, the price is trying to ease the clear overbought conditions in the RSI. The uptrend appears to have lost momentum near the key resistance level of $3780. Yesterday, the price surged to around 3790 before falling sharply, which, along with the bearish divergence on the RSI, confirms the exhaustion of the upward trend. The four-hour chart shows signs of upward fatigue, and a sharp correction may be in the offing. The NY market is focusing on the upward pressure of the 3780-3800 price range, while the downward support of the 3736-3712 range is under consideration. The short-term bull-bear dividing line is around 3750. My personal recommendation: For intraday trading, sell on rallies.
SELL: Near 3780
BUY: Near 3740

Gold: Bulls Eyeing 3,800 and 3,900 LevelsGold: Bulls Eyeing 3,800 and 3,900 Levels
Gold has broken out strongly from the rising channel, showing strong bullish momentum.
The next target is around 3,800, which acts as resistance. If buyers keep control and break above, the next bigger target is near 3850 and 3,900.
As long as the price holds above the breakout zone (around 3,700), the outlook remains bullish.
A drop back below 3,700 could signal weakness and a possible pullback.
The reason for the increase is not clear; it's all old news.
Most likely, the news will come out later, in the same way we heard about the airstrike on Qatar by Israel.
You may find more details in the chart!
Thank you and Good Luck!
❤️PS: Please support with a like or comment if you find this analysis useful for your trading day❤️

Gold prices are hitting new highs as demand what's should Next?Gold prices are hitting new highs as demand strengthens amid a weaker U.S. dollar and expectations of further Fed rate cuts Falling interest rates are making gold more attractive as a safe-haven and non-yielding asset Anticipation of Powell’s upcoming speech may trigger volatility, profit-taking, or a temporary correction. Strong underlying fundamentals (slowing growth, inflation concerns, central bank demand) continue to support gold’s bullish trend.
The ideal setup is to wait for pullbacks rather than chase highs Look for price to retest support zones and confirm reversal formations before entering long positions. A critical psychological level to watch: 3805. Sustained buying interest above this level may indicate continuation of the rally.
You may find more details in the chart.
Trade wisely best of Luck.
Ps; Support with like and comments for better analysis Thanks for Supporting.

Gold Holds Trend: Retest Before Breaking Towards $3,800?Hello everyone,
On the news side, the backdrop still supports gold: the Fed’s tone has recently turned less hawkish, with expectations for a continued easing path keeping the USD and yields subdued. Meanwhile, upcoming US data releases — especially PCE along with Fed officials’ speeches — could amplify volatility around new resistance zones. In addition, defensive sentiment driven by geopolitical risks and uneven global growth continues to sustain safe-haven demand for gold.
On the H4 chart, gold remains firmly above the Ichimoku cloud, which is trending upward. Below, layered FVG zones at $3,725–3,715 and $3,705–3,700 act as dynamic support cushions. The latest breakout came with rising volume, showing that buyers remain in control.
My base case is for gold to extend towards $3,758–3,765 to clear liquidity above, then pull back to retest $3,725–3,715 (potentially dipping deeper into $3,705–3,700 if volatility spikes on data), before resuming its climb towards $3,790–3,800 provided the retest zone holds. Key support lies at $3,725–3,715 and deeper at $3,705–3,700, while the bullish setup would be invalidated if H4 closes below $3,690 (loss of the final FVG step + cloud edge).
So, what do you think — does gold have enough momentum to push towards $3,800 in this wave?

DEFENSE SECURITIES OVERVIEW. THE BEST GAMES IN TOWN IN 2025Defense securities, especially leading sector stocks, ETFs, and gold, have significantly outperformed the broad market in 2025 due to distinctive macroeconomic, geopolitical, and policy catalysts, as well as investor sentiment favoring safety, reliability, and growth.
Were you ready twelve months ago or so, when 800-pound Gorilla entered a chat, but Defense securities is the best play on Wall Street so far, since The Second Coming of Trump.
We have checked even all the sparks presented here www.tradingview.com
... and found nothing about 'defense' tag.
The truth - financial markets is not the thing only about fairy tales and memes..
..but something about kind of reality also.
Well.. Lets talk about.
Macro Trends. Geopolitics and Government Spending
Intensifying geopolitical risks, including conflicts in Asia, Eastern Europe, and the Middle East, have accelerated global defense spending, resulting in a 10% surge in budgets for 2024 and continued growth toward $2.7 trillion in 2025. The U.S. alone approved a record $849 billion defense budget, solidifying a stable demand pipeline for contractors such as Lockheed Martin, Northrop Grumman, RTX, Boeing, and General Dynamics.
India, for example, has seen its defense sector deliver outstanding returns of 34.8% in the first half of 2025, vastly outpacing the broad Nifty index which rose just 5.5%. This surge is bolstered by “Make in India” initiatives, defense export policies, and multi-year procurement plans, putting key names like NSE:HAL , NSE:BEL , and NSE:BDL at center stage.
Sectoral Strength. Defense Stocks and ETFs
Defense stocks benefited from robust earnings, contract wins, and backlogs that assure multi-year revenue stability, a sharp contrast to cyclical or growth sectors battered by inflation and rate uncertainty. Top U.S. defense stocks in 2025 include:
Palantir Technologies, Inc. (PLTR): Engages in the business of building and deploying software platforms that serve (in most) Government segments.
Lockheed Martin (LMT): Leading in air, missile, and space systems.
Northrop Grumman (NOC): Pioneer in stealth aircraft and missile production.
General Dynamics (GD): Dominant in shipbuilding and combat vehicles.
RTX Corp. (Raytheon): Leading in missile defense and sensors.
Boeing (BA): Defense and space programs complement commercial operations.
Aerospace and defense-related ETFs have compounded the gains and enhanced portfolio diversification.
Key picks in 2025 include:
VanEck Defense ETF LSE:DFNG Global segment. +43.6% YTD return. Top holdings: Lockheed, RTX, Northrop, BA.
Global X Defence Tech ETF AMEX:SHLD Global segment. +51.8% YTD return. Top hodings: Lockheed, GD, Palantir, L3Harris
SPDR S&P Aerospace & Defense AMEX:XAR US segment. +36% YTD return. Top holdings: RTX, Boeing, Lockheed, GD
WisdomTree Europe Defence LSE:WDEP Europe segment. +38% YTD return. Top hodings: Thales, Leonardo, BAE
Invesco Aerospace & Defense AMEX:PPA US segment. +29% YTD return. Top hodings: Boeing, Lockheed, RTX, GD
These ETFs capture the consistent resilience and upward trajectory of the defense sector, boosted by large government contracts and rising international demand.
Gold's Surge. Hedge Against Turbulence
Gold, traditionally a safe-haven asset, has soared to unprecedented levels in 2025, breaking records with prices peaking above $3,800/oz, up 45% year-to-date as of late September. Key catalysts include persistent inflation, global rate volatility, a weaker U.S. dollar, and especially surging demand from investors seeking stability during times of policy uncertainty and market volatility.
Forecasters such as Goldman Sachs and Deutsche Bank have raised year-end 2025 gold price targets to $3,700/oz and $3,500/oz, respectively, as global central banks accumulated reserves and retail demand climbed.
Tariffs, currency wars, and regional instability have made gold a popular asset for hedging risk, reinforcing its outperformance against broad market indices (S&P 500 up only single digits, NASDAQ and other growth indices posting volatile returns).
Comparative Performance. Why Defence & Gold Outperform
Broad indices face headwinds from interest rate uncertainty, inflationary pressures, and earnings volatility in tech, retail, and pharma sectors.
Defense sector gains are anchored by predictable, multi-year contracts, recurring revenue, and global utility.
Gold’s hedge value rises in tandem with heightened risk aversion and growing macro threats.
Strategic Policy and Technological Innovation
The sector's outperformance is further enhanced by investment in cyber, AI, space, and next-gen technologies, making defense stocks attractive for growth and innovation. Major players in both U.S. and emerging markets (like India’s HAL, BEL, BDL, and Europe’s Thales or Leonardo) benefit from government-led innovation programs and export policies.
Investor Sentiment and Portfolio Positioning
With global investors shifting portfolios toward safety and resilience, defense securities and gold remain key allocations. ETFs provide diversified exposure with reduced single-stock risk, while gold offers pure macro insurance against market shocks.
Summary Table: 2025 Performance
Asset YTD Return (%) Key Drivers
Gold +45% YTD return. Inflation, policy risk, USD weakness
VanEck Defense ETF +43.6% YTD return. Global spending, tech contracts
Global X Defense ETF +51.8% YTD return. U.S. contracts, cyber, AI, space tech
SPDR S&P Defense +36% YTD return. Procurement, multi-year contract pipeline
India Defense Stocks +34.8% YTD return. National policy, exports, reforms
S&P 500 ~+10% YTD return. Earnings pressure, sector volatility.
Conclusion
In 2025, defense securities, including gold, reflect the global pivot toward stability, innovation, and security, thus delivering broad outperformance compared to mainstream equity benchmarks. Their ascent is driven by policy, demand, innovation, and capital flows responding to a world dominated by uncertainty and risk.
--
Best wishes,
@PandorraResearch Team

Gold next move possibleHello Traders, I’m back with new idea for the current week.
As you know gold has created ATH and still creating ATH every week. It can pullback till 3697 - 3666 and can continue the trend. Bear in mind the gold is still in bullish it can create new ATH this week again. Now ATH is 3791 gold can break it.
Follow the trend because trend is your friend.
Kindly share your ideas in comment, Thanks.

XAUUSD Update 3700 - 3800 Consolidation Area and ContinuationLast week, price have a minor correction and followed by consolidation.
It's still have a big possibility to make a continuation to reach a higher price target.
We should be patience to waiting for this consolidation ended and follow it direction for a continuation.
3700 - 3800 : Strugle area ( Consolidation )
Have a blessing week ahead !

Gold Bulls Eyeing $3,800+ – Key Buy Areas RevealedGold is currently holding inside a rising channel structure after making an ATH near $3,790. The market has pulled back from the high and is consolidating around key trendline support. The immediate buy area lies near $3,730–$3,740, which also aligns with the trendline support. A deeper dip towards $3,710–$3,715 could offer a stronger buy trigger zone if price retests.
On the upside, gold will likely revisit the $3,790 ATH, and a sustained move above this level may extend towards $3,800–$3,820 in the coming sessions. Overall, the market bias remains bullish as long as price holds above the $3,710–$3,692 support region, with consolidations and pullbacks seen as part of the broader upward trend.
🔑 Key Levels to Watch:
- Resistance: $3,760–$3,765
- Support: Immediate support $3,730 and strong support $3,710–$3,715
📌 Buy Zone & Buy Trigger:
- Buy Zone: $3,720–$3,730
- Buy Trigger: The buy trigger area is $3,760–$3,765, where a breakout above the descending resistance from the ATH would indicate renewed bullish momentum.
Note
Please risk management in trading is a Key so use your money accordingly. If you like the idea then please like and boost. Thank you and Good Luck!

Gold Next Week: Buy the DipsA series of high-impact economic data releases are scheduled for the coming week, which is likely to keep gold trading within a range initially. At the start of the week, in the absence of major market-moving news, focus will be on the resistance level near 3790.
This past Friday, gold trended higher during the day and tested resistance around 3784 during the evening session before pulling back to close near 3760. The closing price action suggests that the retracement may continue into Monday’s open.
However, in my professional view, this pullback does not signal a reversal. Buying on dips continues to be the dominant strategy, as higher lows are consistently forming, reinforcing the underlying bullish momentum. With gold continuously testing new highs, it’s natural for traders to experience caution—yet each consolidation phase has so far laid the groundwork for the next upward move. The short-term bullish sentiment remains intact.
On the 4-hour chart, immediate support is seen around 3735-40, with more significant support holding near 3718-23. Initial resistance is positioned in the 3756-65 range.
Trading strategy should prioritize entering long positions on pullbacks toward support. Avoid chasing the market in intermediate price zones—patience is key to entering at optimal levels.
📈 Gold Trading Plan:
Enter long on a dip toward 3735-40.
Add to long positions near 3718-23.
Stop loss: below 3709.
Take profit targets: 3765–3780.
If you’ve been struggling with timing or consistency in your trading, I offer tailored analysis and actionable strategies designed to help you trade with greater clarity and confidence. Feel free to reach out for personalized guidance—let’s work together to refine your approach.
About Me: I specialize in gold market analysis with a focus on technical positioning and risk-aware strategy. Whether you're new to trading or seeking more structured insights, I’m here to help you navigate the markets more effectively.
Let’s connect and turn market volatility into opportunity.
