Are gold bulls going crazy, or is it just a flash in the pan?Gold fluctuated upward during the day on Friday, hitting a high of 3784 in the evening before retreating under pressure and closing at 3760. The closing suggests further retreat at the start of next week, with a series of important data releases expected. Gold is likely to remain volatile at the start of the week. Without any significant news to stimulate the market, watch for resistance around 3790 and a possible decline. Traders holding short positions shouldn't panic. We'll develop a strategy to help you unwind early next week! Please send me your short entry points via the channel, and I'll provide you with a detailed trading strategy!
Let's look at the broader trend: Gold's recent retracement levels have been moving higher. Each pullback paves the way for further breakthroughs. Bullish sentiment remains generally high, so continue to buy on retracements. Short-term support is at 3735-40, while key support remains around 3718-23.
Trading: With no significant news to stimulate the market at the start of the week, watch for resistance at 3790 and a pullback. Gold should be shorted if it rebounds weakly on Monday. Short-term support is at 3735-40, while key support remains near 3718-23. Continue buying on dips. Specific entry points and times are provided in the channel.
GOLDCFD trade ideas

Don't rush into trading, you might be missing the most importantIn yesterday's analysis, I clearly stated that today's market trend was expected to be similar to last Wednesday's: that is, after reaching its high, gold prices would encounter resistance and fall back, entering a period of correction.
The actual market developments fully confirmed the accuracy of this prediction. Based on this expectation, we entered a short position at the opening price of 3765 and continued to increase our short position when it rebounded above 3775. We also seized a short-term long opportunity during this period, achieving significant returns overall. For detailed operational details, please refer to the analysis reports I published on Wednesday:
Returning to the current market, I will briefly analyze today's trading strategy.
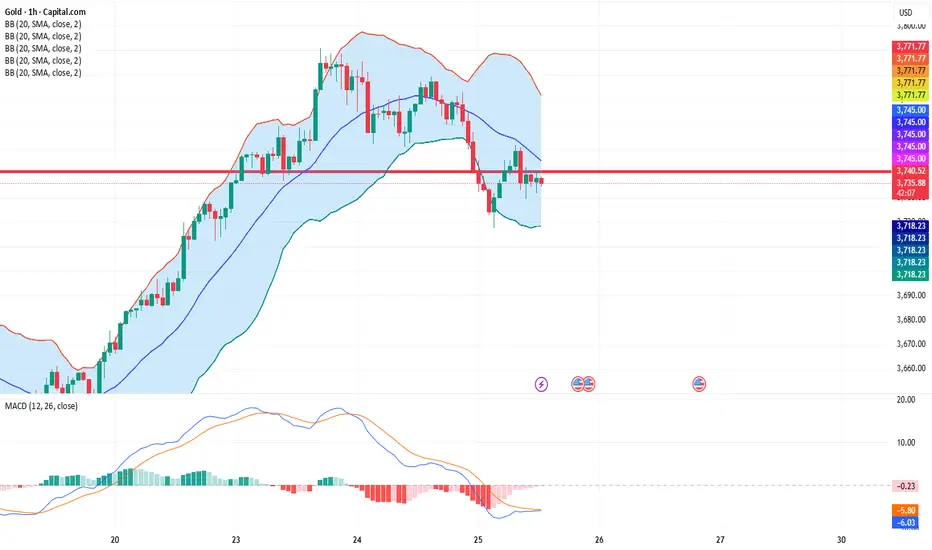
Based on the candlestick chart, the trend structure of the first three trading days of this week is highly similar to that of the same period last week, indicating that the market is still in a range-bound pattern. We expect the consolidation trend to continue today, with trading opportunities in both long and short directions. In the short term, we need to focus on the performance of the key support/resistance level of 3740. At present, I tend to wait and see, and then intervene when a clear signal appears during the trading session.
GOLD MY VIEW NOTICE THE MATH !!The chart posted is that of spot GOLD I have not changed the wave labeling and still have the targets posted see targets highlighted This should see GLD print maybe 350 Before it starts to deflate .I will be long puts at some point this week .In GOLD

Gold (XAUUSD) Technical Analysis 29/09/2025Gold is currently trading around the $3,800 zone, showing strong bullish momentum after breaking recent resistance levels. The market opened with upward strength, supported by safe-haven demand and a weaker dollar outlook.
🔎 Key Technical Levels:
Immediate Resistance: $3,815 – $3,825 (psychological barrier & intraday supply zone)
Major Resistance: $3,850 (weekly resistance, potential breakout level)
Immediate Support: $3,780 – $3,770 (intraday demand & 20 EMA zone)
Major Support: $3,740 (previous structure support & 50 EMA)
📈 Trend & Momentum:
Trend: Bullish above $3,780, but facing minor consolidation near $3,815.
Indicators: RSI hovering near 65-70, suggesting strength but slightly overbought conditions.
Moving Averages: Price trading above 20 & 50 EMA, indicating buyers in control.
⚠️ Outlook:
As long as Gold sustains above $3,780, the bullish trend remains intact with a potential target towards $3,850 – $3,870. A break below $3,770 could trigger correction towards $3,740.
💡 Bias: Short-term bullish, but traders should watch for rejection candles around $3,815 – $3,825 which could trigger intraday pullbacks.


PCE Core Drops, Is XAUUSD Ready to Explode?Hello traders!
Today, I'll share with you a detailed analysis of XAUUSD, combining important economic news and the current market trend .
The US core PCE index for this month is forecasted at 0.2%, lower than the previous 0.3%, indicating a decrease in inflation. This could lead the Fed to maintain low interest rates , which is favorable for gold. When interest rates are low, holding gold becomes cheaper, thus boosting demand and driving gold prices higher .
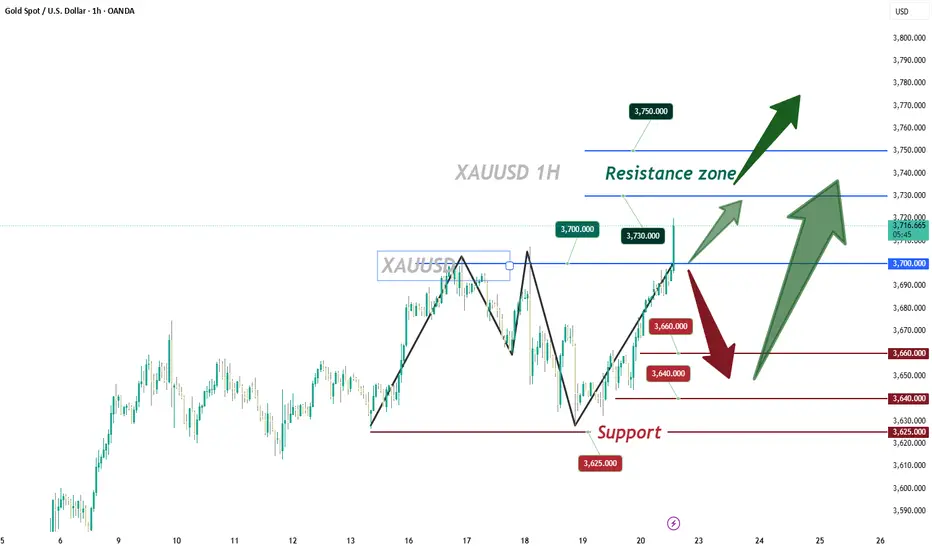
The XAUUSD chart shows a strong upward trend within the price channel. Gold is trading in an ascending channel , with support at 3,715.000 and a target at 3,800.000 . If support holds, the price of gold may continue to rise to higher levels.
With support from both fundamental and technical factors , the upward trend of XAUUSD is currently very strong. Wishing you successful trades and always finding great opportunities!

XAU/USD UPDATE: Trader Edge - Accuracy Adjustment!🎯 KEY PIVOT ZONE
DEMAND ZONE: 3,848.00-3,866.00
➡️3 POC lines converge with highest VRVP node at current price
➡️Densest volume accumulation on visible range
➡️Price currently AT pivot - testing top of demand zone
📊 PRICE TARGETS
UPSIDE TARGETS ⬆️
T1: 3,926.00-3,942.00
T2: 3,996.00-4,012.00
DOWNSIDE TARGETS ⬇️
T1: 3,786.00-3,802.00
T2: 3,726.00-3,742.00
⚡💎⚡ EDGE - HIGHEST PROBABILITY PLAY
Long from 3,850.00-3,858.00 bounce targeting 3,926.00-3,942.00 then 3,996.00-4,012.00
🔍 PRE-ENTRY CONFIRMATION SIGNALS
✅ Price dips to 3,852.00 or below showing bullish reversal candle (hammer/bullish engulfing)
✅ Higher low forms above 3,848.00 with momentum shift upward
✅ Volume spike on bounce confirming buyer absorption
📈 TRADE SETUP
🟢PRIMARY BIAS: BULLISH
Long Setup:
Entry: 3,851.00-3,857.00 after confirmations
Stop Loss: 3,838.00
🎯Target 1: 3,926.00-3,942.00
🎯Target 2: 3,996.00-4,012.00
Risk/Reward: 1:4.2 / 1:8.5
🔄 BIAS FLIP CONDITIONS
🔴TURNS BEARISH IF:
Clean break and 2H close below 3,844.00
Volume expansion on breakdown (1.5x average)
Failed retest of 3,850.00-3,862.00 as resistance
⚡Then Target:
🎯3,786.00-3,802.00
🎯3,726.00-3,742.00
⚠️ RISK MANAGEMENT
Max Risk: $18 per 0.01 lot ($1,800 per standard lot)
Position Size: Risk 1-2% of account capital
Time Stop: Only trade within LONDON, EUROZONE & NYSE's peak volume segments

Gold: Stabilized at 3700? New Week's Upside and Pullback TipsThe gold price has broken through the 3700 level for the third time 📈. Although there have been multiple pullbacks during this period, it has never fallen below the critical support range of 3600-3625 🔒, and the current selling pressure in the market has eased significantly.
Looking ahead to the new week, gold is expected to continue its steady upward trend. If it can stabilize above 3700 this time, the subsequent upward space can further target the 3730-3750 range; however, caution is needed: if the short-term rise is too fast, it may once again trigger profit-taking selling, leading to a gold price correction. In the event of such a correction, the 3640-3660 range will be a relatively safe entry level for buying on dips ✅
Buy 3680 - 3690
TP 3700 - 3720 - 3730
Accurate signals are updated every day 📈 If you encounter any problems during trading, these signals can serve as your reliable guide 🧭 Feel free to refer to them! I sincerely hope they'll be of great help to you 🌟 👇
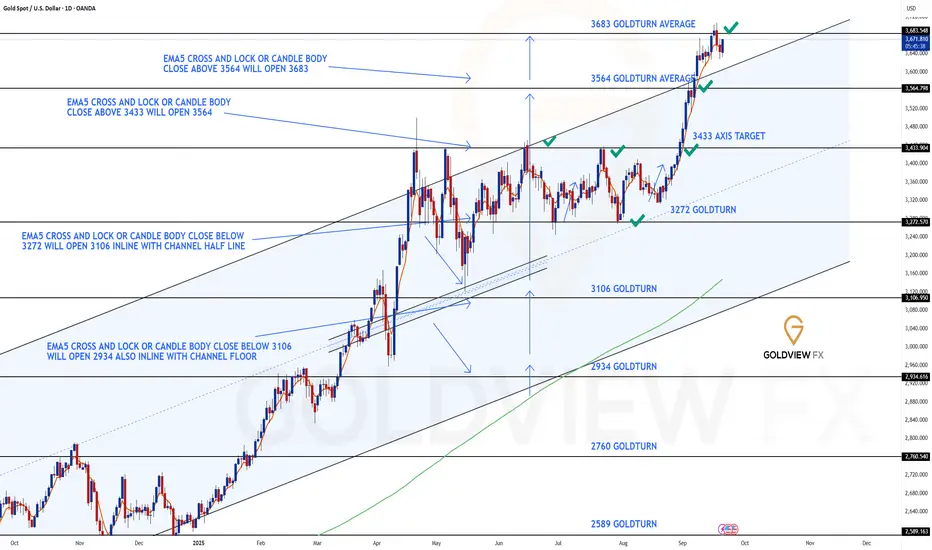
GOLD DAILY CHART ROUTE MAP UPDATE3683 Target Achieved – Chart Idea Complete 🚀💥
Booooom! 💥💥 Just as we laid out, the 3683 target was smashed this week – absolutely amazing finish! This move perfectly completed the chart idea we’ve been tracking, right in line with the analysis.
🔹 3564 ➡️ 3683
We first hit the 3564 target cleanly, then carried that momentum straight through to the big 3683 level. The EMA5 confirmations delivered flawlessly, giving us one of the sharpest, most technical finishes of the week.
This closes out the breakout sequence beautifully and proves once again how powerful structured analysis + patience can be.
🔥 What’s Next?
We’ll be back on Sunday with a fresh Daily chart idea, updated targets, and a full multi-timeframe analysis to guide the next leg of the journey. Stay tuned – momentum is only heating up from here!
Thank you for the continued support, and congratulations to everyone who rode this move with us.
Mr Gold
GoldViewFX
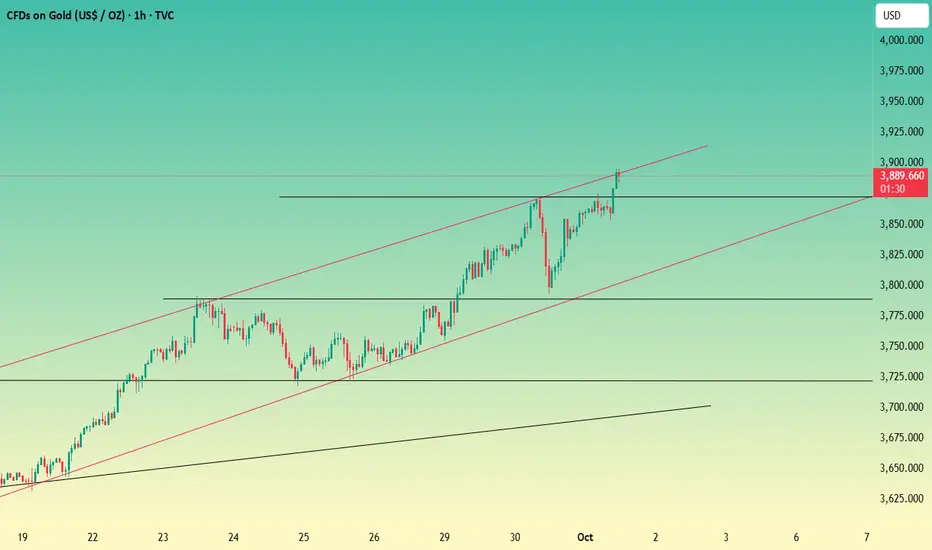
Gold prices soar, where will the short positions go?Currently, gold is encountering resistance and falling back near 3893-3895, and the bullish momentum has weakened slightly. As mentioned earlier, the current price has reached our risk area. A large part of the reason for today's rise is that the US government has officially shut down. This kind of news-stimulated rise is not long-lasting. After encountering resistance, it will fall like a waterfall. The technical indicators have diverged and are overbought, and most funds cannot participate in long transactions in this extreme rising pattern. In order to increase liquidity, gold also needs a correction, so we consider continuing to short gold near 3893. To increase liquidity, gold also needs a pullback, so we are considering continuing to short gold around 3893.
Resistance: 3900, 3925
Support: 3872, 3843
Gold Bias and Directionchart shows excellent defense at the bullish fvg no closures below 50 percent indicates strong buying power. now we have 4hour order block being tested if respected i think will push price to 3790

XAU/USD: PCE Data Awaits as Gold Consolidates Above Key SupportFundamental Overview
The fundamental outlook suggests that Gold (XAU/USD) is under significant pressure following the release of robust US economic data yesterday. Key figures such as Durable Goods Orders (MoM) (2.9% vs. -0.3% expected), GDP (QoQ) (3.8% vs. 3.3% expected), and Initial Jobless Claims (218K vs. 233K expected) all substantially outperformed forecasts. This unexpected strength in the US economy delivered a bullish shock to the US Dollar (USD), indicating remarkable resilience. A strong US Dollar is inherently a bearish factor for Gold, triggering its current phase of consolidation or correction.
Market focus shifts entirely to tonight's US inflation data: the Core PCE Price Index for August. As the Federal Reserve's preferred inflation gauge, this data will be the primary catalyst for price movement. If the Actual PCE figure is released below expectations, it would signal cooling inflation, likely weakening the USD and potentially triggering a Gold rally. Conversely, if the Actual PCE meets or exceeds expectations, it will reinforce the already strengthening USD sentiment, threatening to push XAU/USD sharply lower.
Technical Analysis & Trading Strategy
On the 1 Hour chart, Gold is currently forming a Symmetrical Triangle pattern, confirming a phase of indecision after its earlier explosive ascent. The critical support level of this triangle lies near $3,720, while the key resistance is around $3,770. The price is tightly coiled within these boundaries and is expected to experience a high-volatility breakout, likely triggered by the PCE release. The 4-hour Stochastic momentum indicator sits in the neutral zone (40-50), confirming that Gold has room to move in either direction without immediate overbought or oversold constraints.
Therefore, the most prudent trading strategy is to wait for confirmation of the triangle breakout. If Gold successfully breaks above $3,770 (supported by USD-Bearish data), the potential targets are $3,790 up to $3,825. Conversely, if Gold suffers a breakdown below $3,720 (driven by USD-Bullish data), the next key correction target is the demand zone near $3,677. Given the guaranteed high volatility, strict risk management is essential.

GOLD XAUUSD GOLD POTENTIAL SELL AND BUY ZONE S .
DEMAND FLOOR 1 @ 3814-3809
DEMAND FLOOR 1 @ 3787.34-3785 ZONE
SELL ROOF @3876 -3885
SELL ROOF @ 3833-3828
THE GOLD PRICE WILL CONTINUE TO RISE AMID OVERBOUGHT CONDITION .
GOLD ON TECHNICAL WILL RECLAIM 4000$ ,if gold rally into 4000$ it will trigger a new era for the yellow metal as a store of value.
its GOLD OR NOTHING.
#GOLD #XAUUSD #DOLLAR #US10Y

Gold Intraday Trading Plan 9/30/2025Gold has been rising without much retrace recently. It's difficult to engage buying orders at this moment. Hopefully, it could retrace for me to take some buys. I am looking to buy from 3786-3795 area and target to at least 3855.
It will be interesting to see the price actions in 3855-3882 zone. Gold may be rejected and have some serious corrections from there.

GOLD XAUUSD GOLD 30MIN structure ,the structure of the market wont lie.. lets look into 3835-3845 zone.
i called a buy at 3758-3760 and we stood on that structure ,look at where we are...its the hand of GOD.
ITS THE HAND OF GOD .
#GOLD #XAUUAD

XAUUSD 1H Analysis(29th September 2025)BUY/SELL SCENARIOS:
BUYS:
1) Body candle close above the 3774.85 level.
2) Retest the failed 1h Bearish FVG at the 3774.85 level.
3)Create a 3/5m Bullish Engulfing Candle to capitalise on BUYStowards the 3800.00 level.
SELLS:
1) Retest the 1h Bearish FVG at the 3769.47 level.
2) Create a 3/5m Bearish CHOCH with a body candle close (with a FVG).
3)Retest the 3/5m Bearish CHOCH level to capitalize on SELLS towards the 3735.00 level

#GOLD WILL THE correction continue ATHResistance level:3760-3776-3791
Support levels:3752-3741-3731i expect a pullback 3737-3717 and if the bulls return the price to 3800.
my forecast on #gold is 3880.
By; Honey-trading!

Bearish Opportunity🟡 Gold (XAUUSD) 15m Analysis – 25 Sept 2025
Gold bounced from the recent lows and is currently retesting the 3750–3755 zone, showing short-term bullish momentum. However, the overall structure suggests a possible pullback.
📊 Key Levels:
Resistance: 3774 – strong supply zone & intraday top
Entry Zone: 3752–3755 rejection
Target: 3700–3705 (–1.38%)
Stop Loss: 3774 (above recent swing)
Risk/Reward: 1:2.5 approx.
📉 Indicators:
MACD turning down after momentum peak
Histogram showing loss of bullish strength
Volume spike suggests potential exhaustion at highs
⚡ Bias: Short-term bearish if price rejects 3755–3774 zone, targeting 3700.

Target 4000 GoldImportant week for Gold, we will have Payroll on Friday and we can look for new highs
We have a Bullrun up channel that has been holding for a long time, and it may be reaching Pullback levels.
We have an important reversal point if a price meltdown occurs, be alert in this region marked on the chart, a possible break in structure and retest could confirm this movement.
Possible pullback movement with target at 4000, it may be that this week there is no strength to seek but it is a target to be beaten if this bull run continues
Breaking this region marked as resistance, seeking liquidity above, giving strength to the possible 4000, this week can tell us where we will go this month of October.

How much further can gold fall?From 3758 to 3871.5, nearly $113, it surged nearly $50 today. However, after breaking the high, it reversed course and fell again, dropping over $60.
A sharp drop and slow rise is just the right way to describe today. The current situation is that the price continued to rise and break new highs in the Asian session, then rose and fell in the European session, breaking the lows. After breaking the highs, it broke the lows again, entering a period of correction.
Technically, there is also a need for correction. Once the highs are confirmed, a new round of market movement begins.
The scope for correction is currently estimated to be around $80-100. Of course, judging by the current trend, the price has already fallen below the 3810 area, a drop of over $60.
Expanding the range to $100 could be just a matter of minutes. Keep an eye on the 3800 area, with a particular focus on the 3775 range.
For bulls, Considering this surge, which has already exceeded $500, the largest gain this year, the upward potential is limited, and technical corrections are imminent. Before the previous decline began, we held onto our highs. Now that a decline is likely, we should hold onto our highs even more. As for buying lows, we should wait until the current downward momentum has fully unleashed.
Using the 3880 area as resistance, I began shorting. As the price continues to fall, I've continued to follow the bearish trend.
Currently, the price is in the 3820 area, and I continue to be bearish. Focus on 3805-3800. If it falls below, I'll target 3875.
If you're feeling lost and unsure about where to go in this market, follow my updates and channel. I'll provide daily updates, including details on both long- and short-term trade executions. If you're interested, please share your current positions so we can analyze whether it's safer to hold on patiently or adjust and change positions promptly.

Avoid chasing highs and beware of the risk of a sharp drop.Market expectations of further Federal Reserve easing and the risk of a US government shutdown have intensified safe-haven demand, supporting the continued rise in gold prices, reaching new all-time highs. Gold prices are currently on a tear, rising by around $70 today, from around 3760 to around 3830. This surge has been so rapid that there's been no pullback. However, the more this market continues, the greater the risk of a sharp drop.
Gold is currently fluctuating around 3830. Tonight, we should continue to invest in gold on pullbacks. It's okay to be bullish, but don't chase the gains. Technically, some pullbacks are needed, so avoid chasing highs to prevent the market from faltering and leading to a pullback. The higher the position in a relatively short period of time, the more you should be aware of the risk.
Trading is all about timing, location, and people. Choice is more important than effort. This statement is vividly reflected in trading. Working tirelessly through volatility is not as good as winning by following the trend! Regardless of whether you are going short or long, you must set a stop loss, otherwise don't operate. Carrying orders is always the most taboo. Of course, remember not to touch the top of the gold market at present.

Expectations of a Fed rate cut + risk of a government shutdown?
News:
US PCE data maintains expectations of rate cuts, gold prices supported
The US Congress failed to pass a funding bill before the end of the fiscal year on Tuesday, prompting a partial government shutdown starting on Wednesday. This risk could delay the release of Friday's non-farm payroll report, affecting market sentiment regarding the economy and expectations for Federal Reserve policy.
Specifically:
Concerns about a US government shutdown have fueled a continued influx of safe-haven funds into the gold market. After stabilizing in the 3760 area early in the session, the price surged sharply, reaching a new all-time high and currently hovering around $3810.
From a market perspective, gold bulls remain strong. This morning's low of 3760 has become key support for bulls. As long as this area remains below, the market remains bullish; any unexpected break below this level would only be a temporary correction.
Strategy:
Long Position3790-3800,SL:3780,Target:3820-3835

XAUUSD — Base Analysis (D1 focus)Market State
Range: Upper band at fresh highs; prior sideways box ~3,450–3,350 → breakout above
Slope: Uptrend (strong)
Base Bias: Upside continuation even with pullbacks; first, expect the ~3,700 area to hold
Key Levels
Resistance: 3,820 → 3,900 → 4,000 (psychological)
Support: 3,700–3,680 (breakout base) → 3,600 → 3,520–3,480 → 3,420–3,350 (old box top/bottom)
Decision Rules (plain)
D1 close above 3,700 and retest holds ⇒ Upside scenario active
Targets: 3,820 → 3,900 → 4,000
D1 close below 3,700 ⇒ Correction scenario active
Targets: 3,600 → 3,520–3,480 → 3,420–3,350
Working Note
This is a technical price-structure read; for entries, seek break + retest confirmation on H4/M15.
The base bias weakens with sustained trade below 3,700 and subsequent loss of 3,600; it re-strengthens on a D1 close back above 3,820.
