XAUUSD | Bullish continuationGOLD has recently broken its last High, shifting market structure and indicating Buyers are still in control. This break opened up a clear Demand Zone below, a small base or last bearish candle before the rise, which is a key area where unfulfilled buy orders may be resting.
Price is likely to retrace back into this Demand Zone to fill those orders. Once it reaches this area, we expect buying pressure to resume and push price upward, honouring the imbalance left by the rise.
Entry:
I’m looking to buy from this Demand Zone on a pullback, adding to go long when price enters this area. This lets me enter at a discount price while trading in direction of the newly established upward momentum.
Target:
The first Target Profit (TP) is set at the next supply Zone above, where selling pressure might emerge.
Stop Loss:
To control risk, the Stop Loss (SL) is placed just below the demand Zone.
If price drops below this area, it would invalidate the demand’s ability to hold, signalling a potential reversal.
✅ Summary:
• Market is bullish
• Demand Zone below is a key area to watch for buying opportunities.
• Buy upon retracement into Demand, with Stop Loss below and Target at supply above.
GOLDCFD trade ideas

Latest Gold Trading Strategy for October 1st:
I. Key Drivers and Market Sentiment
Policy Expectations Dominate the Market: Expectations for Fed rate cuts are currently the strongest driving force. High market anticipation for consecutive rate cuts in October and December has led to a weaker US dollar and declining real interest rates, significantly boosting gold's appeal.
Safe-Haven Demand Provides Support: Persistent political risks and geopolitical conflicts reinforce gold's status as the ultimate safe-haven asset.
Technical Breakout Confirmed: Gold prices broke decisively above the $3800 mark on Monday (September 29th) and closed above it, marking the largest single-day gain since August. This technical breakout confirms a shift in market sentiment towards bullishness.
II. In-Depth Technical Analysis
Long-Term Trend: Strongly Bullish. The daily candle closed as a decisive large bullish candle, confirming the uptrend.
Key Breakout: Successfully broke through the previous resistance zone of $3791 - $3795, which has now converted into a core support area.
Short-Term Signals:
Despite the bullish trend, the market requires a technical correction after the sharp rally. Tuesday's "deep V" shakeout ($3872 → $3793 → $3852) confirms this need.
Core Operating Principle: Against the backdrop of a major bullish direction, view short-term pullbacks as opportunities to enter long positions in line with the trend, not as a reversal.
III. Specific Trading Strategy
Core Approach: Prioritize buying on pullbacks in line with the trend, remain cautious of adjustments at high levels, and secondarily consider light short positions at key resistance.
Key Levels:
Core Support Zone: $3790 - $3800 (The "resistance-turned-support" area formed after the breakout, crucial for bulls)
Near-Term Resistance Zone: $3855 - $3865
Stronger Resistance Zone: $3870 - $3880
1. Primary Strategy: Buying on Pullbacks (Preferred)
Entry Zone: Consider scaling into long positions when gold retraces to the $3800 - $3810 range.
Profit Target: $3855 - $3865
Risk Management: Set stop-loss below $3790 (a break below key support).
2. Secondary Strategy: Selling Rallies (Cautious Approach)
Entry Condition: Only if gold rallies to the $3855 - $3865 resistance zone AND shows clear rejection signals (such as a bearish divergence and crossover on the 1-hour or 4-hour chart), consider initiating light short positions.
Profit Target: $3820 - $3800
Risk Management: Set stop-loss above $3875 (a break above the recent high).
IV. Key Risks and Important Notes
Trend is King: The current market is bullish. The primary strategy should follow the trend. Trading against the trend with short positions is difficult and should be done with light capital and a quick exit mindset.
Breakout Response:
If gold breaks strongly above $3880, it signifies that new upside space has opened. Short strategies should be abandoned immediately, and one might consider following the breakout with long positions.
If gold decisively breaks below $3790 (e.g., daily close below), a deeper correction towards the $3750 - $3730 area is possible. Long positions should be exited decisively.
Strict Execution: It is advisable to trade with light positions, always use stop-losses, and practice sound capital management. Market liquidity may vary during holidays, warranting vigilance against abnormal volatility.

GOLD XAUUSD GOLD XAUUSD, 1hr break and retest seem to be the impetus for higher buy despite newyork buy back from London gold market selloff.
if we touch 3870-3872.5 expect a rejection on 1hr or 4hr ,if we break and close above this zone 3890 -3900 zone .this level will be watched with a possible target into 3954-4000$
on a flip side a break of demand floor will be another 700pips or more.


Gold 1H – Correction or Continuation After Supply Test?Gold on the 1H timeframe is trading near 3,861 after consolidating below a premium supply zone at 3876–3874. Structure shows a recent BOS to the upside, but current rejection signals potential engineered liquidity sweeps into the nearby FVG and discount demand zones. The first support rests at 3796–3798, aligning with discount territory and previous accumulation, offering scope for continuation if price reacts positively.
From the macro side, today’s headlines point to persistent U.S. dollar strength as traders await fresh Federal Reserve guidance on inflation and rate path. Meanwhile, heightened geopolitical concerns in energy markets are maintaining safe-haven flows, adding volatility to gold’s intraday swings.
This dual backdrop sets up a tactical approach: fading rejections at supply while being prepared to enter on discounted dips at demand.
________________________________________
📌 Key Structure & Liquidity Zones (1H):
• 🔴 SELL GOLD 3876–3874 (SL 3883): Premium supply zone, downside targets at 3850 → 3835 → 3815.
• 🟢 BUY ZONE SUPPORT 3796–3798 (SL 3790): Discount demand zone aligned with BOS, upside targets at 3820 → 3845 → 3860+.
________________________________________
📊 Trading Ideas (Scenario-Based):
🔻 Sell Setup – Supply Rejection (3876–3874)
• Entry: 3876–3874
• Stop Loss: 3883
• Take Profits:
TP1: 3850
TP2: 3835
TP3: 3815
🔺 Buy Setup – Demand Mitigation (3796–3798)
• Entry: 3796–3798
• Stop Loss: 3790
• Take Profits:
TP1: 3820
TP2: 3845
TP3: 3860+
________________________________________
🔑 Strategy Note
Gold remains in a corrective phase after testing supply. Expect liquidity sweeps into discount levels before continuation. With the dollar strengthening and Fed commentary in focus, intraday traders should:
• Fade supply rejections at 3876–3874.
• Scale into buys around 3796–3798 if liquidity is cleared.

Gold experiences a correction. The bull market continues.Gold saw a sudden and significant pullback on Tuesday, but under the influence of a series of risk-averse news related to the potential US government shutdown, gold bulls rallied again, pushing prices higher. Gold closed the day at a high level. The strength of the gold bulls remains robust; this single-day correction suggests that the upward momentum for gold is still strong.
Although gold fell significantly, it did not break below the key support level of 3791, indicating that the bears did not gain complete control. After a short-term correction, the bulls launched a counterattack. The 1-hour moving average for gold remains upward, with no signs of a trend reversal. The bullish momentum for gold is still strong, and the moving average support has now moved to around 3828.
Quaid believes that gold may continue its upward trend, as the current gold bull market is unlikely to end soon. Quaid recommends continuing to buy on dips, maintaining a bullish stance on gold.
Trading Strategy:
Buy around 3825-3830, with a stop loss at 3805, and target profit levels of 3865-3875.

Gold enters the overbought zone, you can short it on ralliesWhy is gold so strong? Ultimately, it's driven by multiple factors: the Federal Reserve entering a cycle of rate cuts, financial and trade factors, and war. However, this doesn't mean gold won't need a short-term correction! Large cycles provide directional guidance, while smaller cycles determine the rhythm.
Yesterday, the gold market completed its final formation for September. After a strong, volatile rally at the beginning of the month, it broke through multiple round numbers, reaching a record high of 3872 in late trading before consolidating. The monthly line finally closed at 3858, forming a large, saturated bullish candlestick with a slight shadow. This monthly gain of over $400 is primarily due to the Federal Reserve's initiation of a new round of rate cuts against the backdrop of poor US data, which heightened market risk aversion, and the intensified conflict in the Middle East and between Russia and Ukraine. This strong upward trend has led to a strong upward trend. While this large bullish candlestick has the technical potential to continue its upward trend, a rapid short-term rise can also lead to a technical divergence. If the market continues to rise without adjustment and encounters resistance, it can easily lead to profit-taking.
As mentioned before, the increase this time has exceeded 500 US dollars, which has entered our risk zone. Technically, it has deviated from the pattern and entered the overbought zone. Most people in the market are bullish now, but I think the benefits of chasing the rise now are greater than the risks, and there are still opportunities to make profits by shorting gold. So today we are still considering shorting gold on rallies.
Resistance: 3872, 3893
Support: 3843, 3812
If you don't have a detailed trading plan for gold, follow my updates. I'll update my strategies and ideas daily for your reference, helping you avoid detours on your trading journey.

Gold RollerCoasterLike posted before we bounced off the trend line from todays low of $3,793 to 3,854. We did good there. Profiting in the NY market open. Support looks to build volume around $3,836. With mixed data this should rebound us back into London session highs around $3,870 and where I believe will be the top of tops at $3,880 before a sell off begins. Remember this is the last day of the month before a possible red October.
Good Luck To All, This is not financial advice
-R2C

Gold Weakens - Bearish Eyes on 3770Hello Followers, I am going to share you my opinion on gold next move..
Gold is respecting the parallel channel really very well and now it has break the middle line of parallel channel and now it is possible that gold can move further low till the lower line of parallel channel. Gold is forming a higher lows . Currently it is now at 3820 and according to me gold will further fall and now gold is at a resistance area and it is respecting it superbly.. So now next move is possible around 3770.
KEYPOINTS:
Entry-level 3820
Target 3770
Stoploss 3840
Resistance 3822/3831

Gold Energy build up supported at 3703The Gold remains in a bullish trend, with recent price action showing signs of a continuation pause within the broader uptrend.
Support Zone: 3703 – a key level from previous consolidation. Price is currently testing or approaching this level.
A bullish rebound from 3703 would confirm ongoing upside momentum, with potential targets at:
3785 – initial resistance
3800 – psychological and structural level
3820 – extended resistance on the longer-term chart
Bearish Scenario:
A confirmed break and daily close below 3703 would weaken the bullish outlook and suggest deeper downside risk toward:
3670 – minor support
3640 – stronger support and potential demand zone
Outlook:
A bullish bias remains intact while the Gold holds above 3,703. A sustained break below this level could shift momentum to the downside in the short term.
This communication is for informational purposes only and should not be viewed as any form of recommendation as to a particular course of action or as investment advice. It is not intended as an offer or solicitation for the purchase or sale of any financial instrument or as an official confirmation of any transaction. Opinions, estimates and assumptions expressed herein are made as of the date of this communication and are subject to change without notice. This communication has been prepared based upon information, including market prices, data and other information, believed to be reliable; however, Trade Nation does not warrant its completeness or accuracy. All market prices and market data contained in or attached to this communication are indicative and subject to change without notice.

'Gold at the Top? Why Chasing Isn’t the Only Way Traders Profit'Gold has been on a strong rally recently, breaking through key resistance levels and attracting a lot of attention. Many traders are asking: “Is it still a good opportunity to buy from the top, or are we chasing?”
From a technical view, I see potential pullback zones forming — which could either give continuation or a trap for late buyers. Timing here is crucial.
But here’s something most traders overlook…
While trading opportunities like gold can be profitable, they’re also uncertain. Some traders I know have built a more stable, recurring income stream — not just from their trades, but also by leveraging their trading network and connections. It’s an angle worth exploring if you want something steadier to complement your trading.
👉 I share more about this perspective on my profile if you’re curious.

Gold (XAUUSD) – 29 Sep | Key Demand Zones in Focus🟡 Gold (XAUUSD) Analysis – 29 September
Hello Disciplined Traders,
Welcome to the Chart Is Mirror Community 👋
Market Context
• Gold remains in bullish momentum with H4 and M15 structure aligned.
• Price printed a Change of Character (ChoCh) + Break of Structure (BoS) along with a new all-time high at 3798.79 , confirming bullish intent.
Key Zones to Watch
• Primary POI for Long Setup: 3770.8–3759.8 demand zone (also M15 HL).
• Secondary POI for Long Setup: 3752.5–3743 strong demand zone.
– Below this zone sits unmitigated sell-side liquidity . Price could sweep this liquidity before a strong up-move.
Execution Plan
• Wait for price to pull back to either POI.
• Look for clear LTF confirmation before executing a buy setup.
• If price stays above 3795 and forms new price action, reassess and look for fresh opportunities — as long as bullish structure remains intact .
Stay patient and let price come to your levels — discipline is your edge.
📘 Shared by @ChartIsMirror

With data week coming up, we need to update our gold strategy.
Gold opened lower in the morning and continued to rise. Stimulated by various risk-averse news, the yellow metal rose again. However, the early morning surge did not reach a new high. Don't rush into long positions. Gold has been experiencing a volatile and volatile market lately. While the overall upward trend remains strong, short-term sustainability is lacking. Our early morning recommendation is that short-term resistance at 3800 is valid, and a short-term short position could be initiated at this level.
This week, the impact of the non-farm payroll data week on the gold market will be closely watched. Wednesday will be influenced by the small non-farm payroll ADP data, Thursday by the unemployment benefits data, and Friday by the non-farm payroll data. Therefore, we should pay special attention to the market trends on Wednesday, Thursday, and Friday. On Monday and Tuesday, in principle, gold is unlikely to experience significant fluctuations without the influence of market data, but the trend is clear, and the upward trend remains the main driver.
Operationally, the support area for gold's early hourly trading volume is around 3745. If gold falls back to this support area in the morning, it is advisable to continue buying on dips. Specific buy points are provided in the channel.
For investors who currently have positions or are not sure how to trade, please like and visit my homepage to enter the channel. I will provide exclusive trading services for members!

$XAU updates Currently rolling like a boss on this one!!!!
Targets extended here from previous post of $3816 to try and run out $3900!
Crucial at $3857 which I think she’s hunting out right now…
Let’s See 🫶🏽

XAUUSD Long Setup: Bullish Retest of Flipped SupportHello TradingView Community,
This is a technical analysis of a potential long opportunity on Gold Spot / U.S. Dollar (XAUUSD) based on the 15-minute timeframe.
Technical Analysis:
The chart is currently demonstrating a bullish market structure. A key horizontal level has been identified at approximately $3,737.37. This level previously acted as a significant resistance, capping the price on multiple occasions.
We have recently witnessed a strong breakout above this resistance, signaling buying strength and a potential continuation of the uptrend. The trading idea is based on the classic "resistance-turned-support" principle. We are anticipating a pullback to this broken resistance level, which is now expected to act as a new support floor. A bounce from this area could provide a solid entry for a long position.
Trade Setup:
The long position tool on the chart outlines the specific parameters for this potential trade:
Entry: Approximately $3,737.37 (at the retest of the new support).
Stop Loss: $3,698.76 (placed below the support structure to invalidate the bullish idea if the level fails to hold).
Take Profit: $3,849.67 (targeting a new higher high, continuing the trend).
This provides a clear risk management plan and a favorable risk-to-reward ratio for a potential move higher.
Disclaimer: This is for educational and informational purposes only and does not constitute financial advice. Trading commodities and other financial instruments carries a high level of risk. Please do your own research and manage your risk accordingly.

Gold Trade Set Up Sep 28 2025Price broke structure to the downside on the 15m on friday so i will want to see a pullback into supply before a continuation down towards PDL/SSL
www.tradingview.com

XAUUSD Weekly Scenarios⚙ Weekly Scenarios
Bullish Scenario:
The price holds above support at ~$3,660 and breaks resistance at ~$3,760–3,800.
Then, a rally to $3,900 and beyond is possible, especially with support from rate and geopolitical news.
Consolidation:
The price may move sideways between $3,660 and $3,760 until a strong signal (from news or volume) breaks the range.
Bearish Scenario:
A break below $3,660 with volume confirmation could lead to a correction to $3,600 or even lower.
In this case, it's important to watch whether lower support levels hold, otherwise a deeper pullback is possible.
🔎 Conclusion
The overall picture for the week is bullish, but with the risk of a pullback or consolidation due to overbought conditions and resistance.
Key: Watch for a reaction in the resistance zones of ~$3,760–3,800 and for support to hold at ~$3,660.
For traders: consider buying on dips near support zones and shorting (or taking profits) as the price approaches strong resistance if it fails to break through.

Traders Watch Gold Surge Ahead of Fed’s Next MoveGold 1H – Consolidation Before Fed Clarity
Gold on the 1H timeframe is currently trading around 3,746, moving within a well-defined consolidation range. Price action highlights a premium supply zone at 3,775–3,773 and a discount demand zone at 3,723–3,725. The market structure shows earlier signs of BOS and ChoCH, with engineered liquidity sweeps becoming evident. A potential Mitigation → Expansion sequence is in play, where a liquidity grab near discount demand could fuel a bullish leg toward premium supply.
From a macro perspective, today’s headlines underscore the cautious stance across financial markets as investors await the Federal Reserve’s upcoming guidance. Lingering inflationary concerns, coupled with speculation around the timing of future rate cuts, have kept volatility elevated. Meanwhile, geopolitical risks continue to underpin safe-haven demand for gold, adding an extra layer of support at discount levels.
This combination of technical liquidity zones and macro uncertainty sets the stage for tactical plays: fading moves into the supply zone while remaining prepared for dip-buying opportunities at defined demand areas.
________________________________________
📌 Key Structure & Liquidity Zones (1H):
• 🔴 SELL GOLD 3,775–3,773 (SL 3,782): Supply zone coinciding with a buy-side liquidity pool above 3,780, offering downside targets at 3,760 → 3,745 → 3,730.
• 🟢 BUY GOLD 3,723–3,725 (SL 3,718): Discount demand aligned with liquidity grab potential, with upside targets at 3,745 → 3,760 → 3,775+.
________________________________________
📊 Trading Ideas (Scenario-Based):
🔻 Sell Setup – Supply Rejection (3,775–3,773)
• Entry: 3,775–3,773
• Stop Loss: 3,782
• Take Profits:
TP1: 3,760
TP2: 3,745
TP3: 3,730
🔺 Buy Setup – Demand Mitigation (3,723–3,725)
• Entry: 3,723–3,725
• Stop Loss: 3,718
• Take Profits:
TP1: 3,745
TP2: 3,760
TP3: 3,775+
________________________________________
🔑 Strategy Note
With the Fed’s next move looming, traders should anticipate engineered sweeps into both premium and discount liquidity pools before the market establishes clearer direction. The tactical edge comes from aligning intraday setups with liquidity hunts:
• Fade supply at 3,775–3,773 if rejection confirms.
• Buy dips into 3,723–3,725 if liquidity is swept cleanly.
The broader narrative of inflation concerns, dollar sensitivity, and safe-haven flows reinforces the case for two-sided opportunities. Expect gold to remain volatile within this consolidation range, with sharp moves likely as liquidity is targeted ahead of Fed clarity.

PLAN DAY 26-SEP-25Related Information:!!!
Strong data point to the resilience of the economy despite headwinds from U.S. President Donald Trump’s trade tariffs. In fact, on Thursday, Trump announced a 100% tariff on imported branded or patented pharmaceutical products, a 25% tariff on all imported heavy-duty trucks, and a 50% tariff on kitchen cabinets, effective October 1.
Personal opinion:!!!
Gold price hit an all-time high (ATH) 3784 and then moved sideways 3778-3750.
Support zone point: 3750ted Information:!!!
Strong data point to the resilience of the economy despite headwinds from U.S. President Donald Trump’s trade tariffs. In fact, on Thursday, Trump announced a 100% tariff on imported branded or patented pharmaceutical products, a 25% tariff on all imported heavy-duty trucks, and a 50% tariff on kitchen cabinets, effective October 1.
Personal opinion:!!!
Gold price hit an all-time high (ATH) 3784 and then moved sideways 3778-3750.
Support zone point: 3750, 3740 zone

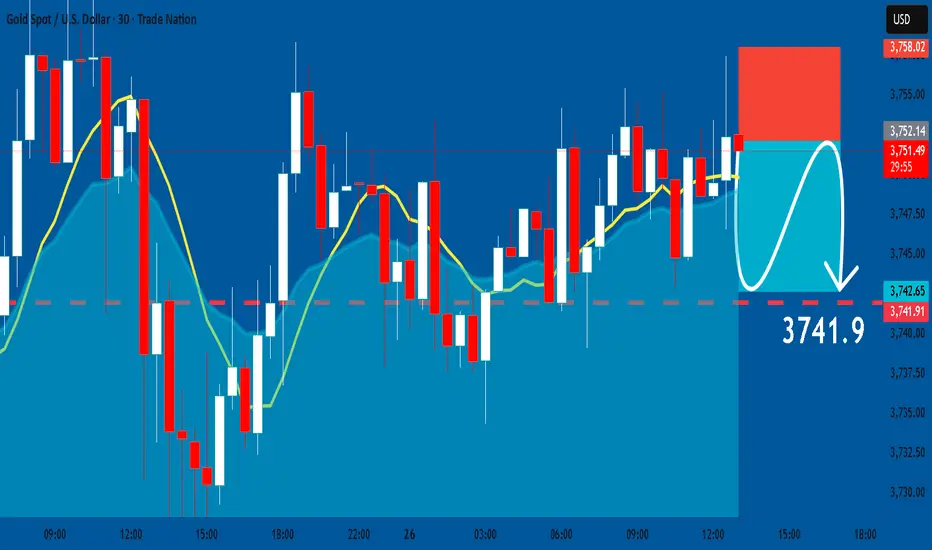
GOLD: Short Signal Explained
GOLD
- Classic bearish formation
- Our team expects fall
SUGGESTED TRADE:
Swing Trade
Sell GOLD
Entry Level - 3752.2
Sl - 3758.0
Tp - 3741.9
Our Risk - 1%
Start protection of your profits from lower levels
Disclosure: I am part of Trade Nation's Influencer program and receive a monthly fee for using their TradingView charts in my analysis.
❤️ Please, support our work with like & comment! ❤️
Gold XAUUSD Intraday Setup 26.09.2025Price is currently approaching the supply/resistance zone between 3757–3761, where multiple rejections and liquidity sweeps have previously occurred. The expectation is for sellers to step in within this region, making it a high-probability entry for shorts. The stop loss is set at 3774, just above the recent swing high and invalidation point, ensuring protection against a breakout scenario. The downside target is 3719, which aligns with the next significant support level and prior demand zone, offering a clean risk-to-reward structure. If price reacts as anticipated from the marked zone, we could see a sharp move down toward the target, making this setup attractive for traders looking to capitalize on bearish continuation.

26/9/68 : XAUUSD ( Europe / London Session )Using it from Europe Session until 7.00PM , I'll new analysis and update at 8.00PM
Resistance
3769-3774
3759-3764
3753
Support
3743
3733-3738
3722-3728

Gold Market AnalysisGold Market Analysis | Strong Data Pressures Gold Prices; Technical Analysis Focuses on Key Support
Fundamentals Update
The revised annualized quarterly rate of real GDP for the second quarter of the United States was 3.8%, significantly higher than the previously reported 3.3%, reflecting the strongest economic growth in nearly two years. The government also revised upward its estimate of consumer spending, indicating continued strengthening economic resilience. Market expectations for tonight's August PCE data show a year-on-year increase of nearly 3%, suggesting continued inflationary stickiness. Strong economic data and stubborn inflation expectations are supporting the US dollar and suppressing gold prices.
Although the economic data is bearish for gold in the short term, geopolitical risks and central bank gold purchasing demand continue to provide medium- to long-term support for gold prices. Focus on market sentiment changes before and after the release of the PCE data. For trading, focus on key price breaks and maintain strict risk management.
Technical Analysis and Strategy
Gold prices have been fluctuating downward today, rebounding to $3,761 in the Asian session before retreating under pressure and currently consolidating around $3,720. Technically, $3,717 represents a key support level. If it breaks below, gold prices could enter a volatile downward trend; otherwise, a volatile platform is expected to form. Upside resistance is expected around $3,745.
The hourly moving average is in a bearish formation, with prices consolidating around the low level of $3,730. Despite negative initial jobless claims data from the US market, gold prices did not decline in response. Instead, they rebounded to $3,745 before falling back under pressure, indicating a limited market reaction to the data. Currently, prices remain above the key intraday support level of $3,718-23, indicating no signs of weakening overall.
Trading Recommendations:
Short Trading Strategy: Conduct a light short position on a rebound to the $3,745-3,755 area, with a stop-loss above $3,762, and target $3,717-3,700.
Trading Strategy:
✅ Long Position: Enter after a pullback to the 3718-23 area and stabilization
🛑 Stop-loss: Below 3709
🎯 Target: 3756-65
The current trend is still in the correction range. We recommend remaining patient and placing long positions within key support areas, avoiding blindly chasing orders at intermediate prices. Maintain strict risk management and wait for price stabilization signals. ⚡
