September 2025 Market Summary Gold and ForexProjectSyndicate Market Summary September 2025
📊 MTD performance
🟡 GOLD (XAUUSD): 3,759.65 | +286.65 (+8.31%)
💶 EURUSD: 1.1702 | +16 pips (+0.14%)
💷 GBPUSD: 1.3392 | −112 pips (−0.83%)
💴 USDJPY: 149.19 | +211 pips (+1.43%)
📈 SPX: 6,637.97 | +236.46 (+3.69%)
📈 NDX: 24,503.57 | +1,483.10 (+6.44%)
________________________________________
🗞 September overview
• 🇺🇸 The Fed cut 25 bps on September 17 and flagged the possibility of further cuts this year, reinforcing a softer USD bias and boosting gold demand.
• 🇪🇺 The ECB held rates on September 11, though left the door open for easing later.
• 🇬🇧 The Bank of England held rates and slowed quantitative tightening on September 18.
• 🇯🇵 The BoJ maintained a “hawkish hold” on September 19, started unwinding ETF/REIT holdings, and signaled possible rate risks into October — supporting JPY on abrupt USD strength.
• 🟡 Gold made a fresh intramonth high near ~$3,790, before settling slightly lower.
• Stronger U.S. economic data mid-month (jobs, yields) briefly undercut rate cut expectations, leading to a temporary gold dip, but the momentum has largely resumed.
• Tariff announcements and trade-policy uncertainty added safe-haven tailwinds to gold.
________________________________________
🟡 Gold Market Overview – September 2025
✨ Key Highlights & Drivers
• All-time high revisit: Spot gold pushed toward $3,790 mid-month on renewed enthusiasm for Fed easing and weaker USD.
• Volatility around economic surprises: Upside surprises in US data (jobs, GDP) triggered brief USD strength that pressured gold, but the downside was limited.
• Fed narrative remains gold’s ally: The dovish pivot (25 bps cut + future cuts flagged) continues to lend structural support to gold.
• ETF & institutional flows: Inflows into gold ETFs have reaffirmed investor appetite for safe-haven exposure.
• Risk / geopolitical spillovers: Oil price jitters, trade frictions, and general macro uncertainty underpin demand for non-correlated assets.
• Technical posture: After surging, gold has found interim support in the region of ~$3,650–3,700, with resistance clustering near $3,800. A sustained break above the latter could open targets toward $3,900+.
📊 Performance Recap
Gold has posted one of its strongest monthly performances of 2025, currently up ~8.7 % MTD.
Stronger parts of the rally were clustered around rate cut confirmation and safe-haven demand spikes.
🔍 Risks & Watch-Outs
• A surprise resurgence in U.S. economic strength (inflation, jobs) could push rate markets back toward dovish skepticism, pressuring gold.
• A re-strengthening USD (driven by rates or yield spreads) will be headwind for dollar‐priced gold.
• Central bank actions: further buying or selling by official sectors could tilt balance.
• Technical overextension: short-term pullbacks or consolidations are plausible given the sharp run-up.
________________________________________
💱 FX Landscape – September 2025
• EURUSD: The pair remains stuck under ~1.1700, recovering modestly from USD spikes but lacking strong directional conviction.
• GBPUSD: Under pressure through the month, sliding toward 1.3350 as sterling weakens on yield differentials and global risk dynamics.
• USDJPY: Strength in yields and risk dynamics have nudged USDJPY higher, though BoJ vigilance and intervention risk temper runaway moves.
Broader theme: while risk sentiment supports carry / USD strength, central bank policy cycles and macro surprises are injecting volatility and preventing runaway trends.
________________________________________
📝 Summary & Key Takeaways
✅ What Worked in September
• Gold leveraged dovish central bank messaging and USD softness to consistently outperform across risk regimes.
• Positioning toward safe havens paid off in a month marked by macro surprises and geopolitical noise.
• FX markets remained choppy, with no clear trending momentum — caution was rewarded.
⚠️ What to Watch Going Forward
• U.S. data flow — especially inflation, jobs, and PCE — could reshape Fed expectations and thus gold/FX direction.
• USD momentum — a reversal in dollar strength could compress gold gains; sustained USD weakness could accelerate the bull run.
• Intervention / central banks — any surprises from BoJ, PBoC, or central banks stepping into gold or FX markets could upend positioning.
• Technical zones — if gold can break and hold above $3,800, it may open new leg toward $3,900+; failure may invite a pullback toward $3,650–3,700.
GOLDCFD trade ideas

Gold consolidating between two key ranges above recent highsGold is currently consolidating between two key ranges after failing to sustain above recent highs. The metal hovered below 3740 per ounce on Thursday, marking its second consecutive decline since hitting a record high of 3792 earlier in the week. The pullback was driven largely by strong U.S. economic data, which strengthened expectations for higher interest rates, weighing on non-yielding assets like gold.
Technical Outlook:
From a technical perspective, before attempting another move toward the resistance zone near 3792, gold may first retest local support levels. A small correction or pullback is likely as part of this consolidation phase. If the support holds, a renewed push toward the 3792 resistance target remains on the table, potentially setting the stage for another bullish leg.
You may find more details in the chart.
Trade wisely best of Luck.
Ps. Support with like and comments for better analysis Thanks for Support.

THE KOG REPORT THE KOG REPORT:
In last week’s KOG Report we said we would be looking for price to support at the beginning of the week, hopefully in to the red box, and then push upside into the higher red box. This move worked well for the long trade, however, it was at that region we ideally wanted to short back down into the lower liquidity pools. We didn’t get this move due to the red box breaking above, so we continued with the bias and the target levels and managed to complete some fantastic long trades, as well as an extremely decent short hitting Excalibur on the nose.
Not a bad week, even though the plan wasn’t as successful as tends to be.
So, what can we expect in the week ahead?
We had bullish Friday after the break out, but the last few hours you can see some profit taking in process. We’re now still above our bias level 3740-45 but the issue we have here is there is still no breach of the red box defence above, which again held strong late session on Friday. We’re also flagging which is another concern, so, for that reason, we’ll say, resistance above is the 3767-75 region, which if targeted and held during the early session can take us back into the order region 3750-40 which is where a potential opportunity may come to attempt the long trade upside to target that all time high again.
Please note, the 3795-3810 needs a strong daily close above it to go higher, so we won’t be looking to get trapped high in a potential move that can turn again! That for us is the level to watch if price attempts that level.
We have a lot of news this week including NFP, with tomorrow looking like it could be a ranging day playing those order regions.
It's the last few days of the month, so we'll have to play level to level intra-day and wait for the monthly close for a clearer picture. Right now, levels are level, boxes are boxes, we'll stick with the plan and move with the market where ever it goes.
RED BOX TARGETS:
Break above 3765 for 3773, 3777, 3785, 3796 and 3802 in extension of the move
Break below 3750 for 3744, 3740, 3732 and 3720 in extension of the move
Please do support us by hitting the like button, leaving a comment, and giving us a follow. We’ve been doing this for a long time now providing traders with in-depth free analysis on Gold, so your likes and comments are very much appreciated.
As always, trade safe.
KOG

Gold Continues to Probe for New Highs.👋Hello everyone, what do you think about the trend of OANDA:XAUUSD ?
Gold continued its upward momentum on Tuesday, reaching a new record high near 3800 USD. Persistent geopolitical tensions, the Federal Reserve's dovish stance, and signs of weakness in major economies in Europe and the U.S. seem to be sustaining investor interest in the precious metal.
At the time of writing, gold is hovering around 3765 USD, undergoing a slight pullback, but the overall trend still supports further gains. From a technical perspective, I believe that after this correction, we could see higher price movements. The immediate target is to reclaim the 3790 USD level, followed by 3800 USD, and if conditions remain favorable, we could push even higher, as long as no deep corrections occur.
💬What do you think about gold? Feel free to share your views in the comments, I'm looking forward to your feedback!
Good luck!

XAU/USD: When Common Sense Beats Hype1. Market Recap
Gold’s rally looks unstoppable. Fundamentals are clearly supportive and technically, the chart screams bullish .
But here comes the trader’s problem: just saying “Gold is bullish” doesn’t make a trade. Everyone knows that already. What matters is not the direction, but the structure of the trade itself.
2. The Educational Point – The 3 Pillars of Every Trade
No matter what market you trade, a professional trader always defines three things before taking a position:
1. Entry Point – where you get in.
2. Exit Point (Target) – where you aim to take profit.
3. Negation Point (Stop-Loss) – where you admit you’re wrong and cut the trade.
Without all three, you don’t have a trade — you just repeating what everyone knows.
3. The Current Problem With Gold
• If you buy at market (3816), your nearest stop is today’s low (3758). That’s ~600 pips risk, and with a 1:2 ratio, you need 3950 just to make sense of it. Not impossible, but not elegant either.
• If you wait for a dip to support at 3785, risk improves to ~300 pips. But this setup is already a 450 pip fail from the ATH — and failures at highs are not to be ignored and not very bullish either.
• Selling at market? Again tricky, because spikes in bullish trends can wipe out shorts before the market even breathes.
In short: at current levels, both long and short lack a clear, controlled setup.
4. My Trading Approach
Here’s where I apply common sense:
• Gold is already +1.5% since Friday’s close.
• If it extends to 3850, that’s where I’ll look to fade the move.
• Even if it’s not a major correction, an intraday drop is realistic. From 3850, a 500 pip move back to 3800 is enough to structure a 1:2 trade.
• If stop-loss gets hit, so be it — that’s trading.
5. Conclusion
At current price (3816), I don’t see a clean entry and I don’t have a favorite scenario. However, if Gold pushes into 3850, the most probable outcome in my view is at least a short-term correction.
This should be a trader’s mindset: not chasing every move, but waiting until risk, reward, and probability align. 🚀

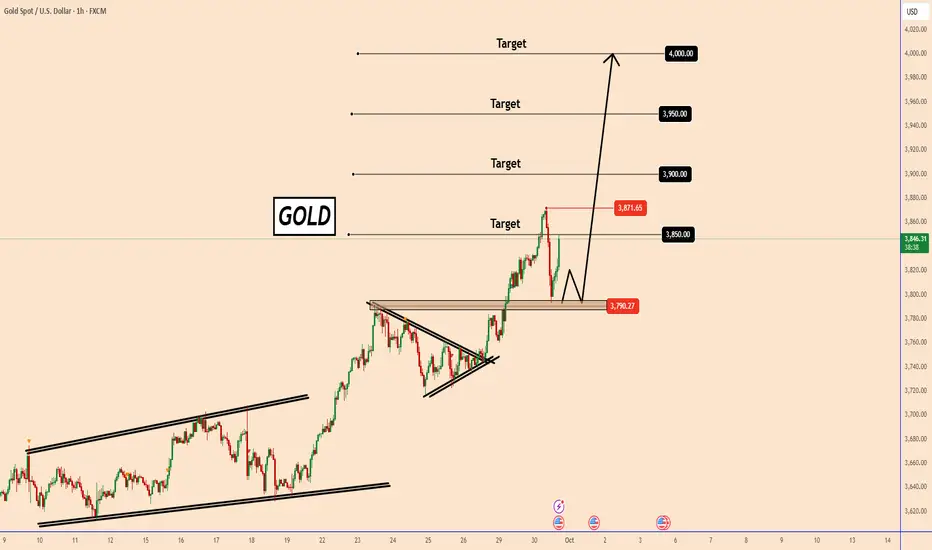
GOLD: Back from 3795 with target 4000GOLD: Back from 3795 with target 4000
After gold reached 3871.6 earlier today, we saw a strong sell-off that occurred as a profit-taking moment, pushing the price down to 3795.
Currently, buyers are still strong and as long as the price stays above 3795, I don't see any hope for a down move yet. Gold remains in a clear and strong uptrend.
It seems like everyone is trading only gold. It seems like all the market volume is invested only in gold :)
As we can see, the US reported good JOLT data 7.22M vs. 7.2M, but again the US dollar is weak.
The targets are still valid as in the last analysis I posted.
Main targets: 3850; 3900; 3950 and 4000
You may find more details in the chart!
Thank you and Good Luck!
❤️PS: Please support with a like or comment if you find this analysis useful for your trading day❤️
XAUUSD Long: Bullish Momentum to ContinueHello, traders! The price auction for XAUUSD has been in a strong bullish phase, confirmed by the establishment of a well-defined ascending channel. This uptrend was initiated after a breakout from lower levels and has shown significant strength by pushing through multiple prior resistance areas, including the 3470 DEMAND 2 and 3675 DEMAND levels, turning them into new support.
Currently, the price action is continuing its ascent within the upper portion of this ascending channel, indicating that the bullish initiative remains firmly in control. The market is in a clear expansion phase, with very little sign of significant selling pressure, suggesting that any pullbacks are likely to be minor and short-lived.
My scenario for the development of events is a direct continuation of the current bullish momentum. I believe that the price will only make a shallow correction from the current levels before the next impulsive wave higher begins. In my opinion, the underlying trend is strong enough to carry the price to a new high within the channel. The take-profit is therefore set at 3835 points, targeting the upper resistance line of the channel. Manage your risk.

GOLD DAILY CHART ROUTE MAP UPDATEDaily Chart Update
3776 Target Achieved!!
A beautifully strong finish to the week, with our 1H and 4H chart ideas playing out, and now the daily chart projection completing perfectly.
Last week, we highlighted the importance of a candle body close above 3683, which opened the gap toward 3776. That target has now been hit with precision today – an awesome way to close the sequence.
With 3776 now achieved, the key focus shifts to the daily close:
A sustained close above this level would open the higher range above, confirming continued bullish strength.
A rejection here, however, would put support levels back into play at 3683 and the channel top.
Current Outlook
🔹 3683 Target Reached
Our breakout sequence played out with precision, starting from the EMA5 lock above 3564 and extending to complete the 3683 objective.
🔹 3776 Target Completed
Today’s price action delivered the full upside completion into 3776. Now, the daily close will decide whether the breakout extends further into new ranges.
🔹 Key Inflection – 3776
Close above = breakout range expansion.
Rejection = retest of 3683 and channel top support.
Updated Key Levels
📉 Support – 3683 & Channel Top
📉 Deeper Support – 3564 & 3433
📉 Pivotal Floor – 3272
📈 Resistance / Next Upside Objective – Sustained break above 3776 opens the range higher
🔥 What’s Next?
We’ll be back on Sunday with a fresh Daily chart idea, updated targets, and a full multi-timeframe analysis to guide the next leg of the journey. Stay tuned – momentum is only heating up from here!
Thank you for the continued support, and congratulations to everyone who rode this move with us.
Mr Gold
GoldViewFX

XAU/USD: Gold Pauses Ahead of Inflation ReportHello everyone, let’s take a look at gold (XAU/USD) price action during the 25th of September session!
Following a surprise drop in US jobless claims, gold has stalled around $3,740 per ounce while investors await the PCE inflation report – a key release that could shape the Fed’s next move on interest rates.
From a technical perspective, gold is currently facing important resistance at $3,750, an area where multiple Fair Value Gaps (FVGs) have appeared. If the price fails to break higher, a pullback towards $3,720 is likely – a level also marked by several FVGs that could provide solid support. As long as gold remains above this zone, the broader uptrend remains intact. Signals from the Ichimoku Cloud further confirm the strength of the bullish structure.
On the news front, stronger-than-expected US labour data has lowered expectations of early Fed easing, shifting the market’s focus to the PCE release. A higher reading could strengthen the USD and put pressure on gold, while a weaker outcome would bolster the case for an October rate cut, potentially giving gold new momentum.
In the short term, gold is likely to retest the $3,720 support area. If this level holds, the price may rebound towards $3,750 and even $3,800. In a more negative scenario, a break below $3,720 could see gold retreat to $3,700 before buyers return.
What do you think – will this PCE report be strong enough to push gold above $3,750?

XAUUSD: FVG Filled, DXY Weak — Does Gold Have Room to Rise?Hello everyone,
At the start of the new week, gold jumped to around 3,780 and extended gains as the USD Index (DXY) slipped to ~98 (-0.15%). A mild risk-on sentiment, along with ongoing expectations for Fed rate cuts, supported buying interest, although short-term profit-taking after the recent rally remains a risk.
On the H1 chart, price structure continues to hold higher lows, while the upward FVG around 3,792–3,805 has been filled before testing resistance at 3,818–3,822. The Ichimoku cloud offers support at 3,760–3,768, with deeper backing at 3,745–3,750 (recent swing low plus Kumo edge). Notably, rising volume on recent bullish candles suggests continued buying pressure.
From a news perspective, this week’s US calendar is packed: ADP, Jobless Claims, ISM/PMI, and Non-Farm Payrolls. Should these figures reinforce cooling USD/yields, gold may have further upside potential. Conversely, a hawkish surprise from the Fed or stronger-than-expected labour data could trigger a technical pullback toward the Kumo region.
The base case favours a mild pullback to 3,800–3,792 (new FVG) or 3,785–3,780 to “recharge” before retesting 3,818–3,822. A breakout and sustained hold above 3,822 would target 3,835–3,842 and possibly 3,855. If rejected at 3,818–3,822 and USD strengthens unexpectedly, supports at 3,768–3,760 and 3,745–3,750 will serve as key demand zones.

GOLD WEEKLY CHART MID/LONG TERM ROUTE MAP UPDATEWeekly Chart Update – Follow Up
3732 Hit & Closed Above, 3806 Gap Opens – Now Completed
Previously we highlighted 3732 as the breakout target after confirming strength above 3659. That level was successfully achieved, and now we’ve gone a step further: 3806 has officially been HIT, completing this weekly chart idea.
This also means all of our multi-timeframe chart ideas have now completed, a full sequence cycle from setup to fulfilment.
Interim Outlook
We’ll share some interim analysis tomorrow to guide through the remainder of this week. On Sunday, a brand-new multi-timeframe analysis will be prepared and shared, laying the foundation for the weeks and months ahead.
In the meantime, if we see any corrections back into the existing chart idea range, the outlined levels remain valid for structure and range management.
Current Outlook
🔹 3806 Range Gap Completed
The final upside expansion objective has now been fulfilled, completing the cycle.
🔹 Correctional Supports – 3659 & 3576
Any detachment below raises correctional risk. 3659 and 3576 (Goldturn) remain critical support zones, with the channel top confluence offering a potential bounce zone.
Updated Levels to Watch
📉 Supports – 3659 & 3576 (correctional zones), deeper floor at 3482
📈 Resistance – 3806 (completed), awaiting new upside mapping in upcoming analysis
Plan
The bullish structure has completed its full range cycle into 3806. From here, corrections into support zones would be healthy resets, while we prepare to track fresh setups in the next multi-timeframe framework.
Flexibility with structure and levels remains key as we transition into the next phase.
Mr Gold
GoldViewFX

Gold – Straight Up, Straight Question1. Yesterday’s Move Recap
Like everyone else these days, I’m trying to make some sense of Gold’s move. Let’s be honest: even if you were extremely bullish, you wouldn’t have expected this kind of vertical line in the past 6 weeks or so.
The market is clearly overextended, and while momentum is impressive, technical traders know what usually follows such parabolic moves.
2. Key Question
Is Gold about to enter a much-needed correction, or can this euphoric rally defy gravity for longer?
3. Technical Observations
• Since the 2700 ATH zone in September, Gold has been carving out a repeating rhythm:
o Monday: explosive new ATH push
o Tuesday: spikes and volatility
o End of the week: corrective drop
• The last strong move (Friday the 19th → Wednesday the 23rd) measured around 1600 pips.
• If we project a similar extension from last Friday’s start, the measured move points toward 3885–3890 — right at the top of the newly formed channel.
This zone is not a certainty but an interesting confluence of measured move symmetry and technical channel resistance.
4. Why I Expect a Correction
• Gold has recently shown a tendency to correct after Wednesday.
• We are already in stretched territory with limited room for new buyers at these levels.
• Corrections are not only natural but necessary for healthy continuation.
5. Trading Plan
For me, the only trade that makes sense here is shorting spikes into resistance — anticipating a strong correction. I’m currently flat, but if we see exhaustion signs near 3885–3890, I’ll consider positioning short. The same strategy worked well last time,so...
6. Closing Thought
Patterns don’t always repeat perfectly, but they rhyme. If Gold follows its recent script, a midweek top followed by correction wouldn’t surprise me at all. 🚀

XAUUSD 2025: Recalibrate Your Thinking or You Won’t SurviveThesis: If you don’t recalibrate your volatility expectations for Gold, you won’t survive this market. What felt like a “big move” in 2021 is just noise in 2025.
________________________________________
1) Context: What Actually Happened (2020 → 2025)
• 2020–2023: Gold largely oscillated in a broad range around the $1,700–$2,000 handles (with occasional spikes beyond). Many traders anchored their risk and target expectations to this regime.
• March–April 2024: A decisive breakout to fresh all-time highs shifted the regime from compression to expansion.
• Late August 2025: Price broke out of a symmetrical triangle around the ~3330 zone and then advanced near-vertically into late September, ushering in a burst of exceptional volatility.
Bottom line: The market transitioned from a four-year consolidation into a powerful expansion phase. Your playbook must evolve accordingly.
________________________________________
2) Volatility Math: Same %, Bigger Dollars → Bigger “Pips”
Many retail platforms quote XAUUSD so that 1 pip ≈ $0.10. Using that convention:
• In the $1,900–$2,000 environment, a 2% move ≈ $38–$40 → 380–400 pips.
• At $3,300–$3,800, the same 2% ≈ $66–$76 → 660–760 pips.
So those “300–400 pip moves” you treated as significant in 2021 or2022 are structurally too small for 2025.
In expansion phases, 1,000+ pip swings are perfectly normal.
Key takeaway: If price doubles, absolute fluctuations for the same percentage move roughly double too. Stop using yesterday’s pip yardstick.
________________________________________
3) Why Recalibration Matters
The market is not static. Traders who survive across cycles are those who adapt to new volatility regimes. Anchoring to outdated benchmarks—whether in pips, percentage moves, or psychological comfort zones—leads to poor decisions.
It is not enough to have a strategy. You need the right frame of reference for volatility, risk, and expectations.
A system built for a $1,800 gold market cannot simply be copied and pasted into a $3,500 gold market without adjustment.
________________________________________
4) The Psychological Shift
Recalibration is not only technical but also mental:
• Old anchors: What once felt like a big move is now an intraday fluctuation.
• Risk perception: A number that once signaled danger may now be just routine volatility.
• Flexibility: The willingness to redefine “normal” is the mark of a trader who lasts.
This is not abstract theory. For example, I started writing this article when Gold was trading at 3860. By the time I reached this paragraph, price had already dropped to 3815, after making a low at 3810—an almost 700-pip drop from today’s all-time high in just three hours.
By the time you read this, it may be trading at a completely different level. That’s the reality of expansion volatility.
And here’s the perspective shift: these days, being happy about booking 100 pips on Gold is like being happy for 10 pips on EURUSD. It’s not that 100 pips don’t matter—it’s that the scale of the game has changed, and your mindset must change with it.
________________________________________
5) Moving Forward
Your survival depends on continuous mental updates. Understand that volatility is relative to price, that regimes change, and that clinging to old measures is a recipe for losses. General principles—risk discipline, patience, and adaptability—remain constant, but their practical application shifts with the environment.
Recalibrate, or the market will do it for you.

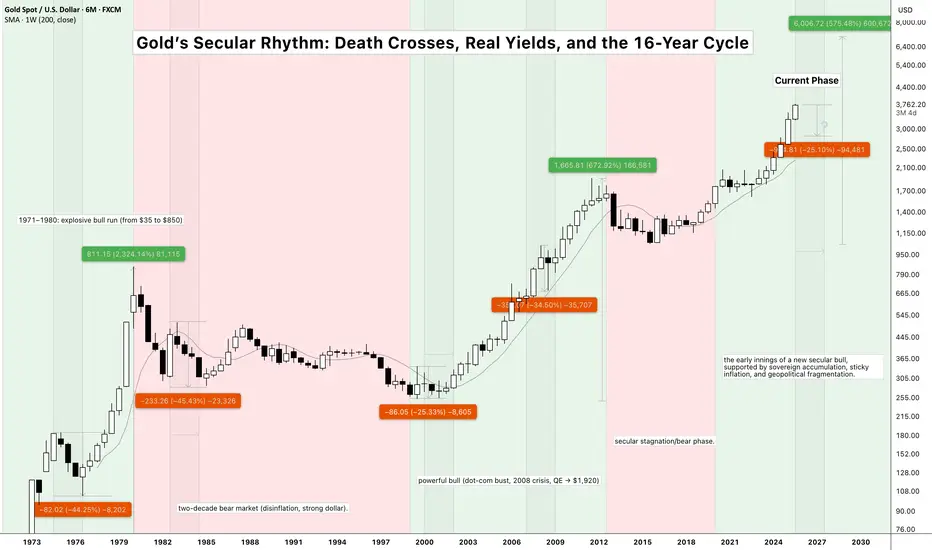
Gold’s Hidden Trigger: Why the Death Cross Matters CAPITALCOM:GOLD Hidden Trigger: Why Death Crosses Still Matter in a Secular Bull
Historically, when U.S. interest rates ECONOMICS:USINTR cross below the unemployment rate ECONOMICS:USUR - a kind of macro “death cross” - gold has often suffered sharp corrections even within a secular bull. We saw this in 1974–76, 1980–82, and 2008, where liquidity stress forced gold lower before the long‑term uptrend resumed. It’s a reminder that even in a secular bull, secondary corrections can be brutal when macro conditions tighten.
The difference today is the sovereign bid. Since 2022, central banks have been buying over 1,000 tonnes annually, creating a structural floor that didn’t exist in past cycles. Any weakness is likely to be bought aggressively, producing a V‑shaped recovery rather than a drawn‑out bear market.
Meanwhile, the 10‑Year Real Interest Rate is hovering around 1.5–1.7%, still artificially high. History shows that when real yields inevitably turn negative (likely by 2026), gold tends to explode higher regardless of crisis timing.
Layer this onto the 16‑year secular cycle thesis and the central bank accumulation story, and the setup is compelling: gold may still face sharp but temporary corrections, yet the long‑term trajectory remains firmly higher. The key question is whether sovereign demand can fully absorb potential Western ETF liquidation during the next bout of financial stress.
Disclaimer: This analysis is for educational purposes only and should not be considered financial advice. Past performance does not guarantee future results. Always conduct your own research and consult with financial professionals before making investment decisions.
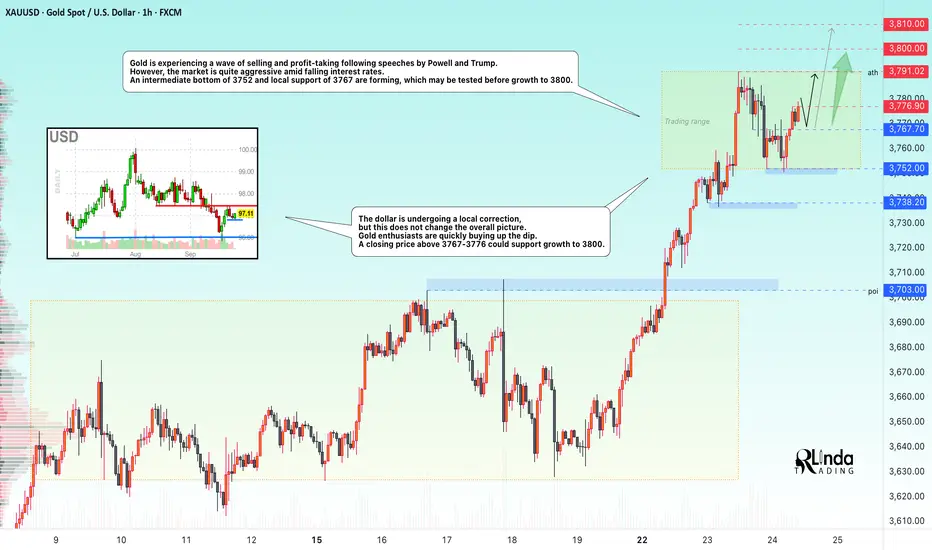
GOLD → Intermediate bottom. Consolidation before growth FX:XAUUSD is being sold off and declining amid profit-taking following speeches by Powell and Trump. However, the market is quite aggressive amid falling interest rates. After forming an interim bottom, the market quickly bought back the decline.
Gold is correcting after record growth, awaiting new signals from Fed representatives and PCE inflation data on Friday. The price remains close to historic highs, but the upward momentum has temporarily slowed, with consolidation forming at 3752-3791.
Key factors : Powell gave no clear hints about future rate cuts, noting the risks of rising inflation and a weakening labor market. The probability of a rate cut in October has risen to 92%, but the Fed's sentiment index is fluctuating somewhat...
The risk of a US government shutdown on October 1 and mixed PMI data are holding back the USD's strengthening.
Technically, gold remains in a bullish trend, but consolidation is possible in the short term. PCE data will be the deciding factor — weak figures will support the metal, while strong figures will trigger a correction.
Resistance levels: 3776.9, 3791, 3800
Support levels: 3767, 3752, 3738
The price is consolidating. Before reaching 3791-3800, there may be a retest of local support. Similarly, a retest of the ATH may also trigger a small pullback of 1/2 of the impulse before a breakout and growth to the specified targets.
Best regards, R. Linda!
GOLD Breakout Done , Short Setup Valid To Get 200 Pips !Here is My 30 Mins Gold Chart , and here is my opinion , we finally Below 3750.00 With 4H Candle ! and we have a 4H Candle closure below it And Perfect Breakout and this give us a very good confirmation , so we have a good confirmation now to can sell after the price go back to retest the broken area 3750.00 , and we can targeting 100 to 200 pips . if we have a daily closure above this area this mean this idea will not be valid anymore .
Reasons To Enter :
1- Perfect Touch For The Area .
2- Clear Bearish Price Action .
3- Bigger T.F Giving Good Bearish P.A .
4- Over Bought .
5- Perfect 30 Mins Closure .

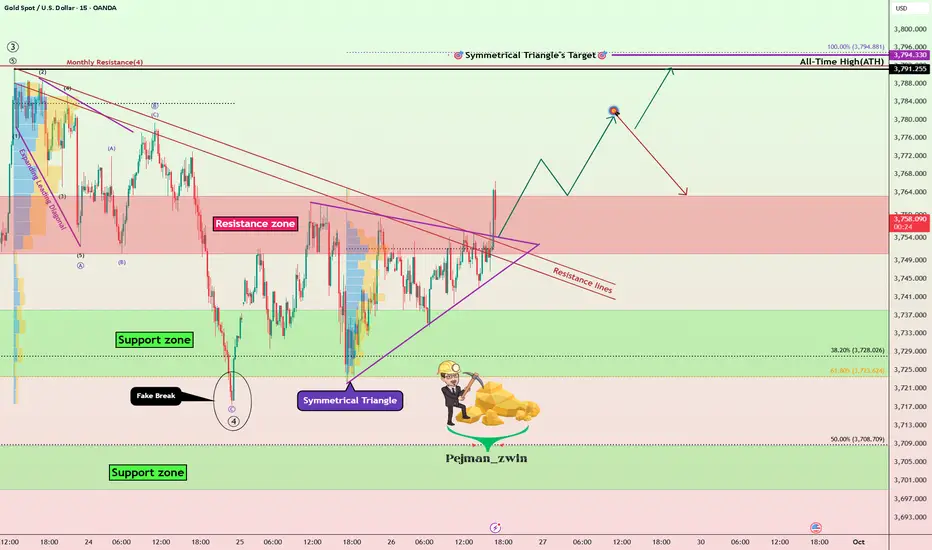
Gold Roadmap: Breakout Confirmed –New ATH or Another Correction?Gold ( OANDA:XAUUSD ) as I expected in the previous idea (Short and Long positions hit the target).
First of all, I should say that this analysis is for the short term and on a 15-minute time frame.
Gold seems to have managed to break the Resistance lines, Resistance zone($3,763-$3,750), and the upper line of the symmetrical triangle in the past few minutes.
I expect Gold to rise to at least $3,779, and then there are two scenarios for Gold: creating a new All-Time High, OR re-correcting.
Stop Loss(SL): $3,741.7
Please respect each other's ideas and express them politely if you agree or disagree.
Gold Analyze (XAUUSD), 15-minute time frame.
Be sure to follow the updated ideas.
Do not forget to put a Stop loss for your positions (For every position you want to open).
Please follow your strategy; this is just my idea, and I will gladly see your ideas in this post.
Please do not forget the ✅ ' like ' ✅ button 🙏😊 & Share it with your friends; thanks, and Trade safe.
GOLD WEEKLY CHART MID/LONG TERM ROUTE MAPWeekly Chart Update – Follow Up
3732 Hit & Closed Above, 3806 Gap Opens
Previously we saw 3659 tested again with a weekly candle body close above the level, officially opening and completing 3732 last week.
Now, we’re closing above 3732, which leaves a long-range gap open at 3806 for the week ahead. This sets the stage for continued bullish progression but with correction risks still in play.
We must also keep in mind the possibility of a detachment correction back to 3659. Should momentum pick up during any such pullback, the channel top could align with the 3576 Goldturn to provide an additional zone of support and a potential springboard for continuation higher.
Current Outlook
🔹 3659 Retest & Close Above
Weekly close above 3659 confirmed strength and cleared the path higher.
🔹 3732 Objective Achieved
Target reached precisely after last week’s breakout, validating the continuation sequence.
🔹 3806 Range Gap Active
With a close above 3732, focus now shifts toward 3806 as the next upside range expansion.
🔹 Correctional Supports – 3659 & 3576
Detachment below highlights correctional risk. Both 3659 and 3576 (Goldturn) provide critical support zones, with the channel top acting as a confluence level for potential bounce.
Updated Levels to Watch
📉 Supports – 3659 & 3576 (correctional zones), deeper floor at 3482
📈 Resistance / Next Upside Objective – 3806
Plan
The bullish structure remains intact with upside potential toward 3806. A healthy correction into support zones (3659 / 3576) would help reset momentum while preserving the overall trend.
As always, staying flexible with structure and levels will be key heading into the week ahead.
Mr Gold
GoldViewFX

Gold Prepares for a New Breakout👋Hello everyone, what do you think about the trend of OANDA:XAUUSD ?
XAUUSD has been consolidating in a narrow range, forming a bullish flag pattern with clear support at 3,730. Additionally, the Bollinger Bands are showing that the market is preparing for a potential breakout.
If the price continues to hold above the support line, the bullish trend may continue, with the immediate target at the resistance level around 3,785. The Core PCE Price Index m/m, set to be released today, will serve as a short-term catalyst for this trend.
Keep an eye on these key levels to confirm the breakout!
And you, what do you think about gold's price today💬? Feel free to share your thoughts in the comments below!
Good luck!

Hellena | GOLD (4H): LONG to support area of 3800.Dear colleagues, the last forecast is canceled, but I recommended that trades should be set trades to breakeven because there is a high probability of wave “3” extension.
It looks like the upward impulse is still not over and I expect the final formation of wave “5” to the 3800 area. Yes - this target is quite close, but now it makes no sense to make a long forecast with a correction in wave “2” of higher order (red).
As soon as I get confirmation that the correction in wave “2” has started - I will make a forecast with more points.
Manage your capital correctly and competently! Only enter trades based on reliable patterns!

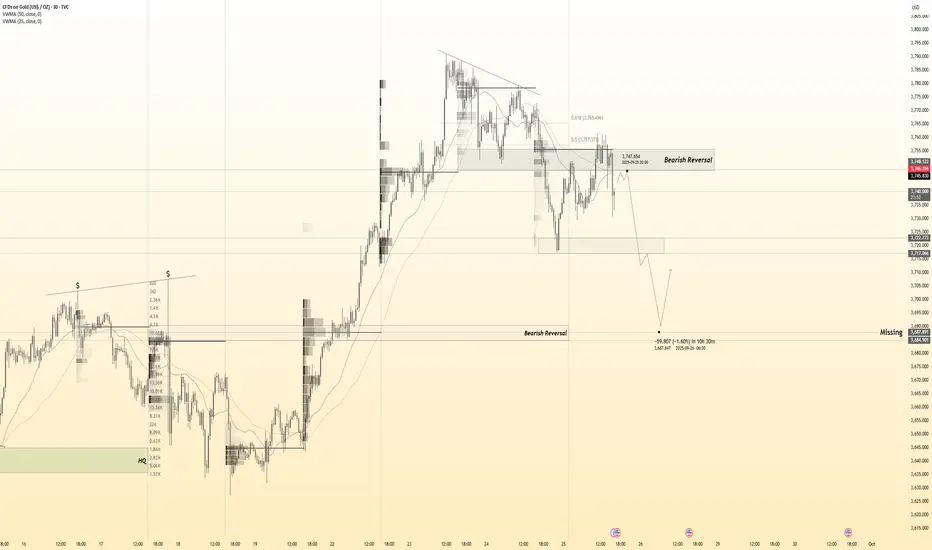
Gold 30Min Engaged ( Bearish Reversal Entry Detected )Time Frame: 30-Minute Warfare
Entry Protocol: Only after volume-verified breakout
🩸Bearish Reversal : 3746
➗ Hanzo Protocol: Volume-Tiered Entry Authority
➕ Zone Activated: Dynamic market pressure detected.
The level isn’t just price — it’s a memory of where they moved size.
Volume is rising beneath the surface — not noise, but preparation.
🔥 Tactical Note:
We wait for the energy signature — when volume betrays intention.
The trap gets set. The weak follow. We execute.
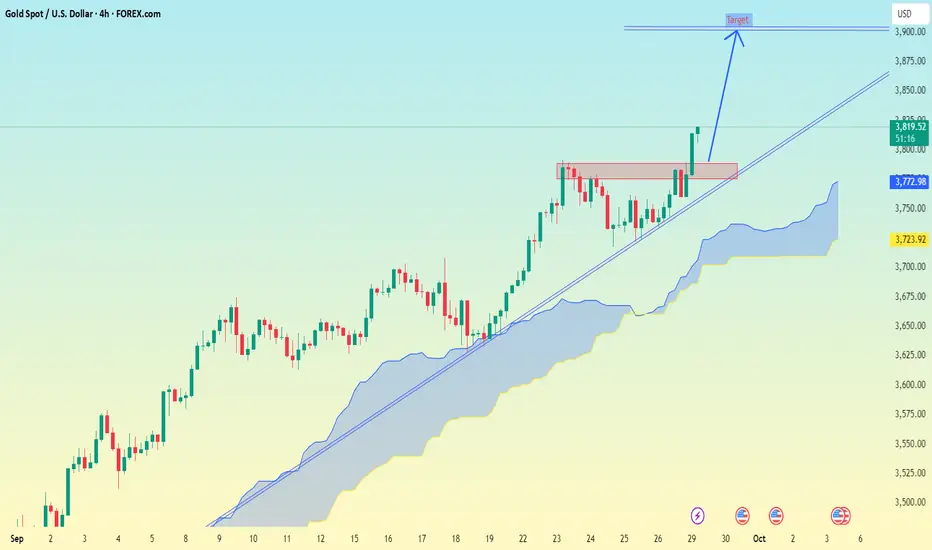
XAUUSD (Gold) 4H chart Pattern..XAUUSD (Gold) 4H chart.
From the chart setup my marked:
Price is currently around 3819.
A breakout from the consolidation zone (highlighted box) has occurred.
Trendline support is intact and Ichimoku cloud is bullish.
My chart shows a projected move towards the next resistance zone.
📌 Target Zone:
Near-term target: 3865 – 3880
Extended target: 3900 – 3920 if momentum continues and price holds above 3800.
🔑 Support levels to watch:
3773 (trendline + Ichimoku support)
3733 (major support if trendline breaks)
⚠ If price drops below 3770, bullish momentum weakens.
Gold Pauses Ahead of Inflation Data – Will 3,720 Hold?Hello everyone, let’s take a quick look back at the performance of gold during the past week.
Looking back at the performance of gold in the past week (22/09 – 28/09), gold (XAU/USD) saw quite a bit of volatility, opening around 3,774 USD and closing at 3,759 USD, marking a slight decrease of 14.51 USD (-0.38%). Despite closing in the red, gold still showed positive signals by reaching a weekly high of 3,783 USD. Notably, on 26/09, gold made a strong breakout due to US inflation data that temporarily weakened the USD, but selling pressure returned towards the end of the week as the Fed remained firm with its high-interest rate policy, causing a cooling off in gold prices.
As we move into the new week, the outlook for gold remains quite optimistic if the critical support level at 3,720 USD holds. This is seen as a key foundation for a potential recovery, with nearby resistance levels at 3,780 USD and 3,800 USD. In the positive scenario, gold could rise from 3,720 USD to 3,800 USD, representing a potential move of approximately 80 pips. On the other hand, if selling pressure increases and the price breaks through 3,720 USD, the next support level will be 3,700 USD, with a risk of a decline by 20-30 pips.
What do you think, will gold hold above 3,720 USD in the new week? Let us know your thoughts!
