bullish gold is trading in uncharted territoryBullish gold is trading in uncharted territory. Due to positive economic news from US last week, dollar started strenthening so XAUSD started correcting from its Life time high.
GOLDCFD trade ideas

XAUUSD 1 HR
- *Entry*: $3,750
- *Target*: Potential target at TP1 ($3,780.59) as per chart markings.
- *Considerations*:
- Recent upward movement.
- *Note*: Trading involves risk. Always consider market conditions and use proper risk management.


GOLD Massive Short! SELL!
My dear subscribers,
GOLD looks like it will make a good move, and here are the details:
The market is trading on 3754.4 pivot level.
Bias - Bearish
My Stop Loss - 3761.8
Technical Indicators: Both Super Trend & Pivot HL indicate a highly probable Bearish continuation.
Target - 3741.3
About Used Indicators:
The average true range (ATR) plays an important role in 'Supertrend' as the indicator uses ATR to calculate its value. The ATR indicator signals the degree of price volatility.
Disclosure: I am part of Trade Nation's Influencer program and receive a monthly fee for using their TradingView charts in my analysis.
———————————
WISH YOU ALL LUCK

Gold (XAU/USD) – ORH Rejection Signals Potential Drop Toward PDOGold on the 15-min chart is showing a strong rejection from the ORH zone near resistance, supported by Dizzy HOLO indicator signals. Price action suggests a possible move lower toward PPF (3744) and PDOL (3739) levels if the bearish momentum holds.
⚡ Key Highlights:
Rejection from supply zone marked by ORH.
Breakout trap above resistance followed by reversal candles.
Next downside targets: PPF 3744 → PDOL 3739.
Bias remains bearish unless price breaks above ORH zone with volume.

Gold Ready To Drop in 15 Minutes TFGold Ready To Drop in 15 Minutes TF after yesteray's positive GDP outcome. US has gone to fetch the dollar mark


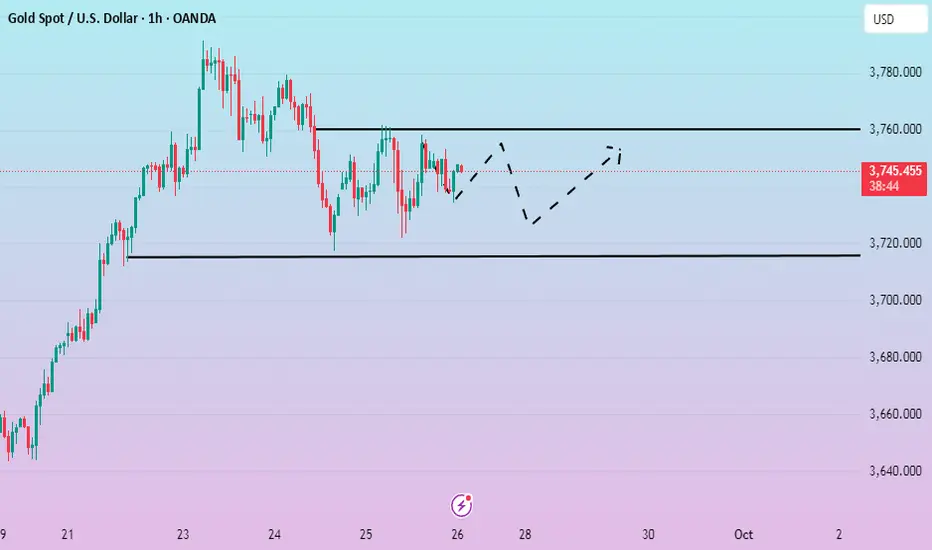
XAUUSD - MARKET CONTEXT I SEP/26/2025- Gold is still consolidating inside a triangle pattern with two trendlines: H1 downtrend (dynamic resistance) and H1 uptrend (dynamic support).
- Current price is 3746, right at the POC + Reject Zone, showing a balance between supply and demand.
Key technical levels:
VaH Zone: 3751–3753
POC Zone: 3740
VaL Zone: 3731
Deep Demand Zone: 3717–3720
🟢 SCENARIO 1 – BUY AT SUPPORT (PREFERRED WITH UPTREND HOLDING)
Entry conditions:
Price holds above H1 uptrend line.
Rejection candles (Pinbar, Engulfing) appear at 3731–3740 (POC + VaL zone).
Rationale:
Confluence of POC + VaL → strong liquidity.
H1 structure still forming Higher Lows → favoring trend-following buys.
🎯 Entry: 3731–3740
🛑 SL: Below 3720
✅ TP1: 3751 (VaH Zone)
✅ TP2: 3775 (Old High)
🔴 SCENARIO 2 – SHORT-TERM SELL FROM RESISTANCE
Entry conditions:
Price retests 3751–3755 (VaH Zone) but fails to break out.
Strong rejection signal forms.
Rationale:
VaH zone + dynamic resistance confluence.
If buying momentum weakens, this level could trap breakout buyers.
🎯 Entry: 3751–3755
🛑 SL: Above 3762
✅ TP1: 3740 (POC)
✅ TP2: 3731 (VaL Zone)
⚠️ SCENARIO 3 – WAIT FOR BREAKOUT CONFIRMATION
BUY breakout: If price clears 3775 with strong volume → new bullish leg opens, target 3790–3800.
SELL breakdown: If price breaks 3731 → potential retest of Demand Zone 3717 → 3700.
📌 RISK MANAGEMENT STRATEGY
Main priority: BUY at support 3731–3740 in line with the uptrend.
Only consider short-term SELL if clear rejection appears at 3751–3755.
If market stays in tight range, stay out and wait for confirmation.

LiamTrading – Gold might fake a move before dropping
Gold is trading around the 375x zone and may exhibit a “fake breakout” to higher levels before adjusting downward. The price structure on the H4 chart shows:
Strong resistance is located at the 3770–3773 zone, coinciding with the 0.786 – 1.0 Fibonacci extension area. This is a confluence zone where a bearish reaction is likely.
The main trendline remains upward, but the RSI is gradually weakening, warning that buying pressure is not as strong.
Short-term support lies at 3710–3713, also the 0.5 – 0.618 fibo zone, suitable for buy scalping orders.
Larger support is at 3688–3691, where it converges with the trendline bottom and key Fibonacci levels, considered a sustainable “buy zone.”
Trading plan reference
Sell: 3770 – 3773, SL 3778, TP 3756 – 3743 – 3725 – 3710
Buy scalping: 3710 – 3713, SL 3705, TP 3725 – 3736 – 3748 – 3760
Buy zone: 3688 – 3691, SL 3684, TP 3699 – 3710 – 3725 – 3736 – 3745 – 3760
In summary, gold may create a fake upward move to the 3770–3773 resistance zone before reversing for a correction. Traders should patiently wait for confirmation signals at key price zones to optimize entries and manage risks tightly.
This is my personal view on XAUUSD. If you find it useful, follow for the fastest updates on upcoming scenarios, continuously updated in the community.

XAUUSD – Wolfe Waves continues on H4XAUUSD – Wolfe Waves continues on H4, price returns below the trendline: prioritising the correction scenario
Hello Trader,
Based on the Wolfe Waves structure on the H4 frame and current price behaviour, gold has returned to trading below the trendline, indicating a weakening of short-term upward momentum and making way for a downward correction before the market decides the next trend. The upper area has created a clear “sell zone”; below, two defensive buying zones appear for both scalping and medium-term.
Main Technical Picture
Wolfe Waves: wave 5 completes near resistance, then price falls back below the trendline — aligning with the correction scenario along Wolfe's target line 1–4.
Trendline & price box area: the close below the rising trendline shows “acceptance” below; immediate resistance lies in the 375x–376x cluster (sell zone).
Momentum: MACD H4 slows down, histogram narrows → high probability of a pullback – retest before a new decision.
Detailed Trading Scenarios
1) Sell according to the correction trend (priority)
Entry: 3756 – 3759
SL: 3764
TP: 3745 → 3732 → 3715 → 3690 → 3672
Reason: the 375x area coincides with the sell zone + upper trendline; selling at retest offers a good R:R ratio.
Confirmation/Invalidation: if H4 closes above 3764 and holds, the short-term selling scenario weakens.
2) Buy scalping in the buffer zone
Entry: 3701 – 3703
SL: 3695
TP: 3715 → 3732 → 3745 → 3766
Note: only a rebound in the correction phase; close each level and move SL according to TP1.
3) Buy medium-term (strong base area)
Entry: 3648 – 3651
SL: 3644
TP: 3672 → 3698 → 3708 → 3722 – 3727
Reason: the 365x area coincides with the demand/accumulation volume on H4; suitable for catching a deep rebound along with the larger trend.
Management: this is a medium-term order, so divide the volume, close each step, and move SL to breakeven after TP1.
Refer to my scenario if you find it reasonable, trade accordingly, and if you enjoy trading gold with high-quality scenarios, follow me

Waiting for the data to be released. Continue to fluctuate?Gold is experiencing a volatile downward trend. On the 4-hour chart, prices are currently under pressure at $3,765. The short-term rebound has completed its technical pattern repair, suggesting further downward movement. The 1-hour chart shows prices trading near short-term support, while the short-term moving average has flattened downward, indicating weakening short-term momentum. Focus on the resistance area around 3,750-3,755 in the short term, while support remains around 3,715.
Gold is currently experiencing small fluctuations. Quaid recommends maintaining trading within the 3,755-3,715 range pending the release of the PCE data.
New analysis and trading strategies will be provided after the data is released.
XAUUSD – Downtrend Continues to be FavoredDowntrend Continues to be Favored (Wolfe Waves Pattern H4)
Hello Trader,
Gold is following the Wolfe Waves structure on the H4 chart, after bouncing off the upper resistance zone and returning below the trendline. This indicates that the short-term upward momentum has weakened, and the scenario of a downward adjustment continues to be prioritized at this stage.
Technical Analysis
Wolfe Waves are clearly formed, wave 5 has hit resistance and a reversal signal has appeared.
The price failed to hold above the upper trendline, while the MACD shows weakening upward momentum.
The 3746 – 3748 zone is considered the main “sell zone” in the short term.
Nearby support zones: 3709 – 3711 and deeper at 3675 – 3678. Further out, the area around 3650 is an important “buy zone” in the medium term.
Trading Scenarios
1. Sell with the trend (priority)
Entry: 3746 – 3748
SL: 3754
TP: 3733 → 3720 → 3702 → 3690
2. Buy Short-term Scalping
Entry: 3709 – 3711
SL: 3705
TP: 3722 → 3730 → 3745
3. Buy Deep Support Scalping
Entry: 3675 – 3678
SL: 3670
TP: 3688 → 3696 → 3710 → 3725
4. Medium-term Buy Zone
Entry: around 3650
This is a large volume accumulation zone, coinciding with strong support on H4. This area is suitable for considering medium-term buy orders if the price adjusts deeply.
Conclusion
In the short term, the bearish scenario continues to be favored, especially when the price stays below the 3748 zone.
Buy strategies should only be considered in the form of scalping or at the important buy zone around 3650.
The current gold market is still in a distribution phase, so patience is needed to observe candle confirmations at entry zones to optimize the R:R ratio.
This is today's XAUUSD trading scenario according to Wolfe Waves on H4. You can refer to it and combine it with your personal strategy for the best risk management.
Follow me to receive the latest scenarios when the price structure changes.

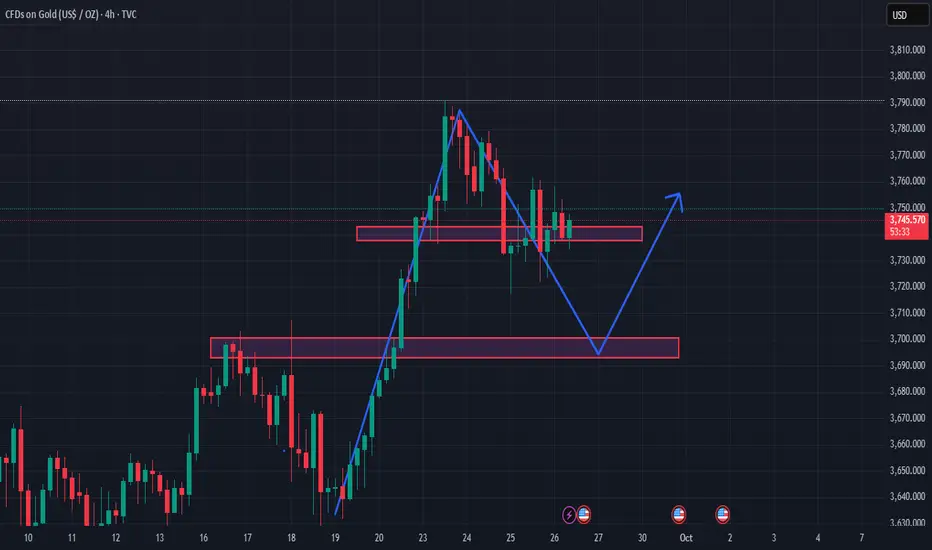
Price is currently ranging within the narrow 3,740 – 3,755 suppo1. Current Price Structure
Gold has formed a strong bullish wave (rallying from the 3,680 zone to nearly 3,790).
Afterwards, a sharp decline occurred → creating a new high but quickly rejected.
At present, the price is consolidating sideways within a narrow support–resistance zone around 3,740 – 3,755.
2. Key Support – Resistance Levels
Near-term resistance: 3,755 – 3,760 (recent minor high).
Near-term support: 3,735 – 3,740 (area repeatedly tested).
Stronger support: 3,695 – 3,705 (potential retracement target with liquidity and previous accumulation zone).
3. Price Scenarios
Scenario 1 (primary): Price breaks below the current support → drops to retest the 3,695 – 3,705 zone → then bounces back up. This is a potential “demand zone” where buyers may return.
Scenario 2 (less likely): Price holds the 3,740 support and rallies immediately → however, current buying pressure seems insufficient to sustain this move.
4. Trading Implications
The 3,695 – 3,705 zone is a potential buy area if bullish reversal candlestick patterns appear.
If price clearly breaks below 3,695, the short-term trend could turn bearish with a target toward 3,660.
In the short term, the market is still in a corrective phase after the previous bullish rally → not ideal to “chase buys” around 3,740.
👉 In summary: The chart suggests the price is more likely to dip toward the 3,700 demand zone before bouncing back up. The 3,740 zone is only a temporary buffer, not strong enough for a major reversal.
Gold Price Educational Note – Friday, September 26, 2025Hello everyone,
Before I publish today’s full analysis, I wanted to draw your attention to the current chart setup. If you look closely, you’ll notice a tightening triangle formation marked by the two red trendlines. Typically, when price breaks out of such a formation, it often results in either a sharp rally or a sharp drop.
Sell setup: Below 3733
Buy setup: Above 3753
Targets: As outlined in yesterday’s update (Thursday).
⚠️ Please note: trading inside the triangle is highly risky and should be avoided. This insight comes from practical market experience, not from textbooks or trading courses.
Since it’s Friday — often referred to as a global volatility day — extra caution is advised. But with the right discipline, it can also turn into a profitable day.
🔹 Note : If you find this analysis helpful, I appreciate your support in sharing it with friends.
Wishing you all a successful and cautious Friday trading session.
Disclaimer:
This post reflects only my personal opinion and observations of the market. It is not financial advice or a buy/sell recommendation. Trading in financial markets involves high risk, and all decisions are solely the responsibility of the trader.

Gold Outlook: Bulls Struggle, Bears Eye 3700 - 3680 SupportDear friends,
Now you know why I like trading gold — it respects the technical levels with precision. Since yesterday, price action has consistently honored the resistance line I drew earlier.
However, unless the bulls gain enough momentum to break above this steel-like resistance, which has held firm since Tuesday, the risk of a downside move remains high. We could be looking at a drop toward 3700 and potentially 3680, if not today, then likely tomorrow.
The U.S. session will provide more clarity on whether gold breaks higher or confirms the bearish scenario.
Wishing you all successful trades.
#GoldRider #XAUUSD
Disclaimer:
This analysis reflects my personal market view and observations. It does not constitute financial advice or a buy/sell recommendation. Trading in financial markets carries a high level of risk, and all decisions remain the sole responsibility of the trader.

XAUUSD Analysis: Precarious Levels, Here's My Trade Plan📊 Looking at Gold (XAUUSD) on the 4-hour timeframe, price is sitting at a precarious level. Recently, we’ve seen a bearish break of structure, but some bullish momentum is beginning to show 📈.
🔎 That said, there’s still no confirmation of a bullish market structure break just yet. I’ll be watching two possible scenarios:
1️⃣ If price breaks the current high, then retests and fails, this could set up a potential long entry 🚀.
2️⃣ If price instead breaks the current low, then retests and fails, that would signal a possible short opportunity 📉.
⚠️ Disclaimer: This analysis is for educational purposes only and not financial advice. Always trade responsibly and manage your risk carefully.

XAUUSD – The SELL trend has been confirmed
Technical Analysis
After a strong rise hitting the resistance zone of 3770–3780, gold (XAUUSD) couldn't maintain momentum and started forming consecutive declines. This signals that selling pressure is dominating in the short term.
The 3767–3769 zone coincides with local resistance, a place where the market has reacted multiple times → confirming its role as a distribution zone.
Fibonacci Retracement levels from the latest upward wave show the 0.618 zone around 3700–3705 acts as short-term support, where technical rebound reactions may occur.
The 3673–3675 zone confluences with Fib 2.618 and EMA200 → strong support, considered the main Buy zone for long-term buyers.
RSI (14) is currently below 50, momentum leans towards decline, confirming the adjustment trend is prevailing.
Trading Scenario
SELL Scenario (trend-following priority):
Entry: 3767–3769
SL: 3775
TP: 3755 – 3740 – 3733 – 3710 – 3694
Buy scalping scenario (short-term support reaction):
Entry: 3701–3704
SL: 3698
TP: 3710 – 3722 – 3736
Buy zone scenario (priority for medium-term rebound):
Entry: 3673–3675
SL: 3666
TP: 3688 – 3696 – 3705 – 3720 – 3736
Price zones to watch
3767–3769: important resistance, priority Sell zone.
3700–3705: short-term support, potential Buy scalping area.
3673–3675: main Buy zone, confluence of support + Fibonacci.
3694 and 3736: important intermediate levels, where partial profit-taking is recommended.
The main short-term trend is leaning towards SELL, however, important support zones may provide opportunities for counter-trend Buys or trend-following Buys after price adjustments.
This is a reference scenario based on resistance – support and Fibonacci. Follow me if you love trading gold and want to read the latest analyses in the community.

Sept 25, 2025 - XAUUSD GOLD Analysis and Potential Opportunity📊 Analysis:
Last night, price dropped to a low of 3717.5 before quickly rebounding to 3752. Currently, bullish momentum is weakening while bearish pressure is starting to show.
If price holds above 3752, bulls still have room to extend higher → buy pullbacks into support.
If price breaks below 3736.5, a short-term downside channel may open.
🔍 Key Levels to Watch:
• 3772 – Resistance
• 3765 – Resistance
• 3759 – Resistance
• 3750–3752 – Key resistance zone
• 3745 – Resistance
• 3736.5 – Support
• 3728 – Support
• 3717.5 – Yesterday’s low
• 3708–3712 – Support zone
• 3700 – Psychological level
📈 Intraday Strategy:
SELL: If price breaks below 3736.5 → target 3732, with further downside toward 3728, 3723, 3718
BUY: If price holds above 3745 → target 3750, with further upside toward 3752, 3759, 3765
👉 If you find this helpful or traded using this plan, a like 👍 would mean a lot and keep me motivated. Thanks for the support!
⚠️ Disclaimer: This is my personal view, not financial advice. Always use proper risk control.

GOLD has all-round support, Fed, geopoliticsOn September 23, the OANDA:XAUUSD market experienced a “roller coaster”: initially soaring to a record $3,791/ounce in the European session, then cooling significantly when the US Federal Reserve Chairman Jerome Powell spoke. However, gold still closed higher than at the beginning of the day, showing that the big uptrend has not been shaken.
As of the time of writing, gold has adjusted down slightly to $3,754/oz, equivalent to a decrease of 0.25% and about $10 on the day.
What keeps gold “shining”?
• Fed monetary policy: Powell stressed that the Fed must balance high inflation with a weakening job market. The Fed cut interest rates last week and the FedWatch tool shows a nearly 90% chance of further cuts in October. Lower interest rates make gold more attractive than bonds or savings.
• Fed view: While Powell has been cautious, other officials such as Bowman have warned that the Fed may be “slowing down” and need to cut interest rates faster if the economy worsens. This further reinforces expectations that gold will benefit.
• Hot geopolitics: NATO accused Russia of repeatedly violating the airspace of member countries, while Russia-Ukraine tensions were further complicated by the latest statement from former President Donald Trump. After meeting with President Zelensky, Trump unexpectedly strongly supported the possibility of Ukraine regaining all of its territory. This escalation of tensions has caused a sharp increase in safe-haven demand for gold.
• Market demand: Commerzbank pointed out that in addition to interest rates, factors such as ETF capital flows, doubts about the independence of the Fed and global political risks are simultaneously pushing up gold prices.
Fundamental Outlook:
Investors are focusing on the Personal Consumption Expenditures (PCE) index, the Fed’s preferred inflation measure, due later this week. If inflation continues to run hot, the Fed may be more cautious, but the pressure of US public debt and international instability remains a “golden support” for the price of this precious metal.
Since the beginning of the year, gold prices have increased by nearly 40%, the strongest pace since the late 1970s. With low interest rates, political risks and increased demand for shelter, the general trend still favors gold to maintain its “halo”.
Technical outlook analysis of OANDA:XAUUSD
• Main trend:
Gold price is still in the uptrend channel, each correction to the lower edge bounces up → buyers are in control.
• MA line:
Price is firmly above the EMA21 line, and the EMA21 is still pointing up → confirming the uptrend. The EMA plays a quite effective dynamic support role.
• Important support:
o Nearby: 3,720 – 3,738 USD (Fibo 0.236 zone + lower channel edge).
o Stronger support: around 3,628 USD (Fibo 0 bottom).
• Resistance – target above:
o Nearby: 3,779 – 3,791 USD (Fibo 0.382 + previous candle high).
o Next target: 3,825 USD (Fibo 0.5) → 3,872 USD (Fibo 0.618). If the breakout is successful, the possibility of advancing to the 3,939 USD zone is still open.
• RSI & momentum:
RSI is high, but has not yet fallen into extreme overbought. Momentum shows that there is still momentum, but there may be a pause (small pullback) before continuing to increase.
• Candlestick structure:
Recent candles have small bodies, narrow fluctuations → signs of market accumulation around the top. If the breakout is accompanied by liquidity, the possibility of further increase is very high.
The current gold trend is still inclined to increase. As long as the price stays above the support zone of 3,720 - 3,738 USD, the prospect of conquering the 3,779 - 3,825 - 3,872 USD marks is completely feasible.
SELL XAUUSD PRICE 3826 - 3824⚡️
↠↠ Stop Loss 3830
→Take Profit 1 3818
↨
→Take Profit 2 3812
BUY XAUUSD PRICE 3728 - 3730⚡️
↠↠ Stop Loss 3724
→Take Profit 1 3736
↨
→Take Profit 2 3742

Analysis of gold price intraday trend!Market News:
Spot gold prices fell in early Asian trading on Thursday (October 2nd), having hit a record high of $3,895 during the previous session. This was boosted by a weakening dollar and safe-haven demand triggered by the US government shutdown. Weak employment data also reinforced market expectations for a Federal Reserve rate cut this month. The US government shutdown has been a key driver of this week's rise in London gold prices. S&P Global Ratings emphasized that this uncertainty directly impacts the Fed's monetary policy outlook and may even amplify the risk of a recession. Amidst the uncertain global economic outlook, gold is experiencing a strong bull market. Investors who seize the opportunity could reap rich returns. However, caution should be taken against the risk of profit-taking by bulls; rational investment is the key to long-term success. Yesterday's rebound in international gold prices suggests a weakening of short-term upward momentum. Investors should be wary of a further correction triggered by profit-taking.
Technical Analysis:
The US government has entered a shutdown, and the small non-farm payrolls data unexpectedly set a new record with a negative employment figure. Gold hit a new all-time high yesterday, breaking through 3880 and reaching 3895, setting a new all-time high. It surged higher in late trading before retreating to 3855. The daily chart is experiencing significant pressure at and above 3890. The RSI indicator is overbought above the 80-day mark, so be wary of a profit-taking correction in gold prices towards the end of the week. The short-term four-hour and hourly moving averages are converging at high levels, the Bollinger Bands are showing signs of converging, and the RSI indicator is retracing to its mid-axis. A wide range of fluctuations is expected during the day. The daily chart is gradually rising above a single moving average. As long as the support level of the single moving average is not broken, there is no possibility of a turnaround from strength to weakness. The lower support levels are at 3810 and 3750, respectively, on the 5-day and 10-day moving averages. Therefore, the strong will always be strong. Don't be afraid of buying into the rally, but be wary of a pullback and a breakout! The market needs to recover from the decline, but buying with strength is self-evident, and the rise is unassailable. Therefore, we should maintain a bullish buying trend today. Focus on the 4-hour 10-day moving average support at 3833 and wait for intraday corrections to this support level to buy!
Trading Strategy:
Short-term gold buy at 3830-3833, stop loss at 3822, target at 3870-3890;
Short-term gold sell at 3892-3895, stop loss at 3904, target at 3850-3830;
Key Points:
First Support Level: 3842, Second Support Level: 3833, Third Support Level: 3820
First Resistance Level: 3870, Second Resistance Level: 3882, Third Resistance Level: 3898

XAU/USD 1H Trade Plan | 1OCT
Market Structure: BOS confirmed after breaking previous high. ✅
Bias: Bullish continuation 📈
POI: Price tapped into demand zone and is showing accumulation signs.
LQC Context: Liquidity grabbed below intraday lows before reacting upwards.
🔹 Expecting price to consolidate in the demand, then push higher toward 3,900+.
🔹 Entry: From demand zone retest (mitigation).
🔹 TP: 3,901 (supply imbalance fill).
🔹 SL: Below demand base (3,853).

3930 is still pending Our previous commantary sucessfully TP HIT As we took buy from 3855-3867 Both TP HITS at 3890
What will I do on NY SESSION?
I'm buying gold on every DIP
✅️ My First buying will be start from 3870 area - if the market drops for retest on H4 BOS I will took buy trade with very strict Stoploss.
✅️Secondly my buying area will be 3835-3845 zone where we have structurel support and liquidity meets the bottom trendine.
-My target will be 3930 In extension !!
Additional TIP: Buy the dips

XAU/USD Intraday Plan | Support & Resistance to WatchGold is recovering from yesterday’s sharp pullback and is currently trending just above the $3,861 level. A sustained break above this area could see price push toward the $3,883 resistance, with a possible extension to $3,903.
Failure to hold above $3,883 could trigger another pullback into lower support zones.
📌 Key levels to watch:
Resistance:
$3,883
$3,903
$3,920
Support:
$3,861
$3,842
$3,828
$3,796
$3,753
$3,734
🔎 Fundamental Focus – Wed, Oct 1
Key US data on deck today:
🚩ADP Non-Farm Employment
🚩ISM Manufacturing PMI
🔶ISM Manufacturing Prices
👉 Expect high volatility and swings.
