GOLD continues to set records, market awaits Powell's speechIn the Asian trading session on the morning of September 23, the spot OANDA:XAUUSD price fluctuated around 3,745 USD/ounce, after just setting a new record. Previously, in the first session of the week (September 22), gold increased sharply by 62.23 USD (equivalent to 1.7%), closing at 3,746.63 USD/ounce and on this trading day, it jumped to 3,759.29 USD/ounce, the highest level in history.
OANDA:XAUUSD was supported by expectations that the US Federal Reserve would continue to cut interest rates. Low interest rates are generally beneficial for the precious metal because they do not yield. Despite being considered “overbought”, gold has yet to show any signs of technical weakness.
Last week, Fed Chairman Jerome Powell “poured cold water” on expectations of too-fast policy easing after the Fed cut interest rates. However, the move did not stop money from pouring into gold ETFs, with holdings rising the most in more than three years.
This week, global investors are focused on a series of speeches from Fed officials, especially Mr. Powell's public speech on Tuesday afternoon (US time). According to the schedule, he will attend the "Economic Outlook Lunch" event in Rhode Island on September 24, where he will dialogue with more than 500 business and civil leaders. This is considered an opportunity for the market to grasp more about the upcoming monetary policy direction from the Fed.
Technical analysis of OANDA:XAUUSD outlook
Main Trend
Gold is in a steep uptrend channel, showing strong momentum.
The most recent candles are all sticking to the channel line and above the MA line, showing that the uptrend is still maintained.
Support and Resistance zones
Important support: 3,707 USD and 3,673 USD/ounce (Two green lines on the chart). This is the zone where if the price corrects, it is likely to bounce back.
Nearest resistance: 3,779 USD (Fibonacci level 0.382). If broken, gold can head towards: 3,825 USD (Fib 0.5), 3,872 USD (Fib 0.618), further: 3,938 USD (Fib 0.786).
Technical indicators
RSI: is in the high zone (above 70, signaling “overbought”), but has not given a strong reversal signal → indicating that the market still has upward momentum.
MA: moving average is sloping up, price is much higher than MA → strengthening the uptrend.
Trend analysis
Gold may have some short-term corrections to “gain momentum” around the $3,707 – $3,673 range, but the medium-term trend remains bullish. If the price channel is maintained and the support zone is not breached, there is a high possibility that gold will conquer the $3,779 → $3,825 → $3,872 range in the near future.
SELL XAUUSD PRICE 3789 - 3787⚡️
↠↠ Stop Loss 3793
→Take Profit 1 3781
↨
→Take Profit 2 3775
BUY XAUUSD PRICE 3726 - 3728⚡️
↠↠ Stop Loss 3722
→Take Profit 1 3734
↨
→Take Profit 2 3740
GOLDCFD trade ideas

SMART MONEY CONCEPT (SMC)📊 Bullish SMC Trade Recap – GOLD
1. Resistance Break → Price cleanly broke the resistance zone, confirming bullish strength.
2. Fake Out & Liquidity Grab → Institutions swept liquidity above resistance, trapping early sellers.
3. Rejection Entry → The rejection gave the perfect confirmation for entry.
4. Explosive Move → Price launched directly toward the new target.
5. Target 3,785 Hit 🎯 → Institutions drove the market to fresh Higher Highs, just as projected.
6. Distribution Phase → After hitting target, price consolidates in distribution, showing smart exit points.
✅ Conclusion: Patience, confirmation, and structure once again proved the power of institutional trading. A clean, textbook example of SMC in action.
GOOD JOB TRADERS…… ;)

BTCUSD, ETHUSD & XAUUSD Daily Trade SetupsIn this update we review the recent price action in Bitcoin, Ether & Gold and identify the next high probability trading setups and price objectives to target. To review todays video analysis click below!

23/9/68 : XAUUSD ( US Session )Using it from US Session until 11.00AM , I'll new analysis and update at 12.00PM
Resistance
3815-3820
3805-3810
3795-3800
3790
Support
3778
3768-3783
3756-3762
3746-3751

Gold Price Today: XAUUSD Sets Stage for Continued Bullish ExpansGold (XAUUSD) Market Report – September 21, 2025
Gold remains positioned near 3,685, with recent price behavior showing a structured climb despite short bursts of volatility. The market is cycling through phases of expansion and retracement, where each corrective leg has been followed by renewed upward momentum. This rhythm signals that buyers are steadily maintaining control of the broader trend.
The current setup reflects a market that is rebalancing efficiently. Short-term pullbacks are being absorbed quickly, keeping pressure aligned toward the upside. The sequence of structural shifts on the chart points to a continuation of this momentum, suggesting that higher valuations are within reach if the present flow persists.
Overall, gold’s tone is constructive, characterized by resilience and sustained demand. The pattern unfolding indicates a market preparing for further expansion, with the potential for continuation into higher ranges in the sessions ahead.

Art of Technical Analysis: How Traders Decode MarketTrading the financial markets may seem mysterious at first glance. Prices move up and down within minutes, news headlines shake investor confidence, and charts look like random zig-zag patterns. But behind this chaos, there lies a structured language – the language of technical analysis (TA).
Technical analysis is the study of past price action and chart patterns to forecast future market behavior. Unlike fundamental analysis, which focuses on economic data, earnings, and macroeconomic events, technical analysis is about understanding the psychology of buyers and sellers as reflected in the price chart.
Why Technical Analysis Matters
Markets are driven by human behavior – fear, greed, uncertainty, and confidence. These emotions repeat themselves over time, creating recognizable patterns. Technical analysis doesn’t predict the future with 100% certainty, but it helps traders identify high-probability scenarios.
For example:
- If price consistently bounces from a certain level, traders call it support.
- If price struggles to move above a particular level, it becomes resistance.
- When these levels break, a new trend often begins.
By combining these concepts, traders can build strategies for intraday trading, swing trading, or even long-term investing.
The Core Principles of Technical Analysis
Before diving into charts, let’s outline the three golden principles that technical analysts believe in:
Market Discounts Everything
Every piece of information – economic data, news, investor sentiment – is already reflected in the price. The chart tells the whole story.
Price Moves in Trends
Markets are not random. They move in uptrends, downtrends, and sideways ranges. Identifying the trend is the first step in any analysis.
History Repeats Itself
Patterns like triangles, head and shoulders, flags, and channels have been repeating for decades because human behavior remains consistent.
Decoding the Chart: Support, Resistance & Trendlines
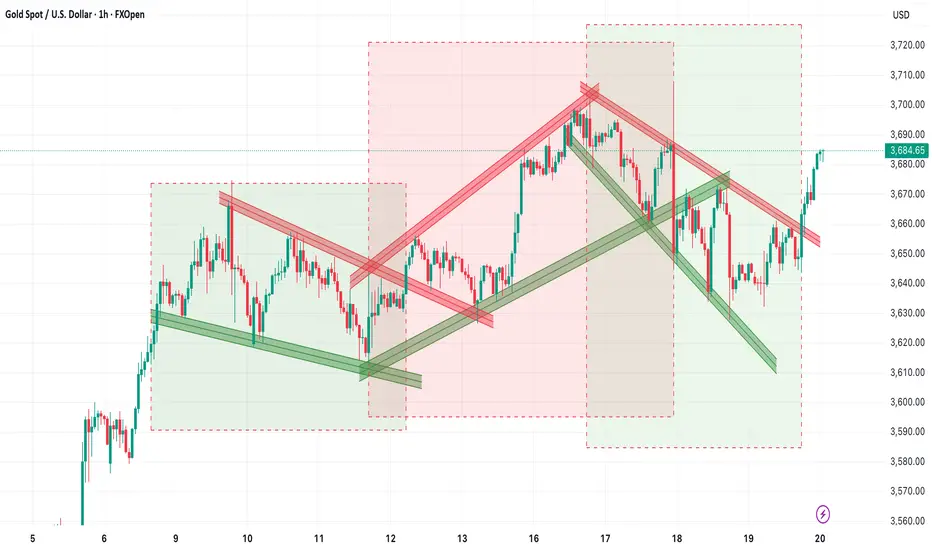
Take a look at the Gold (XAU/USD) chart. At first, it may look like price is simply bouncing around. But once we draw trendlines and mark levels, a clear story unfolds.
1. Support and Resistance
- Support is where demand is strong enough to prevent the price from falling further. On the chart, the green trendlines show these bounce points.
- Resistance is where supply prevents the price from rising higher. The red trendlines highlight these areas.
Example:
If Gold bounces multiple times from the $3,630 zone, traders call it support. If it fails to cross $3,700 several times, that becomes resistance.
Traders often:
- Buy near support (with stop-loss below).
- Sell near resistance (with stop-loss above).
2. Trendlines
- Trendlines are diagonal lines drawn across swing highs or swing lows. They act like dynamic support and resistance.
- An uptrend line connects higher lows, showing bullish momentum.
- A downtrend line connects lower highs, signaling bearish pressure.
In the Gold chart:
- The green rising lines show bullish phases.
- The red falling lines show bearish corrections.
- When price breaks a trendline, it often signals a shift in trend.
3. Wedge & Patterns
- A Wedge is formed when price moves between two trendlines – one acting as support, the other as resistance.
- Ascending Wedge = Bullish structure.
- Descending Wedge = Bearish structure.
- Symmetrical Triangle = Consolidation.
- Sideways Channel = Consolidation.
In the chart, Gold moved within wedge before breaking out. This tells traders when to trade the range and when to prepare for breakout momentum.
Chart Patterns That Repeat in Every Market
Beyond support and resistance, technical analysis studies chart patterns. These are the footprints of market psychology.
1. Continuation Patterns
Indicate that the current trend will likely continue.
- Flags and Pennants
- Ascending Triangles
- Rectangles
2. Reversal Patterns
Suggest that the trend is about to change.
- Head and Shoulders
- Double Tops / Bottoms
- Descending Triangles
3. Breakouts
- When price escapes from a channel, triangle, or range, it signals a big move ahead.
In the Gold chart, you can clearly see multiple breakout points where price surged after leaving a Wedge.
Risk Management: The True Game Changer
Even the best technical setup can fail. That’s why risk management is the backbone of trading success.
Rules every trader should follow:
- Never risk more than 1-2% of account balance on a single trade.
- Always place a stop-loss.
- Follow a risk-to-reward ratio (RRR) of at least 1:2+.
- Example: Risking $100 to potentially make $200.
Avoid overtrading; patience pays.
Pros and Cons of Technical Analysis
Advantages
✔ Works across all markets – stocks, forex, crypto, commodities.
✔ Useful for intraday, swing, and long-term trading.
✔ Focuses on price action, the most direct reflection of market psychology.
Limitations
✘ False signals occur during low volume.
✘ Over-analysis can cause “paralysis by analysis.”
✘ Works best when combined with fundamentals and risk management.
Final Thoughts: Technical Analysis as a Trader’s Compass
- Technical analysis is not about predicting the market with magic. It’s about understanding probabilities, spotting patterns, and managing risks.
- When you master support, resistance, trendlines, and candlestick psychology, charts stop looking like random chaos – and start telling you stories.
Remember:
- Price is the ultimate truth.
- Risk management protects your capital.
- Consistency builds profits over time.
Whether you trade Gold, stocks, or crypto, the principles remain the same. The more you practice, the sharper your eye becomes in spotting opportunities.
So the next time you look at a chart, don’t just see candles. See the psychology of thousands of traders battling it out – and use technical analysis as your compass to navigate the markets.
Thread>>Live Examples
23/9/68 : XAUUSD ( Europe / London Session )Using it from Europe Session until 7.00PM , I'll new analysis and update at 8.00PM
Resistance
3767-3772
3757-3762
3751
Support
3740
3729-3735
3719-3724

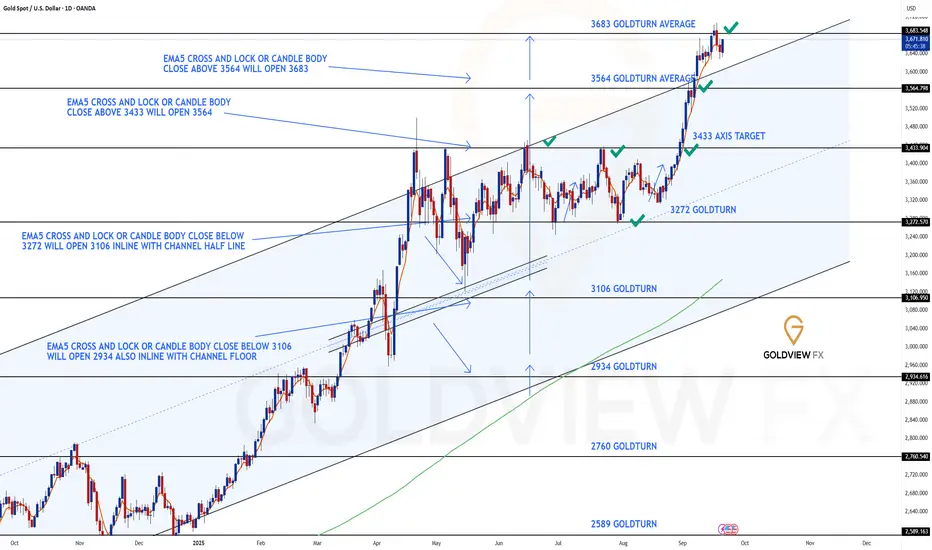
GOLD DAILY CHART ROUTE MAP UPDATE3683 Target Achieved – Chart Idea Complete 🚀💥
Booooom! 💥💥 Just as we laid out, the 3683 target was smashed this week – absolutely amazing finish! This move perfectly completed the chart idea we’ve been tracking, right in line with the analysis.
🔹 3564 ➡️ 3683
We first hit the 3564 target cleanly, then carried that momentum straight through to the big 3683 level. The EMA5 confirmations delivered flawlessly, giving us one of the sharpest, most technical finishes of the week.
This closes out the breakout sequence beautifully and proves once again how powerful structured analysis + patience can be.
🔥 What’s Next?
We’ll be back on Sunday with a fresh Daily chart idea, updated targets, and a full multi-timeframe analysis to guide the next leg of the journey. Stay tuned – momentum is only heating up from here!
Thank you for the continued support, and congratulations to everyone who rode this move with us.
Mr Gold
GoldViewFX
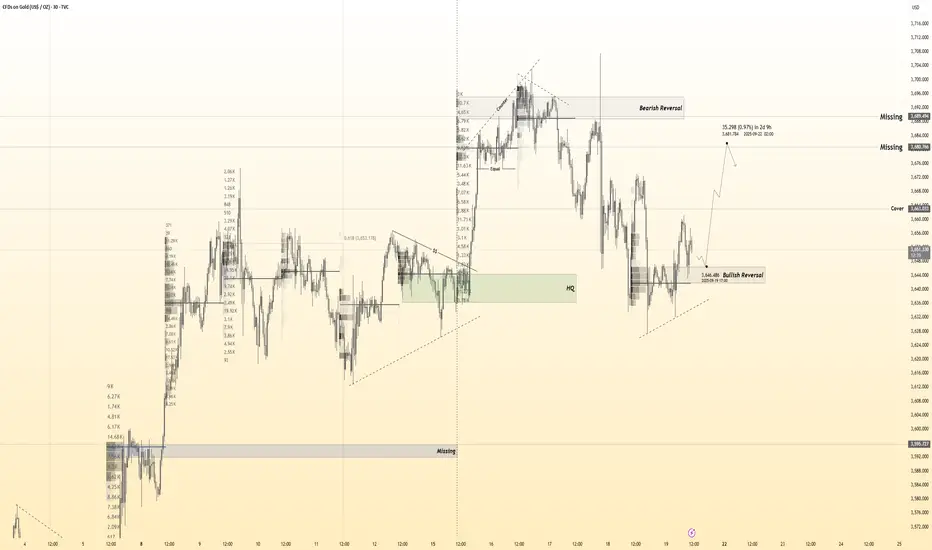
Gold 30Min Engaged ( Bullish Reversal Entry Detected )Time Frame: 30-Minute Warfare
Entry Protocol: Only after volume-verified breakout
🩸Bullish Reversal - 3693
➗ Hanzo Protocol: Volume-Tiered Entry Authority
➕ Zone Activated: Dynamic market pressure detected.
The level isn’t just price — it’s a memory of where they moved size.
Volume is rising beneath the surface — not noise, but preparation.
🔥 Tactical Note:
We wait for the energy signature — when volume betrays intention.
The trap gets set. The weak follow. We execute.
Gold is approaching it's $3800 targetGold is approaching it's $3800 target, as defined by the 8 hour candle chart annotated a month ago.
While gold is historically stretched from the 36 month moving average, all is good as long as the smaller time frames don't roll over for too long, cascading onto the higher ones.

Gold Bulls Eyeing $3,800+ – Key Buy Areas RevealedGold is currently holding inside a rising channel structure after making an ATH near $3,790. The market has pulled back from the high and is consolidating around key trendline support. The immediate buy area lies near $3,730–$3,740, which also aligns with the trendline support. A deeper dip towards $3,710–$3,715 could offer a stronger buy trigger zone if price retests.
On the upside, gold will likely revisit the $3,790 ATH, and a sustained move above this level may extend towards $3,800–$3,820 in the coming sessions. Overall, the market bias remains bullish as long as price holds above the $3,710–$3,692 support region, with consolidations and pullbacks seen as part of the broader upward trend.
🔑 Key Levels to Watch:
- Resistance: $3,760–$3,765
- Support: Immediate support $3,730 and strong support $3,710–$3,715
📌 Buy Zone & Buy Trigger:
- Buy Zone: $3,720–$3,730
- Buy Trigger: The buy trigger area is $3,760–$3,765, where a breakout above the descending resistance from the ATH would indicate renewed bullish momentum.
Note
Please risk management in trading is a Key so use your money accordingly. If you like the idea then please like and boost. Thank you and Good Luck!

Gold Alert: The Bull Reigns Above 3612!
---
🚨 Gold Alert: The Bull Reigns Above 3612! 🚨
Gold remains in a strong uptrend — and that momentum is intact as long as prices stay above 3612.
But beware: a break below 3612 flips the script. That’s not just a dip — it’s a golden opportunity to sell.
If that level cracks, we’ll be ready with a fresh analysis. Stay sharp. The next move could be decisive.
---

THE KOG REPORT - UpdateEnd of day update from us here at KOG:
What a week! Our path worked well from Monday-Wednesday which is when we published the FOMC Report, which also worked extremely well on the red box indicator and hot spots. Yesterday we wanted that low for a push up and as you can see now, the move is in progress.
It's too late in the session now to attempt anything other than a scalp, but ideally the entries long are from the red box level which was given yesterday. We now have resistance at the 3695 region with support 3664 which needs to hold. The race for the close is on!
Wishing you all a great weekend ahead and we'll see you on Sunday for the KOG Report and our view for the week.
Please take some time to hit the boost button on our ideas and we appreciate the following.
As always, trade safe.
KOG

Bullish continuation?The Gold (XAU/USD) is falling towards the pivot which aligns with the 38.2% Fibonacci retracement and could bounce to the 1st resistance.
Pivot: 3,563.40
1st Support: 3,501.76
1st Resistance: 3,706.97
Disclaimer:
The above opinions given constitute general market commentary, and do not constitute the opinion or advice of IC Markets or any form of personal or investment advice.
Any opinions, news, research, analyses, prices, other information, or links to third-party sites contained on this website are provided on an "as-is" basis, are intended only to be informative, is not an advice nor a recommendation, nor research, or a record of our trading prices, or an offer of, or solicitation for a transaction in any financial instrument and thus should not be treated as such. The information provided does not involve any specific investment objectives, financial situation and needs of any specific person who may receive it. Please be aware, that past performance is not a reliable indicator of future performance and/or results. Past Performance or Forward-looking scenarios based upon the reasonable beliefs of the third-party provider are not a guarantee of future performance. Actual results may differ materially from those anticipated in forward-looking or past performance statements. IC Markets makes no representation or warranty and assumes no liability as to the accuracy or completeness of the information provided, nor any loss arising from any investment based on a recommendation, forecast or any information supplied by any third-party.

Gold Price Reverses - Continues to Surge👋Hello everyone, what do you think about OANDA:XAUUSD ?
Although XAUUSD was impacted by the news of a drop in unemployment claims, the upward momentum continued to perform well on Friday. The price held strong above the $3,630 support zone and pushed the precious metal to new highs, rising by over 400 pips, or approximately 1.12%.
With the current price level, breaking through the immediate resistance could signal the start of the next rally, targeting the $3,700 level and potentially even higher. Previous pullbacks were necessary steps for reaching this target.
What do you think about the trend of XAUUSD? Feel free to share your thoughts in the comments!
Good luck!

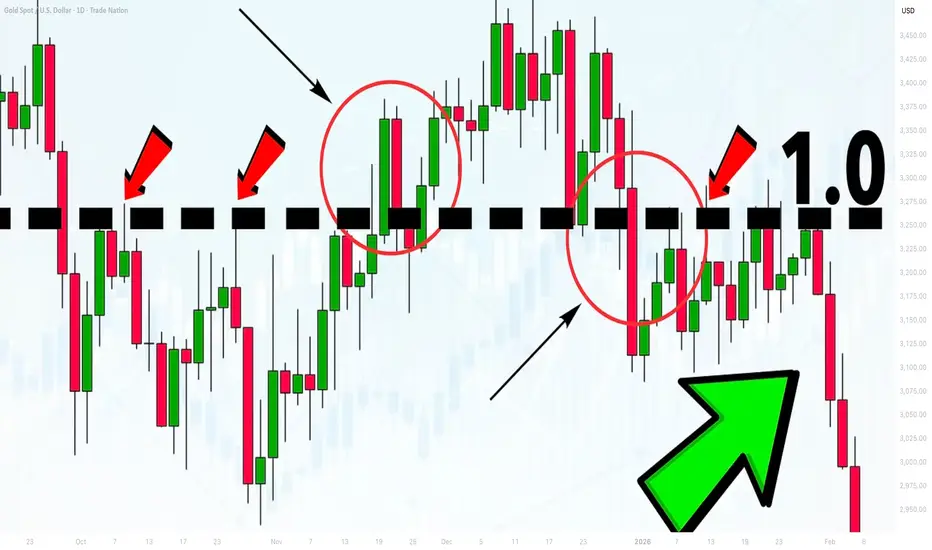
Learn the Significance of Psychological Levels and Round Numbers
When traders analyze the key levels, quite often then neglect the psychological levels in trading.
In this article, we will discuss what are the psychological levels and how to identify them.
What is Psychological Level?
Let's start with the definition.
Psychological level is a price level on a chart that has a strong significance for the market participants due to the round numbers.
By the round numbers, I imply the whole numbers that are multiples of 5, 10, 100, etc.
These levels act as strong supports and resistances and the points of interest of the market participants.
Take a look at 2 important psychological levels on EURGBP: 0.95 and 0.82. As the market approached these levels, we saw a strong reaction of the price to them.
Why Psychological Levels Work?
And here is why the psychological levels work:
Research in behavioral finance has shown that individuals exhibit a tendency to anchor their judgments and decisions to round numbers.
Such a decision-making can be attributed to the cognitive biases.
Quite typically, these levels act as reference points for the market participants for setting entry, exit points and placing stop-loss orders.
Bad Psychological Levels?
However, one should remember that not all price levels based on round numbers are significant.
When one is looking for an important psychological level, he should take into consideration the historical price action.
Here are the round number based levels that I identified on AUDUSD on a weekly time frame.
After all such levels are underlined, check the historical price action and make sure that the market reacted to that at least one time in the recent past.
With the circles, I highlighted the recent reaction to the underlined levels. Such ones we will keep on the chart, while others should be removed.
Here are the psychological levels and proved their significance with a recent historical price action.
From these levels, we will look for trading opportunities.
Market Reaction to Psychological Levels
Please, note that psychological levels may trigger various reactions of the market participants.
For instance, a price approaching a round number may trigger feelings of greed, leading to increased selling pressure as traders seek to lock in profits.
Alternatively, a breakout above/below a psychological level can trigger buying/selling activity as traders anticipate further price momentum.
For that reason, it is very important to monitor the price action around such levels and look for confirmations.
Learn to identify psychological levels. They are very powerful and for you, they can become a source of tremendous profits.
❤️Please, support my work with like, thank you!❤️
I am part of Trade Nation's Influencer program and receive a monthly fee for using their TradingView charts in my analysis.
GOLDGOLD if gives us a correction here and stay above 3600 then we have a potential for 3750 and above.
Disclosure: We are part of Trade Nation's Influencer program and receive a monthly fee for using their TradingView charts in our analysis.

Gold's Gann Square of 4 analysis. 21/Sept/25 XAUUSD monthly water RSI bills almost "boiling" at 88.96 "degree".. What do you think should it "cooling" down a bit?..

Wall Street Weekly Outlook - Week 39 2025Every week I release a Wall Street Weekly Outlook that highlights the key themes, market drivers, and risks that professional traders are watching.
This week promises to be particularly important, with several events likely to move markets. 📊 Stay ahead of the curve—watch the video now and get prepared like a Wall Street insider.
Any questions? Drop a comment or reach out directly.
-Meikel

Gold: still highly overboughtGold is headed for a fifth straight weekly gain, boosted by the Federal Reserve’s 25-basis-point rate cut, the first one during the course of this year. The Fed signalled that further easing is possible later in 2025, though it urged caution due to persistent inflation. Spot gold reached a fresh new all time highest level on Wednesday, by reaching the level of $3.705. For the rest of the week spot gold pulled a bit back, reaching the lowest weekly level at $3.630. Still, spot gold is closing the week at $3.685.
The RSI continues to move within a highly overbought market range, around the level of 80. As of the end of the week, the indicator modestly eased till the 73, which is still within the highly overbought territory. The RSI is indicating that the short term reversal is coming, however, when a strong demand holds on the market, the reversal or a correction will be postponed. This is exactly the case currently with the spot gold price. The MA50 is still diverging from MA200, in which sense, the potential cross is definitely not near.
The price of gold is currently moving within the uncharted territory, in which sense, there is a challenge to estimate its further moves. Indicators are suggesting that the short term correction is coming, but it cannot be exactly estimated at which moment this correction will occur. As per current charts, the $3.630 is evidently a supporting level, which could be tested in the coming week. A further move toward the upside is certainly possible, however, at this moment the potential level could not be estimated.

GOLD (XAUUSD): Bullish! Continue To Buy! In this Weekly Market Forecast, we will analyze the Gold (XAUUSD) for the week of Sept. 22 - 26th.
Gold is bullish on all HTFs. Selling is not an option. Wait for a pullback, and jump on the uptown train! Dips are your friend, so be patient and wait this market to take a breather.
Selling is only valid when there is a bearish break of structure. Until that happens, buy it, my friend.
Be wary of the pullback, as that move is likely to be corrected, but that would set up a great long opportunity!
Enjoy!
May profits be upon you.
Leave any questions or comments in the comment section.
I appreciate any feedback from my viewers!
Like and/or subscribe if you want more accurate analysis.
Thank you so much!
Disclaimer:
I do not provide personal investment advice and I am not a qualified licensed investment advisor.
All information found here, including any ideas, opinions, views, predictions, forecasts, commentaries, suggestions, expressed or implied herein, are for informational, entertainment or educational purposes only and should not be construed as personal investment advice. While the information provided is believed to be accurate, it may include errors or inaccuracies.
I will not and cannot be held liable for any actions you take as a result of anything you read here.
Conduct your own due diligence, or consult a licensed financial advisor or broker before making any and all investment decisions. Any investments, trades, speculations, or decisions made on the basis of any information found on this channel, expressed or implied herein, are committed at your own risk, financial or otherwise.

Buying every dip on GoldTechnical analysis: Gold is comfortably Trading not only above the broken Higher High’s trendline of the Hourly 4 chart’s healthy Ascending Channel that started after September #23 Bottom, also representing the #3,752.80 pivot Medium-term Support, Price-action is Trading above Triple Top’s rejection point. #3,778.80 - #3,785.80 Resistance zone is still showcasing strong durability (rejecting every upside attempt posing as each rejection local High’s). However if Resistance zone breaks / High Volatility zone is invalidated and zone break might open the way towards #3,800.80 benchmark / Resistance in form of an aggressive spike / extension similar to May #10 Low’s. It is crucial to mention that all this above (Bullish bias) is possible and will be sustainable only if DX extends current Bearish fashion and struggle to make a Bullish comeback since DX weakness is one of the reasons which is keeping Bullish bias alive. Sellers haven’t got any other option than to await their chance and adjust their model as with DX slightly recovering, Gold is not under heavy Selling pressure.
My position: I have Bought Gold on each dip and current orders I engaged are #3,752.80 benchmark re-Buy orders which I closed near #3,775.80 High's half an hour ago (kept them over-night). I continue with Buying every Low's on Gold.

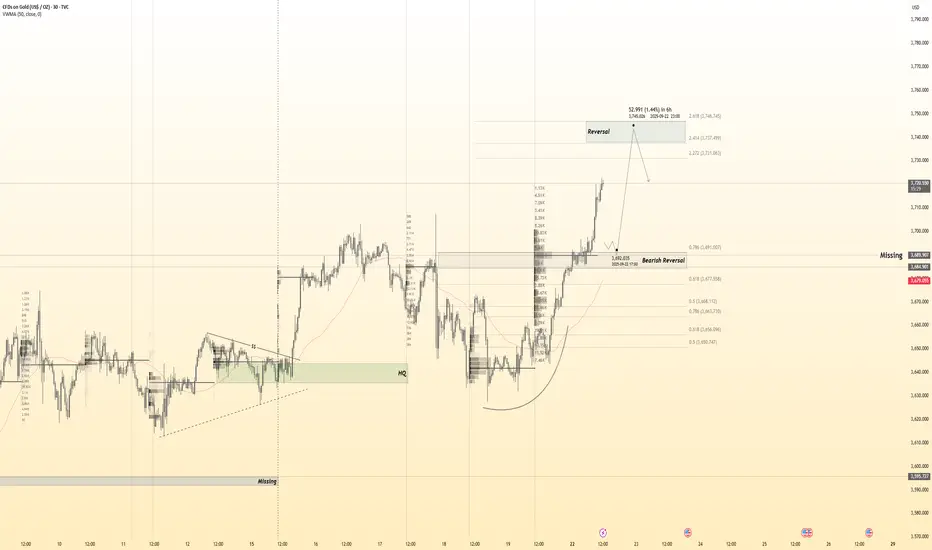
Gold 30Min Engaged ( Bullish Reversal Entry Detected )Time Frame: 30-Minute Warfare
Entry Protocol: Only after volume-verified breakout
🩸Bullish Movement from - 3647
➗ Hanzo Protocol: Volume-Tiered Entry Authority
➕ Zone Activated: Dynamic market pressure detected.
The level isn’t just price — it’s a memory of where they moved size.
Volume is rising beneath the surface — not noise, but preparation.
🔥 Tactical Note:
We wait for the energy signature — when volume betrays intention.
The trap gets set. The weak follow. We execute.