XAU/USD Bearish Setup: Channel Top OANDA:XAUUSD recently lost momentum after an extended rally, stalling at the upper boundary of the ascending channel around 3770–3780. This stall is significant because it aligns with multiple bearish confluences:
🔽 Bearish Confluences:
Channel resistance test: Price is rejecting the upper channel trendline, signaling exhaustion from buyers.
Fibonacci alignment: The current zone overlaps with key fib levels, increasing the probability of retracement.
Rejection wicks: Successive daily wicks near resistance show supply absorption and fading bullish pressure.
Extended rally: After weeks of near-vertical movement, overbought conditions make the market vulnerable to pullback.
📉 Levels to Watch:
3,710 → (Fib 38.2%) first resistance / potential reversal zone.
3,668 → (Fib 61.8%) initial downside target if weakness persists.
3,600 → (Fib 100%) strong bearish target and possible channel midline retest.
Bias: Bearish as long as price remains under 3800. A sustained breakout and close above this zone would invalidate the downside scenario and open the door for higher highs..
GOLDCFD trade ideas

Gold (Sep 22–26): Can Bulls Defend $3,700 as ETF Inflows Slow?1. Institutional Forecast Updates
Goldman Sachs (Sep 4, 2025): Targets $3,700/oz for Q4 2025 and $4,000/oz for Q2 2026.
J.P. Morgan (Apr 22, 2025): Projects $3,650/oz for Q4 2025 and sees prices above $4,000/oz by Q2 2026.
References:
www.reuters.com
www.reuters.com
2. Key Drivers & Risks
🟪 Gold ETF flows: Gold-backed ETF inflows surged in 2025, but high prices have caused those inflows to slow.
🟧 Central Bank Statistics: Central bank demand increased in 2025, but they largely held their reserves with little buying or selling.
🟨 Markets are anticipating further Fed rate cuts, which would lower real interest rates and reduce the opportunity cost of holding gold.
🟩 Political and geopolitical tensions have eased recently, with no new developments providing additional support for gold prices.
🟦 The economic environment appears stable (the S&P 500 VIX is currently low), which could shift capital toward higher-risk markets.
⇨ There are no clear signs of a sustained decline in gold prices, but caution is advised around the $3,700/oz level, as institutional inflows are weakening and downside risks are present.
Source: World Gold Council
3. 🏦📊 Technical Analysis
* Trend: assessed using at least three trend indicators, with market structure as the primary guide.
** Weak or Reversal Signals: Assessed based on one of our criteria for trend reversal signals.
*** Support/Resistance: Selected from multiple factors – static (Swing High, Swing Low, etc.), dynamic (EMA, MA, etc.), psychological (Fibonacci, RSI, etc.) – and determined based on the trader’s discretion.
**** Our advice takes into account all factors, including both fundamental and technical analysis. It is not intended as a profit target. We hope it can serve as a reference to help you trade more effectively. This advice is for informational purposes only and we assume no responsibility for any trading results based on it.
How do you think about this idea? Let us know your thoughts below :)

Gold Market Update & Trading PlanHello traders,
After Gold reached its All-Time High (ATH), we've seen a consistent pullback. My trading plan has been successful, and I've been profitable with short positions.
Gold has now shown a Change of Character (CHOCH) on timeframes ranging from M15 to H4. This is a highly reliable signal within my trading system. As you can see in the image, I've marked the current swing high and low. This bracket is where I'll be creating a more disciplined trading plan. If you follow me, I'll continue to update my trades as they happen.
You may notice that I sometimes post an entry after the price has already moved. This is because I need time to write and share the content, and the price moves in real-time. My primary timeframe is M15, and I use M5 for refining my entry points. Unfortunately, tradingview system does not allow me to share M5 charts as the timeframe is too small.
My entire trading strategy is based on Smart Money Concepts (SMC), and I only use a single entry model for every trade. My trading frequency is relatively low, typically 1-2 trades per day, depending on market conditions.
For each trading zone, I've assigned a probability of winning (high, medium, or low). I will always let you know what it is. I primarily trade in medium-to-high probability zones. If I take a low-probability trade (for example, if I haven't entered a trade all day), I will reduce my position size by 50% and aim for a smaller target to increase my win rate. However, my risk-to-reward ratio must be at least 1:2. These are the rules I've set for myself.
Latest Gold Market Status:
In my view, Gold is likely to continue its move down to the next demand zone I've identified. It may also pull back before continuing its descent toward the 3700 zone, which was a previous trading bracket.
My Trading Plan:
I'm prepared to trade both swings: a short-term pullback to the upside and a short position on the main swing to the downside. The latter offers the highest probability and reward.
Keep in mind, this is just a forecast. I will adjust my plan as market conditions change, and I will be sure to keep you all updated.
Thank you for your continued support and for following along. I hope my trading insights are helpful to you all.
If you have any questions about my SMC approach, feel free to ask in the comments below. I'm happy to answer. I'm also open to any recommendations you might have.

XAUUSDGold is still in a strong uptrend, the price has a chance to test the $3770-$3782 level zone, if the price cannot break through the 3782 level, there is a chance that the price will go down, consider selling the red zone.
🔥Trading futures, forex, CFDs and stocks carries a risk of loss.
Please consider carefully whether such trading is suitable for you.
>>GooD Luck 😊
❤️ Like and subscribe to never miss a new idea!

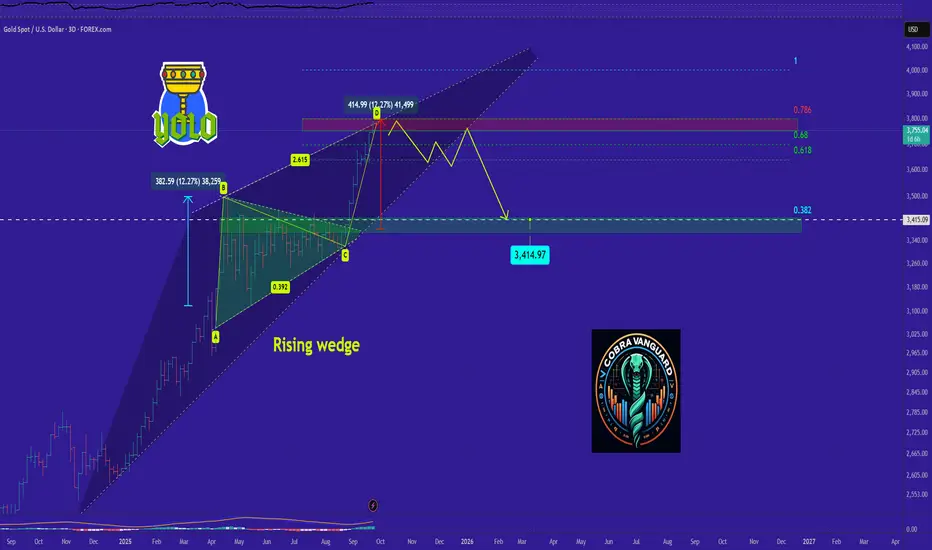
GOLD is bearish now and many Traders don't see it !!As you can see, the price is within a descending wedge, and it has reached the upper boundary of this wedge. According to technical analysis patterns, the price has closely followed the AB=CD pattern, indicating a need for a slight correction. In the coming days, the price may range within this wedge, and if the pattern breaks, the price could drop to the Fibonacci levels shown.
#XAUUSD: Neutral View On Gold May Go Either Side Gold has rallied to $3700 making it all time high level. However, at this moment gold remain uncertain as it can go either way of the trend. Therefore we have two point of view on current time; firstly since heavily bought, we can see a nice correction taking price to almosr 3550 area which remain crucial. The problem with this approach is we need strong confirmation snd currently we do not have. Second view is that price may continue the bullish approach and may take price to a record high.
Team Setupsfx

What kind of rebellion is there in human nature?Honestly, I'm afraid to say what numbers gold will face in the upward path that began in 2001!
I consider the price range drawn on the gold chart as a future price target, but we won't have much time to reach this price target! And the speed of events is moving in a direction that has ultimately led to an increase in rates!
Thanks
MJ.REZAEI

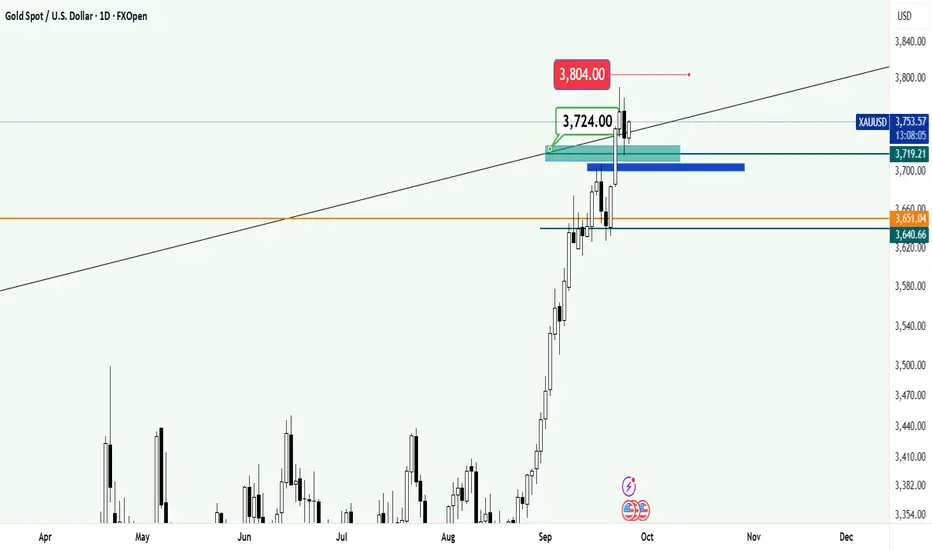
Gold is still on an upward path with a target of 3805$Gold has had a relatively good price correction after the upward trend and reaching the previous price targets and has compensated for some of this price correction at the time of writing!
If the price correction continues to the blue box area, it is still a good opportunity to reach the new price target in the area of $ 3,805 per ounce of gold.
Gold–Consolidation Before Next Move | Breakout or Retest?Gold is trading around 3,773 after a strong rally, now moving in a consolidation range.
Immediate resistance sits in the 3,790–3,800 zone, where bulls need a breakout for further upside momentum.
On the downside, key supports are marked at 3,763 and 3,747.
If price holds above these supports, we could see another bullish leg higher.
A clean break below 3,747 may open the way toward deeper support at 3,720.
Currently, the market is in a decision zone — the next breakout will confirm the short-term direction.
👉 Do you expect Gold to break higher, or retest deeper supports first? Share your view in the comments.

A Framework for Survival and GrowthTrading isn’t just about spotting patterns or indicators — it’s about survival, consistency, and growth. Without rules, the market will chew you up and spit you out.
Trading is also simple but not easy. The market doesn’t owe you consistency, it rewards process.
These seven rules are not motivational slogans: they’re operating principles you must turn into habits. Below each rule you’ll find why it matters, how to apply it, and concrete actions you can take on charts today.
1) Protect Your Capital First ( capital is king )
Why it matters
Capital is your optionality. Lose it quickly and you cannot trade to recover. Bigger wins mean nothing if you’re repeatedly wiping accounts. Trading is a longevity game: the longer you survive, the more compounding edge you’ll capture.
nerdy tip :
Treat capital like ammo. Allocate risk so you can survive a losing streak.
Define maximum drawdown limits for your account and stop trading if you exceed them.
Avoid strategies that require frequent large bets or Martingale-style scaling.
how to apply, example :
Risk per trade: 0.5%–1% of account equity (conservative) or up to 2% (aggressive, but rare).
Example calculation (step-by-step): account = $10,000; risk = 1% → risk amount = $10,000 × 0.01 = $100. If your stop is 40 pips, value per pip = $100 ÷ 40 = $2.50 per pip. Size your position so one pip equals $2.50.
Set a daily-stop: e.g., if you lose 3% in a day ($300 on a $10k account), stop trading for the day. Reset, review, and return tomorrow.
2) Trade with a Plan ( Risk : Reward (R:R) — don’t trade where math is against you )
Why it matters
Win rate and R:R together determine expectancy. You can be profitable with a low win rate if your winners are large enough; conversely, a high win rate with tiny winners and large occasional losses will still lose money.
nerdy tip :
Target trades with at least 1:2 R:R as a minimum. Better setups often give 1:3 or more.
Use partial profits and trailing stops to convert large theoretical targets into realizable gains.
how to apply :
Expectancy example (clear math): Win rate = 40% (0.40), average winning trade = 2R, average losing trade = 1R. Expectancy per trade = (0.40 × 2R) − (0.60 × 1R) = 0.8R − 0.6R = 0.2R. That’s positive expectancy.
Always calculate required move to hit your TP: if your stop = 40 pips and target = 80 pips, you have 1:2 R:R. Enter only if that setup is realistic given structure and volatility.
3) Stoploss = Lifeline
Why it matters
Stops are not bureaucratic—they’re your survival mechanism. Without a stop you trade with hope, not probability. The stop defines risk; the rest of your trade plan depends on that known value.
nerdy tip :
Place stops at structural invalidation points, not arbitrarily. The best stops say: “If price gets here, the trade idea is invalid.”
Prefer volatility-aware stops (e.g., ATR-based) when markets are noisy; prefer structure-based stops when levels are clear.
how to apply it :
Use the Average True Range (ATR) to account for volatility.
Formula: Stop distance = ATR(14) × multiplier (1.0–1.5)
Example: If ATR(14) = 20 pips on EURUSD and you use a 1.2 multiplier → stop = 20 × 1.2 = 24 pips.
This adapts to current volatility instead of using a fixed, unrealistic number like 75 pips in tight pairs.
Buffer Stop (Anti-Stop Hunt)
Add a small buffer (2–5 pips for majors, slightly more for volatile pairs) beyond obvious highs/lows.
Purpose: avoid being wicked out by stop-hunts, but keep the risk controlled.
Trailing Stop (Locking in Profits)
As the trade moves in your favor, trail your stop to lock in gains without exiting too early.
Methods:
Fixed pip trail: e.g., move stop up by 15 pips once price is 20 pips in profit.
ATR trail: dynamic — stop follows price at a distance of ATR(14) × multiplier (e.g., 1.0).
Structure trail: move stop to below each new higher low in an uptrend (or above each lower high in a downtrend).
4) Trend — identify, respect, and choose how to engage it
Why it matters
Trading with the trend gives you tailwinds. Many retail losses come from “fighting the market.” A clear trend increases the probability that pullbacks will resume in the same direction.
nerdy tip:
Determine higher-timeframe (HTF) bias first. Use daily/4H for swing trades; 4H/1H for intraday. Label the HTF as bullish, bearish, or range.
Trade in the direction of HTF bias when possible. In a strong trend, prefer pullback entries (trend-following). In ranges, prefer range strategies (fade the extremes).
how to apply it :
Trend identification checklist: HTF HH/HL = uptrend; LL/LH = downtrend. Confirm with a simple moving average slope or higher-timeframe structure break.
Pullback entry rule in a bullish trend: wait for price to retrace to a confluence zone (moving average + prior support + demand zone) and show LTF rejection (reversal bar, bullish engulf, or momentum candle) before entering.
If the market shows structure break on HTF, treat the trend as weakened and either reduce size or switch to structural reversal rules.
5) Kill Emotions — build systems so emotions cannot destroy logic
Why it matters
Fear and greed are predictable: fear causes premature exits; greed causes size creep; revenge trading follows losses with impulsive bets. Good process neutralizes emotion.
nerdy tip :
Replace feelings with rules. Create a pre-trade checklist and an emergency stop-trading rule (if you break rules/size, stop for the day).
Use automation: limit orders, OCO orders (one-cancels-other), and predefined trade templates to avoid impulsive market orders.
how to apply it :
Pre-trade checklist (must be read aloud or checked): HTF bias? Setup valid? Entry level? Stop placed? Size correct? News window clear? If any “no” — don't trade.
Emotional cooldown: after 2 consecutive losers, reduce size by 50% or stop for the session. After a big win, reduce size (to avoid overconfidence).
Record emotional state with each trade in your journal — rating 1–5 — and track patterns (e.g., most mistakes happen at 9–11 PM).
6) Plan > Impulse (your plan is the only scalable edge)
Why it matters
Impulse destroys positive expectancy. A plan captures your edge; impulse leaks it away. Trading is not about how many ideas you have — it’s about disciplined execution of a few good rules.
nerdy tip :
Every trade must be part of a documented plan: bias → setup → entry → stop → targets → size → management → invalidation.
Use simple, testable rules you can backtest or forward-test with a demo.
how to apply it :
Trade ticket template to fill BEFORE entry: Pair / Timeframe / HTF bias / Setup type / Entry price / Stop price / Position size / Target(s) / R:R / Reason to take trade. If you can’t complete it, don’t take the trade.
Management plan examples: take 30% at 1R, move stop to breakeven on 50%, trail by ATR or swing lows afterward. Decide these before entry and stick to them.
7) Review & Evolve — data over ego
Why it matters
If you don’t measure, you can’t improve. The market changes; what worked last year may fail next. Regular review converts experience into repeatable improvements.
nerdy tip :
Keep a trade journal (yes, every trade). Analyze metrics monthly and iteratively adjust one variable at a time.
Use quantitative metrics: win rate, average R per trade, expectancy, max drawdown, average hold time.
how to apply it :
Minimum journal fields: date, pair, timeframe, direction, entry, stop, size, R multiples (entered risk as R), outcome, notes, emotional state, lesson.
Review ritual (weekly/monthly): calculate expectancy = (win rate × avg win) − (loss rate × avg loss). If expectancy is negative, stop and debug—don’t keep trading hoping it reverses.
Evolve by A/B testing changes: e.g., change stop placement or time-of-day filter and run 50 live/demo trades to compare outcomes.
Quick practical checklist ( BONUS SECTION ) :
HTF bias labeled (✔)
Setup aligns with bias (✔)
Stop based on structure/volatility (✔)
R:R ≥ 1:2 (or plan for partials) (✔)
Position size aligns to risk% per trade (✔)
Pre-trade checklist completed (✔)
Post-trade journal entry made (✔)
Final words : make these rules habits, not afterthoughts
Rules alone don’t make you profitable; habits do. Turn each rule into a checklist, run the checklist before and after trades, and make the review process non-negotiable. Start by fixing one rule for 30 days — for example: “I will never risk more than 1% per trade.” Once that becomes habit, add another. Small persistent
put together by : Pako Phutietsile as @currencynerd

Lingrid | GOLD Potential Pullback from 3700 Psychological LevelOANDA:XAUUSD faced rejection at the 3,700 resistance zone, signaling exhaustion in the recent bullish leg. The divergence at the highs supports a potential reversal, with price already slipping back toward the mid-range of the upward channel. If momentum continues lower, a breakdown under 3,635 could open the way toward 3,570 as the next key support. Sellers remain favored while price trades below 3,700, keeping the bias tilted downward.
⚠️ Risks:
A sudden risk-off move or geopolitical tension could revive safe-haven demand for gold.
Any dovish Fed shift or weaker US data may fuel a breakout above 3,700 instead.
Strong ETF inflows or central bank demand could limit downside pressure.
If this idea resonates with you or you have your own opinion, traders, hit the comments. I’m excited to read your thoughts!

ANFIBO | XAUUSD - A psychological zone $3800 ? [09.25.2025]Hi guys! Anfibo's here!
Overall Picture Today:
OANDA:XAUUSD is currently maintaining stability within the H4 bullish channel, reflecting the sustainability of the prevailing uptrend. Although no major breakout has occurred in recent sessions, the technical structure indicates that buyers still hold the advantage. However, the market is showing signs of stalling at a key resistance zone, so short-term trading plans should focus on resistance and support levels to optimize profits.
> SUPPORT KEY LEVELS: 3748 - 3733 - 3703
> RESISTANCE KEY LEVELS: 3768 - 3777- 3788 - 3799
Here's my Trading Plan today:
>>> SELL SCALP:
ENTRY: 3770 - 3765
SL: 3780
TP: 3720 - 3705
>>> BUY ZONE:
ENTRY: 3700 - 3705
SL: 3695
TP: 3760 - 3800
Always set stop-loss and good money management for success!
GOODLUCK GUYS!!!

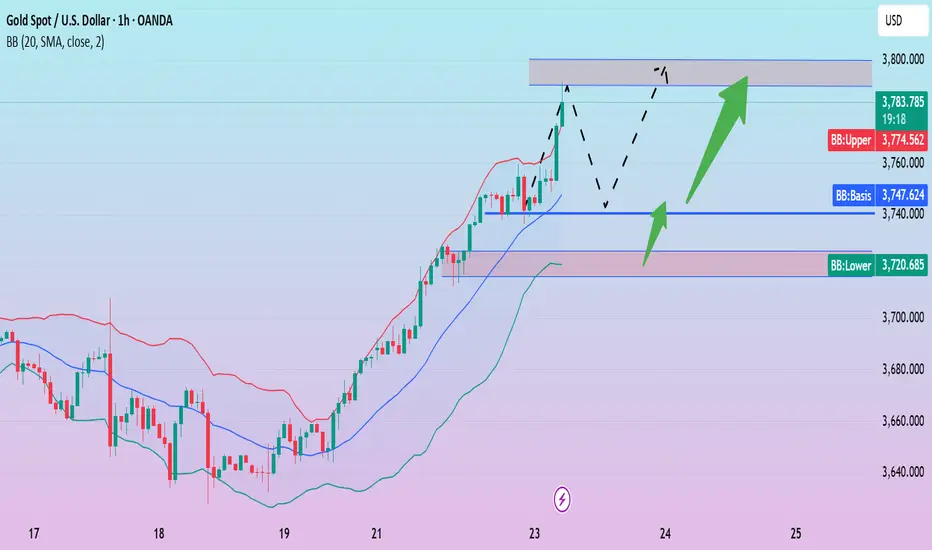
Gold is going crazy. Will it continue to break through?Gold hit a new all-time high near 3758 on Monday; on Tuesday, prices continued their relentless rise, currently reaching a high near 3791.
From a technical perspective, the Bollinger Bands have opened upward again, and the price is continuing to move within the upper Bollinger Bands, suggesting continued short-term gold gains. Gold is trading upwards, supported by the MA5 moving average. The trend is clear, with minimal room for correction. There's no strong resistance above. The 3780 resistance level I mentioned in the Asian session was strongly broken through in just five hours.
Short-term trading remains bullish, with support below the 1-hour line around 3735, and further retracement focusing on the 3725-3715 area. On the whole, the short-term operation strategy for gold is to mainly go long on pullbacks and short on rebounds. The short-term focus on the upper side is the 3790-3800 resistance, and the short-term focus on the lower side is the 3750-3740 support.
adjustment reduction, liquidity 3730⭐️GOLDEN INFORMATION:
Gold (XAU/USD) steadies near $3,760 in Wednesday’s Asian session after pulling back from a record $3,791. Expectations of further Fed rate cuts and safe-haven demand continue to underpin the metal. Fed Chair Jerome Powell noted the “challenging” balance between inflation risks and a weakening labor market, signaling readiness to ease policy further if needed. Markets now price in two additional 25 bps cuts this year, in October and December, which would lower the opportunity cost of holding non-yielding Gold.
⭐️Personal comments NOVA:
correction down, accumulation and continue to increase price towards 3800
⭐️SET UP GOLD PRICE:
🔥SELL GOLD zone: 3800- 3802 SL 3807
TP1: $3790
TP2: $3780
TP3: $3770
🔥BUY GOLD zone: $3730-$3728 SL $3723
TP1: $3740
TP2: $3750
TP3: $3760
⭐️Technical analysis:
Based on technical indicators EMA 34, EMA89 and support resistance areas to set up a reasonable SELL order.
⭐️NOTE:
Note: Nova wishes traders to manage their capital well
- take the number of lots that match your capital
- Takeprofit equal to 4-6% of capital account
- Stoplose equal to 2-3% of capital account

GOLD GPS"The 3750-3760 zone presents optimal sell-side setups, with key resistance at 3720. Should bullish reversal patterns emerge locally, a scalp long trade is feasible, targeting a pullback toward 3700."

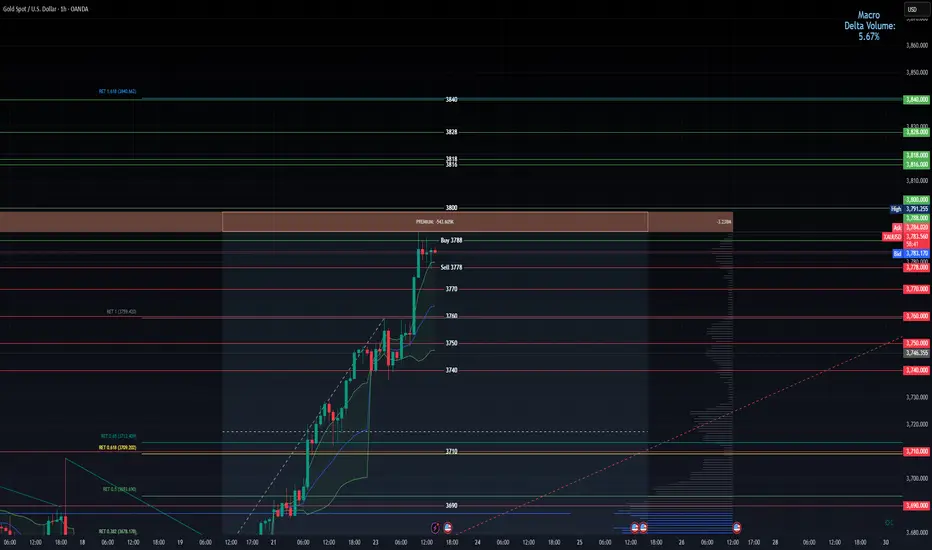
Gold mid week update with buy and sell levelsWeekly chart from sunday ran 1000 pips from entry.
if anyone caught this with me can i ask you to boost this idea as am not sure if its worth continueing to publish if no one is using this.
for today we have red folder news so heres the levels ill be looking at
For a buy i want to see a retest of 3788 expecting low 3810 levels
For a sel lill wait to enter at 3778
ill update at end of day
trade safe
GOLD: Short Trade Explained
GOLD
- Classic bearish pattern
- Our team expects retracement
SUGGESTED TRADE:
Swing Trade
Sell GOLD
Entry - 3726.8
Stop - 3739.3
Take - 3703.3
Our Risk - 1%
Start protection of your profits from lower levels
Disclosure: I am part of Trade Nation's Influencer program and receive a monthly fee for using their TradingView charts in my analysis.
❤️ Please, support our work with like & comment! ❤️

XAUUSD Very aggressive Bullish Leg started.Gold (XAUUSD) is on a remarkable bounce just after marginally breaking below the 4H MA50 (blue trend-line) and reaching the bottom of the 1-month Channel Up, which is technically the new Bullish Leg of the pattern.
The previous one extended all the way to +10.65% (which gives us a $4000 long-term Target) before the 4H RSI started to decline on Lower Highs, which on a sidenote gave us the bullish confirmation required when the RSI broke above them today.
On the short-term however, we are looking for a much more plausible Target at $3800, which has been the standard mini-rally sequence that this Channel Up has offered.
-------------------------------------------------------------------------------
** Please LIKE 👍, FOLLOW ✅, SHARE 🙌 and COMMENT ✍ if you enjoy this idea! Also share your ideas and charts in the comments section below! This is best way to keep it relevant, support us, keep the content here free and allow the idea to reach as many people as possible. **
-------------------------------------------------------------------------------
💸💸💸💸💸💸
👇 👇 👇 👇 👇 👇

Will Gold Break Higher Toward 3740?Gold continues to show strength on the 4H chart, with buyers holding price action above key moving averages. The market recently broke out of a consolidation phase, signaling potential for further upside movement.
Key Levels:
Buy Entry Point: 3710
Take Profit: 3740
Stop Loss: 3690
Reasoning:
Gold has shown strong bullish momentum, bouncing above the moving averages and breaking short-term consolidation. This setup suggests continuation toward the next resistance zone around 3740. Placing the stop loss at 3690 provides downside protection just below the support level, while targeting 3740 captures the upside potential within the swing move.
Disclaimer:
This analysis is for educational purposes only and not financial advice. Markets are volatile—always manage risk and trade according to your own strategy.

Gold Enters a Turbulent Phase
In my previous analysis , I noted that OANDA:XAUUSD COMEX:GC1! COMEX_MINI:MGC1! was preparing to break out of a prolonged re-accumulation phase (April–August 2025). This scenario has played out: the market confidently broke above the upper boundaries of the range.
At the moment, the price is most likely completing wave 3 of the impulse, which has shown a classic extension (~2.618 of wave 1).
Next, I expect a correction in the form of a triangle or a flat correction (lasting 2–3 weeks). During this period, the volume accumulated below will be redistributed, followed by one more final upside climax.
The local wave count may look like this:

The bearish trend will continue unless the price rises above3765#XAUUSD OANDA:XAUUSD
Gold closed with a negative daily line, reaching a low of around 3717. If today's closing daily line falls below the MA5 moving average and touches the MA10 moving average, we need to be alert that the bears may dominate the market again tomorrow, Friday.
The downward trend is still under pressure during the day, and trading is still mainly short-selling. The immediate resistance level to watch is 3748-3750, which also marks the boundary of the triangle pattern; a touch of this level could signal a short-selling opportunity. Further pay attention to the trend pressure of 3765. As long as this point is not broken, the short trend of gold will not change. Pay attention to the short-term support of 3735-3720 below. You can go long on gold if it is not broken on the first pullback.

Correction Not Enough,The Real Drop Is Yet to ComeGold began to retreat from 3778 yesterday, breaking through the key support levels of 3755, 3740 and even 3730, and hitting a low of around 3717, a drop of $60. In view of the recent continuous upward trend and the fact that it is near the 3800 mark, this is undoubtedly another heavy blow to the bulls.
From the perspective of morphological structure, gold may form a new downward trend channel with the help of high points near 3790 and 3778. If gold cannot successfully break through the 3755-3765 area during the rebound, it means that the gold downward trend channel may be successfully constructed, which will further stimulate gold to continue to decline.
As for the rising channel, gold is currently facing resistance in the 3760-3770 area. Before breaking through this area, gold bulls may still be weak. Then due to the technical resonance of the two channel resistances, it may be difficult for gold to easily break through the 3760-3770 resistance area at present.
So for short-term trading, we can start shorting gold at 3755-3765. If gold continues to rise within a limited space, we can consider adding positions.The short-term support area below is first focused on the 3740-3730 area, followed by the 3715-3705 area.

XAUUSD-SHORT IDEAGold has formed a clear lower high I've mentioned everything about gold in the yesterday chart now put your sell stop and take the trade.
