GOLD → Breakthrough of correction resistance. Uptrend FX:XAUUSD entered a correction phase after the Fed meeting and interest rate cut, but by the end of the week, the market managed to recover from the decline and return to the zone of interest, breaking through the resistance of the downtrend...
The dollar is correcting after the Fed meeting on interest rates. The index is testing resistance at 97.5-98.0, and a false breakout of this zone could trigger a fall in the index, which in turn would only support the forex and gold markets...
At this time, the metal is reducing its correlation with the DXY and breaking the resistance of the downward correction, which is provoking an impulse to 3685. Technically, Friday's trading session is closing quite positively, which generally indicates a high level of demand.
I would highlight several key levels: the previously broken resistance at 3674 (below this zone there is a hidden liquidity pool) and resistance at 3685 (trigger). A retest of the lower level is possible before the price continues its growth. The target within the current movement can be considered 3700 - 3710.
Support levels: 3674, 3668, 3660
Resistance levels: 3685, 3703, 3710
If, during the Asian/Pacific session, gold consolidates without a pullback and closes above 3685, the market may continue to rise towards the specified target. However, if the market lacks potential (after the weekend), then MM may test 3674 - 3668 before the price returns to growth towards the target of 3700.
Best regards, R. Linda!
GOLDCFD trade ideas

Gold on the Edge of a Breakout or a Sharp Pullback?🔎 Technical Analysis
Main Trend:
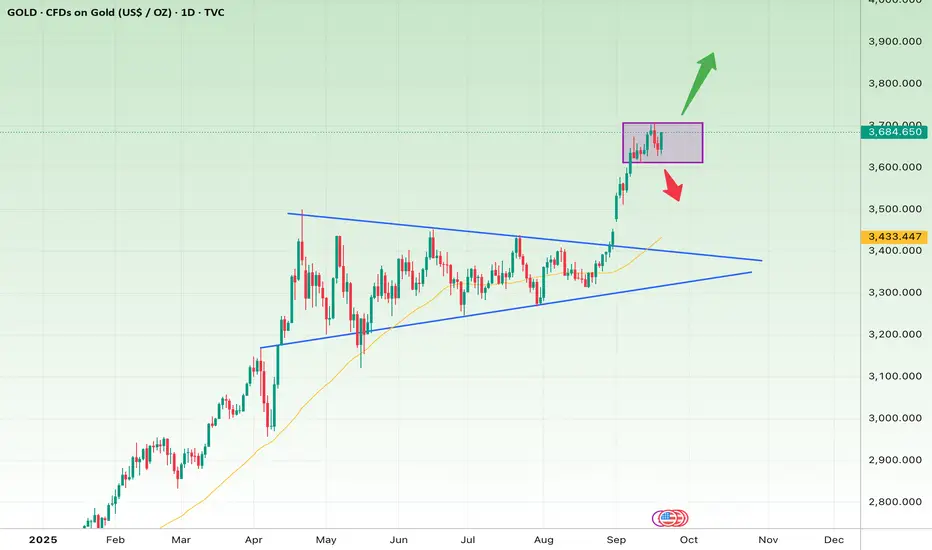
Since early 2025, gold has been in a strong uptrend. The breakout from the symmetrical triangle in September was decisive, with strong momentum, pushing the price quickly above $3,600.
Current Situation:
Price is now consolidating in a range box ($3,630–$3,700). This is a healthy pause after the sharp rally, serving as an accumulation zone before the next major move.
Indicators & Signals:
The 50-day MA (yellow) is acting as dynamic support.
Bullish candles are larger and more frequent than bearish ones → buyers remain in control.
However, a short-term pullback to retest lower supports is still possible.
📈 Short-Term Outlook (1–3 weeks)
Bullish Scenario (more likely):
A breakout above $3,700 could fuel another rally toward $3,780 – $3,850.
Stop-loss: Close below $3,620.
Bearish Scenario (less likely):
A breakdown below $3,620 could trigger a correction down to $3,480 – $3,430 (confluence with the 50-day MA and the broken triangle top).
Stop-loss for shorts: Above $3,700.
📊 Long-Term Outlook (2–4 months)
The overall structure remains bullish, with the triangle breakout still in play.
As long as price holds above $3,430, the long-term uptrend is intact.
Key targets:
First target: $3,900 (psychological level)
Second target: $4,200 (technical projection from the triangle pattern)
Long-term stop-loss: A sustained close below $3,300 would invalidate the bullish outlook.
✅ Summary:
Short-term: The key level is $3,700. A breakout above confirms continuation, while a drop below $3,620 signals a correction.
Long-term: Trend is bullish as long as price stays above $3,430, with $4,200 as a realistic upside target.
Gold Enters a Turbulent Phase
In my previous analysis , I noted that OANDA:XAUUSD COMEX:GC1! COMEX_MINI:MGC1! was preparing to break out of a prolonged re-accumulation phase (April–August 2025). This scenario has played out: the market confidently broke above the upper boundaries of the range.
At the moment, the price is most likely completing wave 3 of the impulse, which has shown a classic extension (~2.618 of wave 1).
Next, I expect a correction in the form of a triangle or a flat correction (lasting 2–3 weeks). During this period, the volume accumulated below will be redistributed, followed by one more final upside climax.
The local wave count may look like this:

GOLD. XAUUSD Long
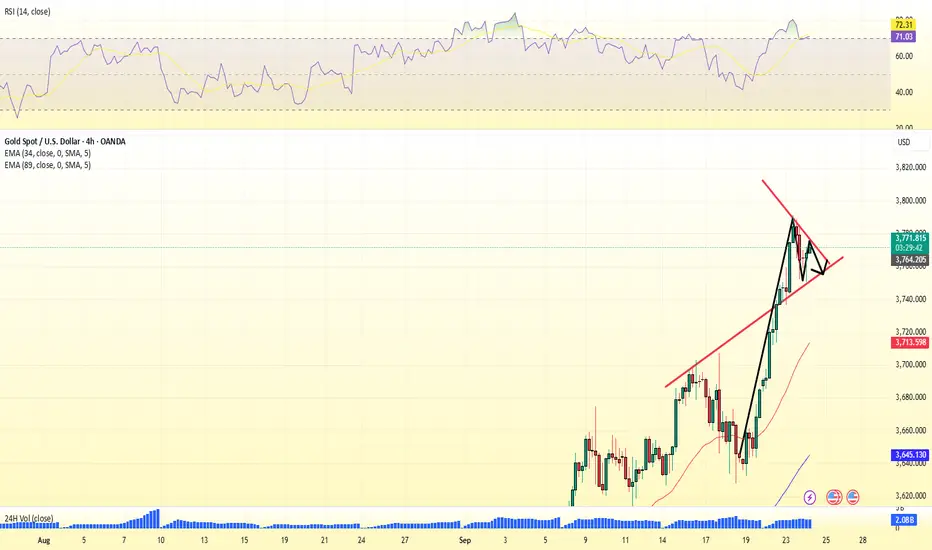
ENTRY 3766.47
SL 3727.37
TP 3826.36
This is essentially a trendline bounce setup: buying near support, stop just below, targeting higher highs.
Stop is 42 points below entry.
Target is 57 points above entry.
That’s a 1.3 R/R ratio (acceptable but could be improved if risk is tightened).
RSI is currently below 40 and is curving upward.
This suggests a possible bullish momentum shift (oversold bounce).
Invalidation: A break below the trendline and the stop-loss zone would suggest trend reversal or deeper pullback.
Fundamentally, Gold is undervalued versus the Treasury bond and Dollar index. I will expect a short-term bullish move.

GOLD DAILYGOLD ,THE DAILY TF has come to a strong resistance after attempting 3790-3792 during London /newyork GOLD BUYING BY CENTRAL BANKS.
the 15min ascending trending line another defensive line for buyers .
the demand is high and could continue to to buy on a possible demand floor .
the daily resistance will correct to 3700 approximately 900pips drop if possible ,if sellers fails to draw down price then 3825-3817 will be watched as the next resistance on the roof of the bullish 15min channel.
#gold #xauusd

Gold SellFor Gold, there is bad order flow and price reacted from a counter POI which is in play with the weekly cycle.

STILL BULLISH Those days I would sell and expect it to go down more because m15 failed to break bearish structure but now, i see it as a sell trap, i still see more buys.

XAUUSD (15m) – SNR StrategyPrice is testing the 3,779 resistance zone, which previously acted as supply. The rejection aligns with a bearish structure, suggesting a possible short continuation.
Resistance (Supply): 3,774 – 3,779
Support (Demand): 3,740 – 3,730
Bias: Bearish below resistance
Stop Loss: Above 3,779
Take Profit: 3,740 – 3,730
SNR View:
Resistance is holding strong at 3,779.
Lower highs confirm weakening bullish momentum.
Next support lies at 3,740; a break could extend to 3,730.
📉 Expecting price to respect resistance and move lower toward support.
Hashtags:
#XAUUSD #Gold #ForexTrading #PriceAction #SNRStrategy #SupplyDemand #DayTrading #TradingView

XAUUSD--Ascending Channel--Bullish bias
--Looking at the sizes of the candles, we see momentum decreases. But it seems GOLD will rise more.At least up to the upper side of the channel.

Gold pro internal-bearish trend !Good day, traders!
Hope you're all having a great trading day.
From the Asian session into the London session, Gold pushed up into my extreme supply zone on the M15 timeframe. This presents a great opportunity to short Gold back to the previous low where it originated.
My internal trend bias is still bearish, but it's important to remember that the main trend on Gold is still extremely bullish.
I'm using half my usual risk for this trade since it is a counter-trend setup.
Good luck. I hope this provides some useful insight.

XAUUSD (GOLD) 30M – Intraday AnalysisPrice is consolidating between $3,770.28 (buy trigger / resistance) and $3,749.75 (sell trigger / support). Current price is around $3,768, sitting just below resistance. A confirmed breakout will guide direction.
🔼 Bullish Plan (needs confirmation)
Trigger: 30-min body close above $3,770.28.
Targets: $3,772.11 → $3,774.21 → $3,776.38 → $3,778.35.
Management: Take partials at $3,772.11, move SL to breakeven once $3,770 is cleared, trail remainder if momentum continues.
🔽 Bearish Plan (clean if floor breaks)
Trigger: 30-min body close below $3,749.75.
Targets: $3,747.61 → $3,746.33 → $3,744.82.
Management: Scale partials at $3,747.61, protect remaining position at breakeven. Trail if sellers extend.
🔄 Range Scalp (higher risk — small size)
Shorts: rejection near $3,770 → aim $3,760–$3,762, SL above rejection high.
Longs: bounce near $3,750 → aim $3,758–$3,760, SL under lows.
✅ Break Confirmation
Strong 30-min body close through the level.
Momentum expansion after breakout.
❌ Invalidation
Breakout closes back inside the range on the next candle (trap).
Multiple wicks through level without continuation.
📌 Bottom Line
Above $3,770.28 → bullish bias toward $3,778.35.
Below $3,749.75 → bearish bias toward $3,744.82.
Inside the box = scalp only, keep risk controlled.

GOLD (XAUUSD): Intraday Bullish Signal
Gold looks very bullish this morning, forming a confirmed
Change of Character after a test of a key intraday horizontal support.
With a high probability, the price will rise more today and reach 3784 level.
❤️Please, support my work with like, thank you!❤️
I am part of Trade Nation's Influencer program and receive a monthly fee for using their TradingView charts in my analysis.

FED Chairman satisfied with current FED policy directionThe Fed Chairman is satisfied with the current policy direction of the Fed, while leaving open the possibility of further interest rate cuts if the FOMC deems it necessary to support the economy.
Mr. Powell assessed that the worsening employment situation has changed the balance of risks in achieving the Fed's goals.
On the other hand, the current policy stance is still tightening, giving the Fed enough room to respond to potential economic developments.
Despite the slowing growth, gold prices are still receiving support from many factors. Commerzbank said in a note that strong buying from ETF investors - fueled by expectations of interest rate cuts, concerns about the independence of the Fed and geopolitical developments - could also boost gold prices.
World gold prices received support as the People's Bank of China continued to buy gold regularly, despite the sharp increase in prices. According to the assessment of Société Générale Bank (France), China will still be the "dominant player" in the gold market for many years to come, despite high prices that may further limit purchasing power.v
Gold Intraday Trading Plan 9/23/2025Gold pumped yesterday without much chance for longing orders. It now has entered my selling zone. I will look for selling opportunity from 3750-3767. My initial target will be 3700.
Let's see how the market plays out.

Gold Intraday Trading Plan 9/24/2025Yesterday I mentioned that gold has entered my selling zone of 3750-3766. However, it went all the way to 3790 and retraced to 3760 area. Although overall trend is bullish, gold is ready to have some correction now. Technically, the three continuous red bar in 4h TF suggests the same thing. There could be some bouncing back at around 3750. But price should drop to 3700 today. Let's see how the market plays out today.

uptrend As long as the price fluctuates above the support range, the continuation of the upward trend is likely. The identified resistance levels will be the targets of the upward trend.

Gold's Next Move: Is a Breakout Imminent?Looking at the XAUUSD chart, I’m finding it quite fascinating.
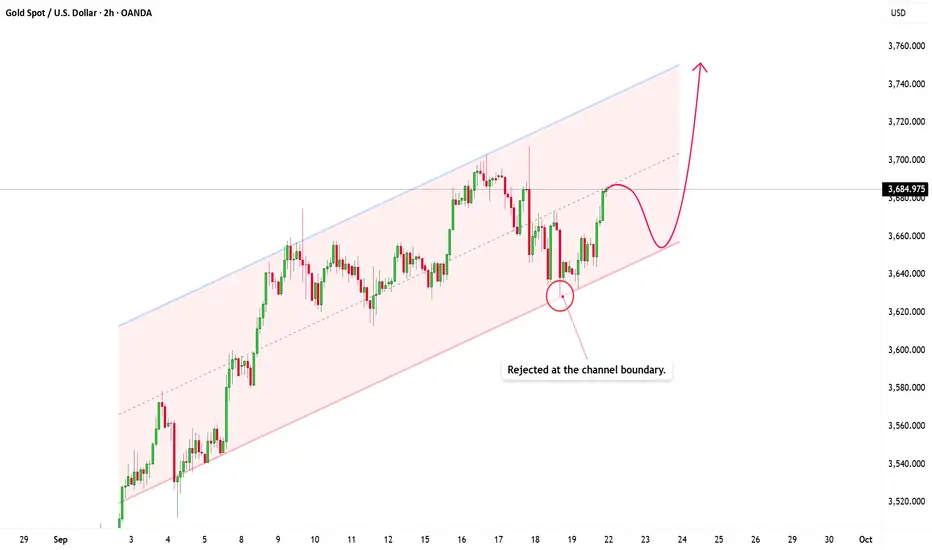
Here’s the situation: XAUUSD is moving within an upward parallel channel, respecting the market structure perfectly, and we’re starting to see early signs of renewed buying interest right after a strong rejection from the support zone.
Currently, price is trading near a key resistance zone, and this is where the market gets interesting. At this resistance zone, there's a high likelihood of a short-term correction within the price channel. If price holds within the channel, the uptrend could continue, and the upper channel boundary might even be broken, extending the upward momentum further.
I’m targeting the upper boundary of the channel, and given the market context, this is entirely possible.
Keep in mind that, in a channel like this, trading with the trend is generally more favorable than fighting against it. Until the channel is broken, the bulls are still in control.
Do you agree? Feel free to share your thoughts in the comments below!
#8792025 |XAUUSD Selling opportunity 1:20 XAUUSD Selling opportunity Appears in H4 Time Frame Looking Price Action for Long Term Sell
Risk and Reward Ratio is 1:20
After 50 pips Profit Set SL Entry Level
"DISCLAIMER" Trading & investing business is "Very Profitable" as well as risky, so any trading or investment decision should be made after Consultation with Certified & Regulated Investment Advisors, by Carefully Considering your Financial Situation.

market memory, the many faces of support and resistance.Every trader is introduced to support and resistance (S&R) early on. At first, it looks simple: support is where price stops falling, and resistance is where price stops rising. But the more screen time you log, the clearer it becomes that this tool is not just a “line on the chart.”
It comes and is taught in many forms: sometimes sharp and obvious, other times hidden and subtle. The challenge for traders is to recognize which form the market is respecting at any given moment.
Let’s go deeper into the different types of support and resistance, how they work, and why they matter.
but first there is one golden rule of support and resistance, past support turns into resistance and vice versa, try to look closely at the chart examples i will present and watch how price reacts to the S&R zones and levels, and how this plays out...
1. Horizontal Support and Resistance – Market Memory in its Purest Form
The most classic form of S&R is drawn horizontally at prior swing highs and lows. Price touches a level multiple times, and traders begin to see it as significant.
Why it works: Markets are driven by collective memory. If price was rejected at 1.1000 three times before, traders naturally hesitate around that level again. Buy orders cluster below old lows, and sell orders cluster near old highs.
How to trade:
Bounce trade: Wait for price to retest the zone; enter on confirmation (pin bar, engulfing bar, volume spike). Place stop beyond the opposite edge of the zone or beyond the reaction candle wick.
Break & retest: When a level breaks with conviction, wait for price to retest it from the other side. That retest becomes a new entry with confluence (volume, SMA, trendline).
Use RR (reward:risk) based on the zone width. Don’t expect perfect fills — treat zones as areas.
Pitfalls & pro tips:
Fakeouts are common: institutional players sweep stops to gather liquidity. Expect occasional whipsaws.
Vertical significance matters: daily/weekly horizontals are more reliable.
Volume or momentum at the reaction adds conviction. A horizontal with no volume is weaker.
chart example :
the chart above is represented by candlesticks and for beginner traders it might be hard to spot the support and resistance levels from that chart but one hack is to use the line chart because the line chart shows only the closing price and candlestick shows extreme highs and lows that can be misleading. the chart below represents the same chart above but as a line chart.
you want to plot your s&r levels around levels where price is making peaks and valleys like i have highlighted in the chart
when you turn your chart type back to candlesticks after plotting on the line chart you are able to clearly see the levels.. on the recent above chart i have shown the resistance price reactions (support holding up)
below is the same chart representing support
another example is the golden rule i mentioned above being in play, here previous resistance later holds up as support
chart example 2: highs and lows
this shows how previous day high of day 1 acts as resistance on day 2
2. Trendline Support and Resistance – Dynamic Barriers in Motion
Unlike horizontals, trendlines are angled. By connecting higher lows in an uptrend or lower highs in a downtrend, you create a slope the market respects.
Why it works: In trending markets, buyers and sellers don’t step in at fixed prices—they react to rhythm. Trendlines capture that rhythm and act as visual guides for momentum.
The nuance: Trendlines are highly subjective. Two traders may draw slightly different lines, and both might be “right.” The key is consistency—decide whether you draw them on candle bodies or wicks and stick to it.
How to trade:
Lean with the trend: buy touches of ascending trendline with tight confirmation.
Channel trades: buy near lower band, target midline or upper band; sell vice versa.
Breaks: a decisive break of a trendline with retest is often a momentum shift; trade the retest for continuation in the new direction.
Pitfalls & pro tips:
Lines are subjective — treat trendlines as a tool, not gospel.
Re-draw only on new confirmed swings; avoid redrawing every candle.
Combine with volume, moving averages or structure breaks for stronger signals.
chart example :
4. Fibonacci Retracements & Extensions – Ratios of Market Psychology
Fibonacci levels (38.2%, 50%, 61.8%, etc.) are not magical numbers; they are psychological checkpoints where traders expect pullbacks.
Why it works: Fib levels are used globally, and like MAs, they become self-fulfilling. Many institutional algos also use ratios in trade planning, reinforcing their influence.
How to identify:
Choose structural swings—the most recent meaningful high and low.
Treat levels as zones, not exact lines.
Prefer Fib confluence: a Fib level that overlaps a horizontal, MA, or trendline is far more actionable.
How to trade:
Retracement entries: watch for price to pull into a Fib zone and show price-action confirmation (pin, absorbtion, heavy volume).
Extensions as targets: use 127%/161.8% as extension targets once trend resumes.
Combine with timeframe analysis: a 61.8% on the daily aligned with a weekly level is strong.
Pitfalls & pro tips:
Picking the wrong swing yields worthless Fib levels—choose structural points.
Never trade Fib in isolation. It’s a confluence tool, not a standalone system.
chart example
identify high and low, because price was trading to the downside i will draw my fib levels from the high to the low
i did not add the other fib levels because the chart did not look clear and only highlighted the significant level that price reacted to which is the 38.2% fib level.
3. Supply and Demand Zones – Where Imbalance Rules
Supply and demand trading zooms out from single lines to zones. A sudden rally from a base suggests excess demand, while a sharp drop suggests excess supply.
Why it works: Big players (banks, funds) often leave unfilled orders in these zones. When price returns, those orders trigger, causing strong reactions.
Look for sharp moves with little overlap (big green/red candles leaving a base).
Identify the base (consolidation) before the move and mark the zone from the high to the low of that base.
Strong zones have speed and size in the move away (single big candle or sequence with increasing momentum).
How to trade:
Wait for retest: enter when price returns to the zone and shows absorption/buying interest.
Use limit entries at the edge of the zone and stop beyond the zone’s opposite edge.
Size position according to zone width — wide zones → larger stop → smaller position.
Pitfalls & pro tips:
Zones can be wide and ambiguous; tighten criteria by requiring a clean move away.
Supply/Demand pairs well with orderflow or volume profile for institutional confirmation.
chart example
rally base rally, CP (continuation pattern) - demand
chart 2
rally base drop - supply (PEAK)
4. Psychological and Round Numbers – Human Bias on the Chart
Markets are human-driven, and humans love round numbers. EUR/USD at 1.2000, gold at $2000, Dow at 40,000—these levels attract attention.
Why it works: Traders place stop-losses, take-profits, and pending orders around round figures. Liquidity clusters here, making them magnets for price.
Round numbers are less about “holding” price and more about being zones where reactions happen. Price often overshoots before reversing, because stop-hunts occur just beyond these figures.
How to identify:
These are obvious: whole figures, halves, quarters (1.2000, 1.2500, 1.5000).
Watch the tighter structural closeness: a round number that sits exactly on a daily swing is stronger.
How to trade:
Fade or follow: some traders fade the hesitation around a round number (fade the hesitation wick), others ride through on breakout if momentum is strong.
Use round numbers as confluence, pair them with horizontal, Fib, or MA for stronger setups.
Pitfalls & pro tips:
Round numbers attract stop clusters; expect overshoots. Don’t assume a clean bounce every time.
Big figures on high-liquidity pairs (EUR/USD) behave differently from lower-liquidity assets.
chart example :
resistance price : 3,700.000
support price : 3,680.000
Liquidity Pools – Advanced Market Microstructure
liquidity pools to me are not levels but zones on a price chart where a large volume of pending buy stop-loss orders and sell stop-loss orders have accumulated. i identify them by connecting highs and lows / significant levels that are close together but not close to be connected by a singular line.
Why it works: Institutions need liquidity to fill massive orders. They manipulate price into zones where retail traders’ stops sit. Once liquidity is captured, the real move begins.
The nuance: Order blocks and liquidity pools require skill to read. They are not always obvious and can trap new traders who misinterpret them.
Pitfalls & pro tips:
This discipline is subtle; misreading an order block is common. Backtest and annotate many examples.
chart example :
The Bigger Picture – One Concept, Many Faces
Support and resistance is not one tool, it is a family of tools. From clean horizontals to hidden liquidity pools, each type reflects a different aspect of market psychology.
The real skill is not memorizing them all, but asking:
Which type of support or resistance is the market respecting right now?
When you start seeing markets this way, S&R stops being “lines on a chart” and becomes a living, breathing map of trader behavior.
put together by : Pako Phutietsile as @currencynerd

XAUUSD Very aggressive Bullish Leg started.Gold (XAUUSD) is on a remarkable bounce just after marginally breaking below the 4H MA50 (blue trend-line) and reaching the bottom of the 1-month Channel Up, which is technically the new Bullish Leg of the pattern.
The previous one extended all the way to +10.65% (which gives us a $4000 long-term Target) before the 4H RSI started to decline on Lower Highs, which on a sidenote gave us the bullish confirmation required when the RSI broke above them today.
On the short-term however, we are looking for a much more plausible Target at $3800, which has been the standard mini-rally sequence that this Channel Up has offered.
-------------------------------------------------------------------------------
** Please LIKE 👍, FOLLOW ✅, SHARE 🙌 and COMMENT ✍ if you enjoy this idea! Also share your ideas and charts in the comments section below! This is best way to keep it relevant, support us, keep the content here free and allow the idea to reach as many people as possible. **
-------------------------------------------------------------------------------
💸💸💸💸💸💸
👇 👇 👇 👇 👇 👇

ANFIBO | XAUUSD - next ATH ??? [09.23.2025]Sorry guys, I'm very busy today so I can't share my views in detail. I will share my trading plan first, then update the details later ;)
Here's my OANDA:XAUUSD plan today:
>>> BUY ZONES:
ENTRY: 3715 - 3720
SL: 3710
TP: 3740 - 3760 - 3770 - 3800
>>> SELL ZONES:
ENTRY: 3800 - 3795
SL: 3805
TP: 3760 - 3730
GOODLUCK GUYS!!!

Gold Today: Continuation of the Uptrend or Entering a CorrectionHello everyone, in today’s session, gold experienced a significant pullback, dropping to 3,641 USD/ounce, a 31 USD decrease from the 3,672 USD/ounce high established yesterday. In the futures market, the December gold contract also saw a similar pressure, losing 45 USD and settling at 3,672 USD/ounce.
Reasons for the Decline:
The primary cause of the drop was the pressure from profit-taking after gold reached a 14-year high on 17th September. Additionally, the Federal Reserve’s decision to cut interest rates by 25 basis points, rather than the 50 basis points expected by some investors, disappointed the market and triggered a sell-off. Although the reduction was anticipated, the failure to meet expectations dampened market sentiment.
Furthermore, the recovery of the US Dollar in the previous session put additional pressure on the precious metal. As the greenback strengthened, gold became less attractive to investors holding other currencies, significantly weakening buying interest.
Short-Term Outlook:
Despite the pressure for a correction, the uptrend remains intact as long as the price stays above the important support level of 3,640 USD. As long as this level holds, gold could rebound and target 3,700 USD, potentially moving higher.
An important point to note is that the flow of funds continues to favour gold as a safe haven, despite the lukewarm reaction to the Fed’s decision. Coupled with global financial uncertainties, technical factors like FVG and strong trading volume reinforce the potential for a breakout if the price stabilizes above support.
Overall, with favourable macroeconomic conditions and the US Dollar stabilising, gold’s upside potential remains intact in the near term.
What’s your take on gold’s next move? Will it push through $3,700, or could we see another deeper correction? Share your thoughts below!

GOLD (XAUUSD): Updated Support & Resistance Analysis
Here is my latest structure analysis for Gold.
Resistance 1: 3798 - 3802 area
Resistance 2: 3848 - 3852 area
Support 1: 3690 - 3707 area
Support 2: 3613 - 3643 area
Support 3: 3560 - 3580 area
Support 4: 3511 - 3532 area
Consider these structures for pullback/breakout trading.
❤️Please, support my work with like, thank you!❤️
I am part of Trade Nation's Influencer program and receive a monthly fee for using their TradingView charts in my analysis.
