#8792025 |XAUUSD Selling opportunity 1:20 XAUUSD Selling opportunity Appears in H4 Time Frame Looking Price Action for Long Term Sell
Risk and Reward Ratio is 1:20
After 50 pips Profit Set SL Entry Level
"DISCLAIMER" Trading & investing business is "Very Profitable" as well as risky, so any trading or investment decision should be made after Consultation with Certified & Regulated Investment Advisors, by Carefully Considering your Financial Situation.
GOLDCFD trade ideas

XAU / USD 1 Hour ChartHello traders. Gold is on it's own trajectory. I am watching the current 1 hour candle to see if it respects the bottom of the previous hour's candle. Personally, I need a good pullback for a good entry. Let's see if the Pre NY volume, which starts in about half an hour from this writing, moves gold down to take out the existing longs in profit from the overnight sessions. Patience is key. Big G gets my thanks. Let's see how things play out over the next hour or so. Be well and trade the trend.

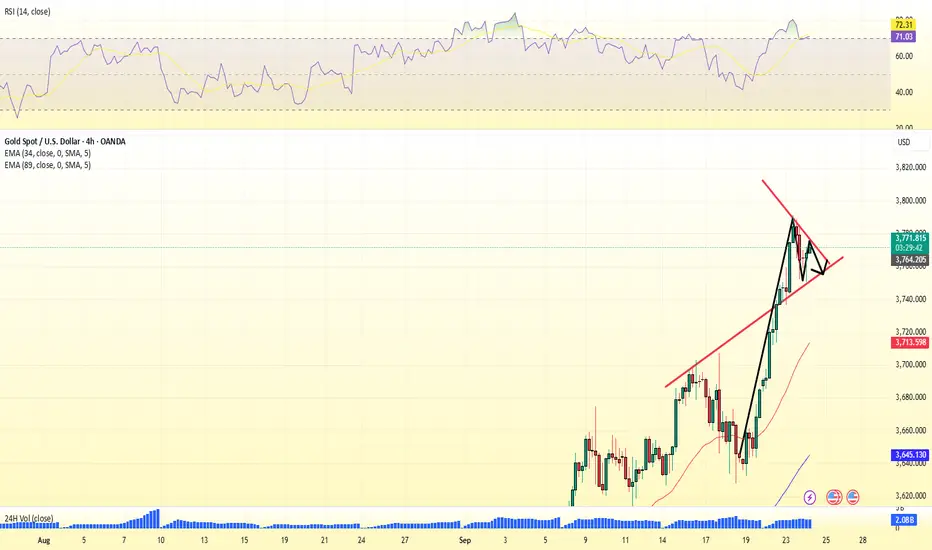
XAUUSD Very aggressive Bullish Leg started.Gold (XAUUSD) is on a remarkable bounce just after marginally breaking below the 4H MA50 (blue trend-line) and reaching the bottom of the 1-month Channel Up, which is technically the new Bullish Leg of the pattern.
The previous one extended all the way to +10.65% (which gives us a $4000 long-term Target) before the 4H RSI started to decline on Lower Highs, which on a sidenote gave us the bullish confirmation required when the RSI broke above them today.
On the short-term however, we are looking for a much more plausible Target at $3800, which has been the standard mini-rally sequence that this Channel Up has offered.
-------------------------------------------------------------------------------
** Please LIKE 👍, FOLLOW ✅, SHARE 🙌 and COMMENT ✍ if you enjoy this idea! Also share your ideas and charts in the comments section below! This is best way to keep it relevant, support us, keep the content here free and allow the idea to reach as many people as possible. **
-------------------------------------------------------------------------------
💸💸💸💸💸💸
👇 👇 👇 👇 👇 👇

Sept 25, 2025 - XAUUSD GOLD Analysis and Potential Opportunity📊 Analysis:
Last night, price dropped to a low of 3717.5 before quickly rebounding to 3752. Currently, bullish momentum is weakening while bearish pressure is starting to show.
If price holds above 3752, bulls still have room to extend higher → buy pullbacks into support.
If price breaks below 3736.5, a short-term downside channel may open.
🔍 Key Levels to Watch:
• 3772 – Resistance
• 3765 – Resistance
• 3759 – Resistance
• 3750–3752 – Key resistance zone
• 3745 – Resistance
• 3736.5 – Support
• 3728 – Support
• 3717.5 – Yesterday’s low
• 3708–3712 – Support zone
• 3700 – Psychological level
📈 Intraday Strategy:
SELL: If price breaks below 3736.5 → target 3732, with further downside toward 3728, 3723, 3718
BUY: If price holds above 3745 → target 3750, with further upside toward 3752, 3759, 3765
👉 If you find this helpful or traded using this plan, a like 👍 would mean a lot and keep me motivated. Thanks for the support!
⚠️ Disclaimer: This is my personal view, not financial advice. Always use proper risk control.

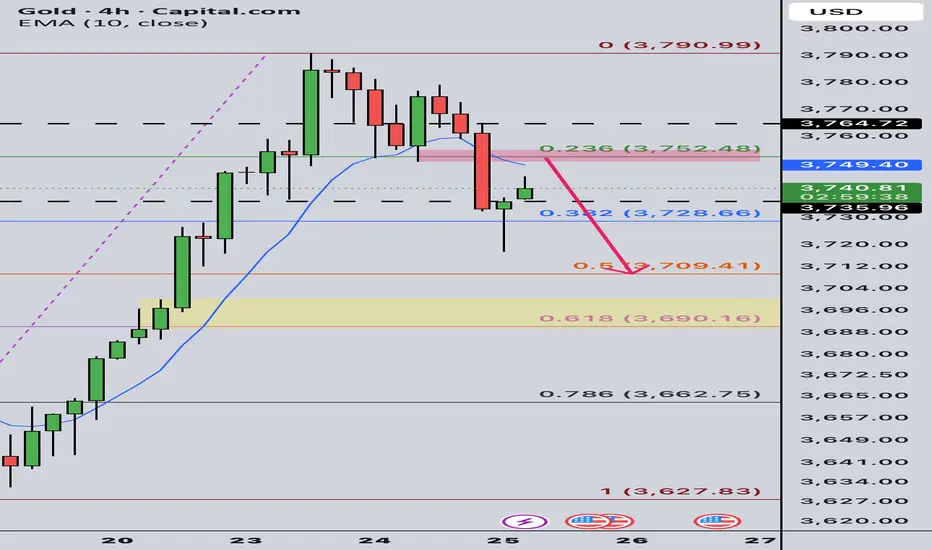
Gold Intraday Trading Plan 9/25/2025Gold indeed dropped from my selling zone and went as low as 3720 yesterday. I am still looking to sell from 3752 today. My 1st target is 3710. Ultimate target is 3690.
ANFIBO | XAUUSD - next ATH ??? [09.23.2025]Sorry guys, I'm very busy today so I can't share my views in detail. I will share my trading plan first, then update the details later ;)
Here's my OANDA:XAUUSD plan today:
>>> BUY ZONES:
ENTRY: 3715 - 3720
SL: 3710
TP: 3740 - 3760 - 3770 - 3800
>>> SELL ZONES:
ENTRY: 3800 - 3795
SL: 3805
TP: 3760 - 3730
GOODLUCK GUYS!!!

GOLD | Pullback from 3750 Resistance to 3710–3720 Support Ahead Gold is expected to show short-term moves before tomorrow’s key 13:30 data release:
First, a potential rise toward 3750 resistance,
Followed by a pullback into the 3710–3720 support zone.
The ability to hold or break this support will largely depend on the upcoming data.
📌 A sustained break above 3750 could signal further bullish momentum.
📌 A breakdown below 3710–3720 would increase bearish pressure.

XAUUSD--LONG--Bullish bias.
--tp and entry levels are as shown on chart
--for big picture check the weekly chart I published before. (I added below)

GOLD (XAUUSD): Updated Support & Resistance Analysis
Here is my latest structure analysis for Gold.
Resistance 1: 3798 - 3802 area
Resistance 2: 3848 - 3852 area
Support 1: 3690 - 3707 area
Support 2: 3613 - 3643 area
Support 3: 3560 - 3580 area
Support 4: 3511 - 3532 area
Consider these structures for pullback/breakout trading.
❤️Please, support my work with like, thank you!❤️
I am part of Trade Nation's Influencer program and receive a monthly fee for using their TradingView charts in my analysis.

Buy zone and hold for next rallyBuy if see absorption on 3,718 or after sweep 3,712 we can long and hold for next rally pls long with confirmation like absorption selling trap etc. it's not a correction,just normal pullback

GOLD Double Top Rejection On H1We finally have a strong confirmation for shorting gold. But we need to wait for this H1 double top rejection to finish with the retest before we start committing to sells.
All the zones I have highlighted are potential TP zones for when price moves to the downside.
I will be sending updates on this trade idea on LTFs.

Is XAUUSD Setting for drop?there is reversal patter on GOLD with potenial previous daily support to break. Market may continue to drop to fill the dialy fair value gap followed by 4h fair value gap may lead the price to continue to drop to support level.


Another push higher! See you at 3800!Go long at 3710
Gold continues to hit new all-time highs. There's no such thing as a high, only higher. Two horizontal and one vertical bars mean action, it's that simple.
Currently, the bottom is showing a strong upward trend, crushing any resistance. Two large bullish candlesticks on the daily chart have directly broken through the ceiling, and the moving average has been pulled vertically higher, taking off straight from the spot. Go long, go long at 3610.

GOLD: Bullish Continuation & Long Signal
GOLD
- Classic bullish setup
- Our team expects bullish continuation
SUGGESTED TRADE:
Swing Trade
Long GOLD
Entry Point - 3756.7
Stop Loss - 3751.5
Take Profit - 3768.4
Our Risk - 1%
Start protection of your profits from lower levels
Disclosure: I am part of Trade Nation's Influencer program and receive a monthly fee for using their TradingView charts in my analysis.
❤️ Please, support our work with like & comment! ❤️


Gold on the Edge of a Breakout or a Sharp Pullback?🔎 Technical Analysis
Main Trend:
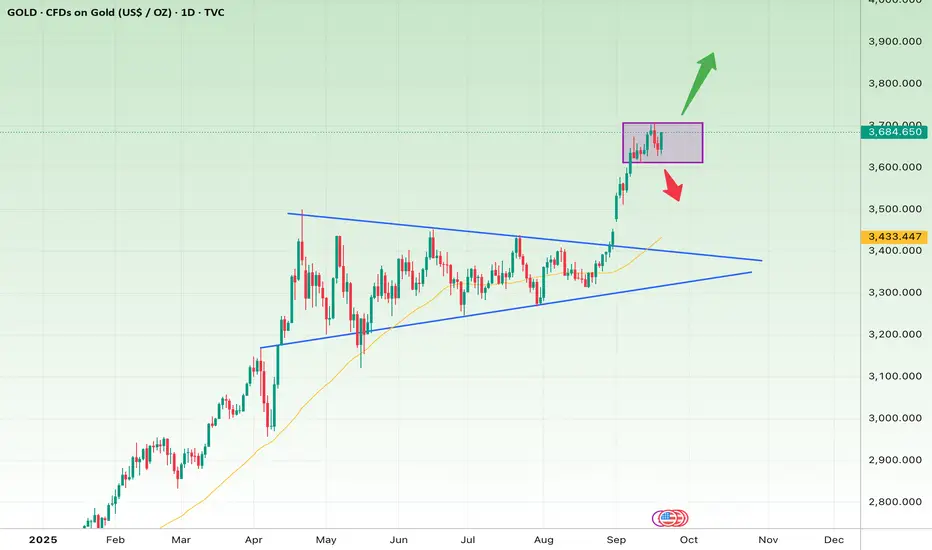
Since early 2025, gold has been in a strong uptrend. The breakout from the symmetrical triangle in September was decisive, with strong momentum, pushing the price quickly above $3,600.
Current Situation:
Price is now consolidating in a range box ($3,630–$3,700). This is a healthy pause after the sharp rally, serving as an accumulation zone before the next major move.
Indicators & Signals:
The 50-day MA (yellow) is acting as dynamic support.
Bullish candles are larger and more frequent than bearish ones → buyers remain in control.
However, a short-term pullback to retest lower supports is still possible.
📈 Short-Term Outlook (1–3 weeks)
Bullish Scenario (more likely):
A breakout above $3,700 could fuel another rally toward $3,780 – $3,850.
Stop-loss: Close below $3,620.
Bearish Scenario (less likely):
A breakdown below $3,620 could trigger a correction down to $3,480 – $3,430 (confluence with the 50-day MA and the broken triangle top).
Stop-loss for shorts: Above $3,700.
📊 Long-Term Outlook (2–4 months)
The overall structure remains bullish, with the triangle breakout still in play.
As long as price holds above $3,430, the long-term uptrend is intact.
Key targets:
First target: $3,900 (psychological level)
Second target: $4,200 (technical projection from the triangle pattern)
Long-term stop-loss: A sustained close below $3,300 would invalidate the bullish outlook.
✅ Summary:
Short-term: The key level is $3,700. A breakout above confirms continuation, while a drop below $3,620 signals a correction.
Long-term: Trend is bullish as long as price stays above $3,430, with $4,200 as a realistic upside target.
XAUUSDHello Traders! 👋
What are your thoughts on GOLD?
Gold pulled back after printing a fresh high and reacting to the latest FOMC meeting. It has since broken below key support and also violated its ascending trendline.
In the short term, price action is expected to remain range-bound to bearish, heading toward the next support zone.
As long as price remains below the broken trendline and resistance, the short-term bias stays bearish to sideways.
However, in the medium term, the overall outlook remains bullish, and a fresh upside wave may develop once the correction is completed.
Don’t forget to like and share your thoughts in the comments! ❤️

Gold Long Setup: Tight Stop, 29x Risk/Reward#DayTrading #Gold
TVC:GOLD trade with a tight stop loss. Risk/Reward 29. I ignored gold’s uptrend for a while but decided to try a long position with a short stop loss. Looking at the 6-month chart, there’s still room to climb.
Entry: $3,642
Stop Loss: $3,609
First Take Profit: $4,600
Risk/Reward: 29.03
Chart:

PHYSICAL GOLD vs 'DIGITAL ONE'. WHICH WAY YOU GOTTA GO RNCreating custom formulas can put price action into different perspectives. You can think of the search bar on TradingView like a calculator.
This chart, for example, shows XAUUSDK - BTCUSD i.e. the difference in prices of one Kilo of Gold FX_IDC:XAUUSDK and 1 BTC coin BITSTAMP:BTCUSD . But we could have expressed many different formulas including: (PLTR + GLD)*2 or TSLA + F + GM and even AAPL^10 🤭
There are countless ways to create equations on TradingView. To get started, type the equation you want to chart into the search bar. When you're ready, press Enter, and the chart will appear.
The chart we created shows XAUUSDK-BTCUSD and it paints a picture about low-volatility 1 kilo Gold bar performance compared to 1 BTC 'digital gold' performance (high-volatility, rising or spiking, back-and-forth movements).
The channel on the chart demonstrate that the current difference has been tested several times before in the past, all the time around neutral zero-level.
Well.. since the difference rn is where it's been 5 years ago... you can clearly see that high volatility and risk does not nessesary bring ypur portfolio to higher return versus low volatility Gold spot.
Of course, this is not a recommendation or a signal of any sort. Instead, we are hoping to demonstrate the creativity you can use when building an equation. You can create formulas across all asset classes.
💪 Thanks for reading and please let us know your thoughts in the comments. Press like if you enjoyed this post, then vote in comment box which way you gotta go:
A. Mostly Bullish. Physical Gold prevails.
B. Mostly Bearish. 'Digital Gold' advanced.
C. Range/ Sideways in short to mid-term.
--
Best wishes,
@PandorraResearch Team

GOLD USD WEEKLYHI GUYS,
here we have gold usd weekly structure. i expect sells around the levels illustrated in the picture above.

FED Chairman satisfied with current FED policy directionThe Fed Chairman is satisfied with the current policy direction of the Fed, while leaving open the possibility of further interest rate cuts if the FOMC deems it necessary to support the economy.
Mr. Powell assessed that the worsening employment situation has changed the balance of risks in achieving the Fed's goals.
On the other hand, the current policy stance is still tightening, giving the Fed enough room to respond to potential economic developments.
Despite the slowing growth, gold prices are still receiving support from many factors. Commerzbank said in a note that strong buying from ETF investors - fueled by expectations of interest rate cuts, concerns about the independence of the Fed and geopolitical developments - could also boost gold prices.
World gold prices received support as the People's Bank of China continued to buy gold regularly, despite the sharp increase in prices. According to the assessment of Société Générale Bank (France), China will still be the "dominant player" in the gold market for many years to come, despite high prices that may further limit purchasing power.v
GOLD Technical & Order Flow AnalysisOur analysis is based on a multi-timeframe top-down approach and fundamental analysis.
Based on our assessment, the price is expected to return to the monthly level.
DISCLAIMER: This analysis may change at any time without notice and is solely intended to assist traders in making independent investment decisions. Please note that this is a prediction, and I have no obligation to act on it, nor should you.
Please support our analysis with a boost or comment!
