Gold Continues Its Explosive Run👋Hello everyone, what do you think about OANDA:XAUUSD ?
After a strong breakout last month, gold opened this week at a new record, marking the fifth consecutive week of historic highs by surpassing $3,800, and the upward momentum shows no signs of stopping. As of now, the precious metal has gained over 550 pips, an impressive figure.
A recent survey shows that most analysts and investors remain optimistic about gold’s price outlook. In an online Main Street poll with 265 participants, 166 (63%) predicted further price increases, 56 (21%) expected a decline, and 43 (16%) anticipated stable prices.
This week, the gold market is awaiting key data, including US consumer confidence (Tuesday), ADP Non-Farm Employment & ISM Manufacturing PMI (Wednesday), weekly jobless claims (Thursday), and US Non-Farm Payrolls & ISM Services PMI (Friday). These releases are likely to guide the next moves for gold, so stay tuned.
Personally, I remain bullish. What about you? What’s your take on XAUUSD? 💬Share your thoughts in the comments!
GOLDCFD trade ideas

XAUUSD 2025: Recalibrate Your Thinking or You Won’t SurviveThesis: If you don’t recalibrate your volatility expectations for Gold, you won’t survive this market. What felt like a “big move” in 2021 is just noise in 2025.
________________________________________
1) Context: What Actually Happened (2020 → 2025)
• 2020–2023: Gold largely oscillated in a broad range around the $1,700–$2,000 handles (with occasional spikes beyond). Many traders anchored their risk and target expectations to this regime.
• March–April 2024: A decisive breakout to fresh all-time highs shifted the regime from compression to expansion.
• Late August 2025: Price broke out of a symmetrical triangle around the ~3330 zone and then advanced near-vertically into late September, ushering in a burst of exceptional volatility.
Bottom line: The market transitioned from a four-year consolidation into a powerful expansion phase. Your playbook must evolve accordingly.
________________________________________
2) Volatility Math: Same %, Bigger Dollars → Bigger “Pips”
Many retail platforms quote XAUUSD so that 1 pip ≈ $0.10. Using that convention:
• In the $1,900–$2,000 environment, a 2% move ≈ $38–$40 → 380–400 pips.
• At $3,300–$3,800, the same 2% ≈ $66–$76 → 660–760 pips.
So those “300–400 pip moves” you treated as significant in 2021 or2022 are structurally too small for 2025.
In expansion phases, 1,000+ pip swings are perfectly normal.
Key takeaway: If price doubles, absolute fluctuations for the same percentage move roughly double too. Stop using yesterday’s pip yardstick.
________________________________________
3) Why Recalibration Matters
The market is not static. Traders who survive across cycles are those who adapt to new volatility regimes. Anchoring to outdated benchmarks—whether in pips, percentage moves, or psychological comfort zones—leads to poor decisions.
It is not enough to have a strategy. You need the right frame of reference for volatility, risk, and expectations.
A system built for a $1,800 gold market cannot simply be copied and pasted into a $3,500 gold market without adjustment.
________________________________________
4) The Psychological Shift
Recalibration is not only technical but also mental:
• Old anchors: What once felt like a big move is now an intraday fluctuation.
• Risk perception: A number that once signaled danger may now be just routine volatility.
• Flexibility: The willingness to redefine “normal” is the mark of a trader who lasts.
This is not abstract theory. For example, I started writing this article when Gold was trading at 3860. By the time I reached this paragraph, price had already dropped to 3815, after making a low at 3810—an almost 700-pip drop from today’s all-time high in just three hours.
By the time you read this, it may be trading at a completely different level. That’s the reality of expansion volatility.
And here’s the perspective shift: these days, being happy about booking 100 pips on Gold is like being happy for 10 pips on EURUSD. It’s not that 100 pips don’t matter—it’s that the scale of the game has changed, and your mindset must change with it.
________________________________________
5) Moving Forward
Your survival depends on continuous mental updates. Understand that volatility is relative to price, that regimes change, and that clinging to old measures is a recipe for losses. General principles—risk discipline, patience, and adaptability—remain constant, but their practical application shifts with the environment.
Recalibrate, or the market will do it for you.

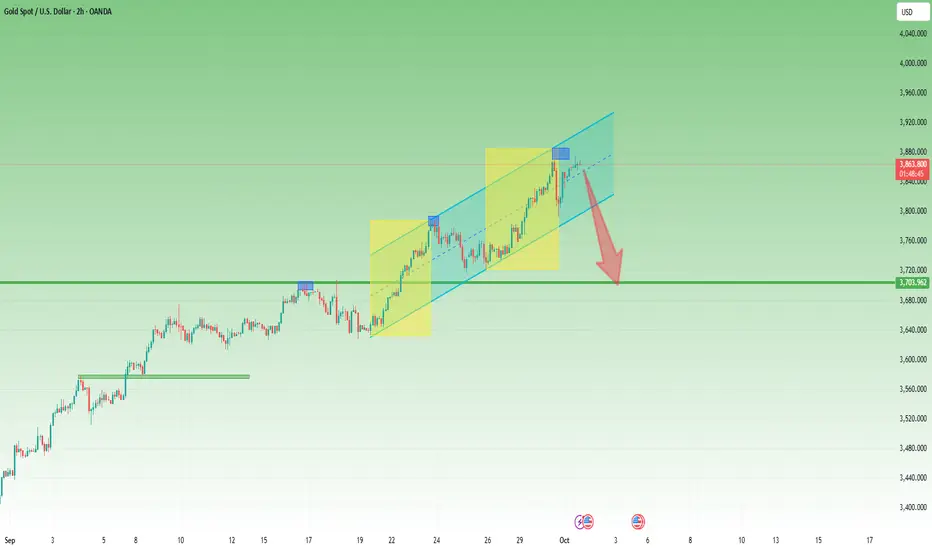
3830: The Line Between Bullish Control and a Waterfall Drop1. Recap of Yesterday’s Key Move
Yesterday was a decisive day for Gold traders, and it perfectly confirmed what I have been pointing out since Monday: at these elevated levels, Gold is extremely vulnerable.
After printing yet another All-Time High overnight, the yellow metal sold off aggressively for nearly 5 hours straight, with losses amounting to almost 800 pips.
Importantly, the bounce came exactly from the 23 September ATH level and by the end of the session, bulls managed to step in and regain control.
________________________________________
2. Overnight Price Action
Overnight, the asian session was once again bullish – Gold reached a fresh ATH at 3875, only to retreat slightly, which for now can be classified as nothing more than a shallow correction.
Despite the recovery, what matters is not the new high, but the fragility revealed during yesterday’s sell-off. Momentum looks stretched, and price action confirms the market’s increasing instability.
________________________________________
3. Technical Outlook
From a structural point of view:
• Price is still contained within the upper bullish channel.
• Bulls have also managed to reclaim the median line, suggesting they are still in control.
• However, the 800-pip collapse proved that even in such a strong uptrend, cracks are starting to show.
Key levels to watch:
• 3830 → if this level breaks, the market could trigger a waterfall of selling.
• 3785-3790 → support that held before, but I believe this time it won’t survive.
• 3700 → the logical corrective target if 3780 is breached.
________________________________________
4. Trading Mindset & Strategy
Yesterday, I couldn’t sell into the initial drop — and that’s fine. Such a move was more about timing luck than pure skill. No frustration, because the analysis was right: fragility is here.
From now on, my plan is clear:
• I’ll be looking for structured patterns with larger targets.
• Minimum: +1000 pips setups.
• Stretch target: +1500 pips.
________________________________________
5. Conclusion
Gold remains in bullish mode on the surface, but yesterday’s sell-off clearly revealed how fragile and overstretched the trend has become.
If 3830 fails, that could be the decisive moment when bulls finally lose control and the long-awaited correction accelerates.
Until then, I will stay patient and disciplined, waiting for the market to provide a clean pattern with a strong risk/reward setup. 🚀
GOLD (XAU/USD): Trend Following TradingIt appears that the price of 📈GOLD has completed a correctional phase following a strong bullish trend.
The price has shown good respect for a significant intraday horizontal support level, subsequently establishing a cup and handle pattern.
The breakout above the neckline, accompanied by a strong imbalance candle, offers substantial confirmation of a bullish trend continuation.
Therefore, an increase to 3770 - 3785 is anticipated.

GOLD 4H CHART ROUTE MAP UPDATEHey Everyone,
Quick follow-up on yesterday’s 4H chart setup.
We successfully hit 3 of our projected targets and are currently consolidating within the 3778–3738 range. The bounce from the 3738 support zone (Goldturn) played out exactly as anticipated, providing solid entries.
Next phase: we’ll monitor for a EMA5 cross and lock above/below either boundary to define the next actionable trading range.
We will continue to buy dips using our support levels taking 20 to 40 pips. As stated before each of our level structures give 20 to 40 pip bounces, which is enough for a nice entry and exit. If you back test the levels we shared every week for the past 24 months, you can see how effectively they were used to trade with or against short/mid term swings and trends.
The swing range give bigger bounces then our weighted levels that's the difference between weighted levels and swing ranges.
BULLISH TARGET
3696 - DONE
EMA5 CROSS AND LOCK ABOVE 3696 WILL OPEN THE FOLLOWING BULLISH TARGETS
3738 - DONE
EMA5 CROSS AND LOCK ABOVE 3738 WILL OPEN THE FOLLOWING BULLISH TARGET
3778 - DONE
EMA5 CROSS AND LOCK ABOVE 3778 WILL OPEN THE FOLLOWING BULLISH TARGET
3811 -
EMA5 CROSS AND LOCK ABOVE 3811 WILL OPEN THE FOLLOWING BULLISH TARGET
3845
BEARISH TARGETS
3655
EMA5 CROSS AND LOCK BELOW 3655 WILL OPEN THE FOLLOWING BEARISH TARGET
3615
EMA5 CROSS AND LOCK BELOW 3615 WILL OPEN THE FOLLOWING BEARISH TARGET
3583
EMA5 CROSS AND LOCK BELOW 3583 WILL OPEN THE SWING RANGE
3546
3509
EMA5 CROSS AND LOCK BELOW 3509 WILL OPEN THE SECONDARY SWING RANGE
3458
3409
As always, we will keep you all updated with regular updates throughout the week and how we manage the active ideas and setups. Thank you all for your likes, comments and follows, we really appreciate it!
Mr Gold
GoldViewFX

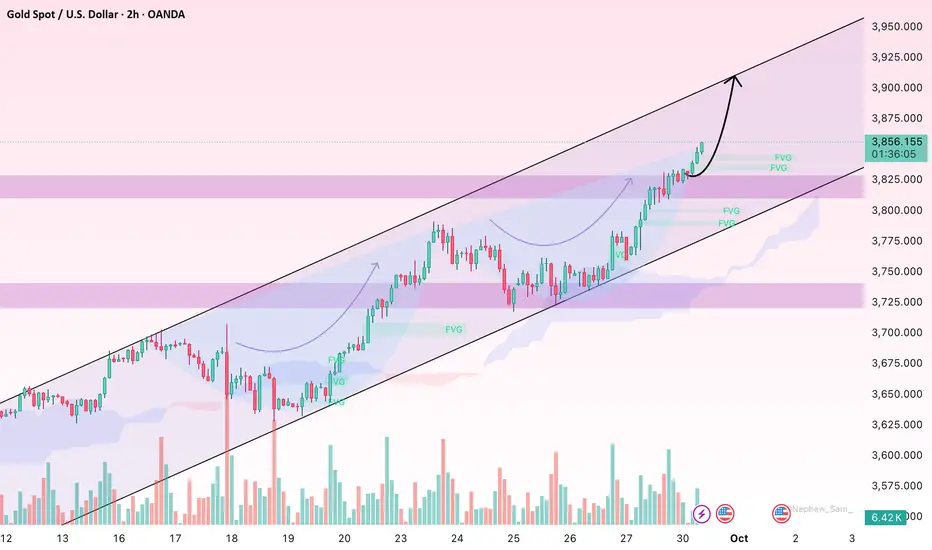
Gold Surges to 14-Year High Amid US Government Shutdown RiskHello everyone,
Gold extended its rally today, reaching its highest level in 14 years as safe-haven demand soared. The main driver comes from political uncertainty in the US, particularly the looming risk of a government shutdown as Congress struggles to pass a short-term spending bill.
From a technical perspective, gold has broken out of its FVG zone and is approaching the 3,850–3,870 USD resistance area, which now stands as the critical barrier. A decisive break above could open the door toward 3,900 USD or higher. On the downside, the 3,815–3,790 USD range (green FVG) is serving as dynamic support and a cushion for the ongoing bullish momentum.
News flow remains the dominant catalyst. The US budget standoff and shutdown fears raise concerns about disruptions in federal services and the broader economy, prompting investors to flock to gold. At the same time, the dollar is under pressure due to political instability, while weaker US 10-year bond yields and falling oil prices further strengthen the precious metal’s bullish backdrop.
What do you think about gold’s next move? Share your view in the comments!
Gold 30Min Engaged ( Bullish Reversal Entry Detected )Time Frame: 30-Minute Warfare
Entry Protocol: Only after volume-verified breakout
🩸Bullish Reversal - 3784 zone
➗ Hanzo Protocol: Volume-Tiered Entry Authority
➕ Zone Activated: Dynamic market pressure detected.
The level isn’t just price — it’s a memory of where they moved size.
Volume is rising beneath the surface — not noise, but preparation.
🔥 Tactical Note:
We wait for the energy signature — when volume betrays intention.
The trap gets set. The weak follow. We execute.
Gold Roadmap| Short-termGold ( OANDA:XAUUSD ) has been surprising everyone in the last few weeks, making new All-Time Highs(ATHs) every day.
Let me start by saying that this is a short-term analysis on a 15-minute time frame .
Technical analysis generally works worse when assets are creating ATHs . One reason for this is that there is no past history .
Gold has started to correct after the formation of the last All-Time High(ATH=$3,791.55) .
In terms of Elliott Wave theory , given the bullish momentum of Gold , it seems that the main wave 3 has been completed, and we should wait for the main wave 4 . It seems that the main wave 4 can be completed with a Zigzag Correction(5-3-5) .
I expect Gold to continue its downward trend to the Support zone($3,738-$3,723) , and then if we find a trigger for a Long position , we can ride the bullish wave of Gold again .
Note: If the Resistance lines are broken, we can expect a new All-Time High.
Note: If the Support zone($3,738-$3,723) is broken, we can expect a deeper correction.
Please respect each other's ideas and express them politely if you agree or disagree.
Gold Analyze (XAUUSD), 15-minute time frame.
Be sure to follow the updated ideas.
Do not forget to put a Stop loss for your positions (For every position you want to open).
Please follow your strategy; this is just my idea, and I will gladly see your ideas in this post.
Please do not forget the ✅ ' like ' ✅ button 🙏😊 & Share it with your friends; thanks, and Trade safe.

GOLD (XAU/USD): Time for Pullback!?Regarding the recent developments on the Gold market, a potential cup and handle pattern has been identified on the 4-hour timeframe.
As per our established strategy, a definitive bearish signal will be confirmed upon a breakout below the pattern's neckline.
whereas a 4-hour candle closing below 3750 would validate a significant bearish correction.

DeGRAM | GOLD near the $3900 level📊 Technical Analysis
● XAU/USD is moving inside a rising channel but just touched resistance near 3,900, forming rejection candles that hint at exhaustion.
● Structure shows potential double-top behavior with projected pullback toward 3,855 and possibly 3,800 if channel midline breaks.
💡 Fundamental Analysis
● Strong U.S. economic data and Fed hawkishness keep Treasury yields firm, limiting gold’s upside despite recent risk-off flows.
✨ Summary
● Short bias: resistance at 3,900 rejected, downside targets 3,855 and 3,800. Pressure from U.S. macro resilience supports a corrective move lower.
-------------------
Share your opinion in the comments and support the idea with a like. Thanks for your support!

Is XAUUSD Facing Strong Downward Pressure?With recent economic developments, XAUUSD is currently under pressure to decline . Let’s take a closer look at the current trend of gold.
Based on the latest news regarding GDP, unemployment claims, and the PCE index , XAUUSD is facing downward pressure. The US GDP is stable but not overly impressive, unemployment claims came in at 233K, higher than the previous 231K , indicating a more stable economy. Additionally, a lower-than-expected PCE index may lead to expectations that the Fed will continue tightening its monetary policy.
From a technical perspective, XAUUSD is moving within an uptrend channel but has recently hit resistance at $3,750 and is showing signs of correction. The price is now testing the support level at $3,680. If this support level is broken, gold may experience a sharp decline towards lower levels.
Considering both the fundamental and technical factors , the likelihood of XAUUSD continuing to decline is high. However, we need to closely monitor upcoming economic data as it could change the market’s direction .

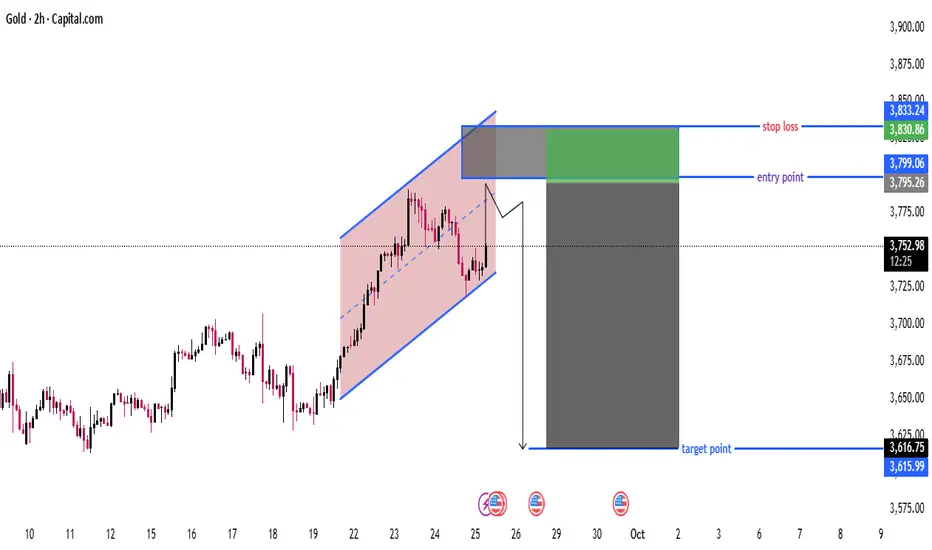
Gold 2H – Bearish Channel Breakdown SetupChart Overview
This chart shows a bearish setup for Gold, suggesting a short (sell) trade with the following key components:
🔵 Channel Analysis
Rising Parallel Channel: Price has been moving within an ascending channel (pink shaded area), indicating a short-term uptrend.
The recent candle breaks or touches the lower boundary of this channel, hinting at a potential breakdown.
📉 Trade Setup
This looks like a short (sell) trade idea based on a potential breakout to the downside.
Component Level Details
Entry Point 3,799.06 Entry zone marked in green; at/near the lower trendline of the ascending channel
Stop Loss 3,833.24 Just above the recent highs and the channel top
Target Point 3,616.75–3,615.99 Target area marked in blue; aligns with a prior support zone
✅ Trade Logic
Bearish Bias: Price action shows weakening momentum near the top of the channel.
Breakdown Expected: Entry assumes a breakdown of the ascending channel.
Risk-Reward Ratio (RRR): Very favorable — large potential move down compared to the stop loss range.
📊 Risk Management
Stop Loss: Properly placed above resistance zone — protects against false breakouts.
Target Zone: Based on historical support/resistance structure.
RRR Estimate: Approx. 1:5+, which is excellent if the move materializes.
⚠️ Potential Risks
False Breakout: Price could rebound back into the channel, invalidating the bearish thesis.
Fundamental Triggers: Gold is sensitive to macroeconomic news (e.g., interest rate changes, geopolitical tension, inflation data).
📌 Summary
This is a well-structured short trade setup based on a rising channel breakdown.
With a clear entry, stop loss, and profit target, it presents a high-reward, controlled-risk opportunity.
Best confirmed with:
Bearish candlestick confirmation at the entry point
Volume spike on breakdown
Fundamental catalysts supporting gold weakness
GOLD surpasses historical peak - waiting for boost from NFPNews of the past week: OANDA:XAUUSD approaches historical peak, benefits from US tariffs and geopolitical tensions
• In the trading session on September 26, the spot gold price surpassed the $3,760/ounce mark and fluctuated around $3,780, just a short distance from the historical peak of $3,791 set earlier this week. This is also the sixth consecutive week of increase for the precious metal, thanks to increased demand for safe havens in the context of new US tariffs and escalating geopolitical tensions.
• The August personal consumption expenditures (PCE) inflation report contained few surprises: Core PCE rose 0.2% month-over-month, in line with forecasts and below July's initial 0.3% reading (which was later revised down). Year-over-year, core PCE held steady at 2.9%, still above the Fed's 2% target. Total PCE rose 0.3% month-over-month, up from July's 0.2% reading; year-over-year, it edged up to 2.7% from 2.6%.
• This inflationary trend has weakened the US dollar, providing additional support for gold prices. However, the Fed’s monetary policy picture remains cautious. After cutting interest rates by 25 basis points last week, many Fed officials have stressed that there is no need to rush to ease further as price pressures persist despite signs of a slowdown in the labor market.
• Meanwhile, U.S. economic data released on Thursday, including stronger-than-expected second-quarter GDP growth and lower jobless claims, added to the Fed’s concerns, potentially complicating the path to rate cuts, while gold continues to benefit from haven demand and a fraught political and trade environment.
This week: Global markets await US jobs data and signals from the Fed
• From September 29 to October 4, global financial markets will be watching the speeches of US Federal Reserve (Fed) officials after the September interest rate cut. The biggest highlight is the non-farm payroll (NFP) report released on Friday, a factor that could shape the interest rate path at the Fed's meeting in late October.
• At the start of the week, the Eurozone will release a series of data on economic sentiment, consumer confidence and industrial climate, important indicators to check the possibility of escaping the risk of stagflation. On Tuesday, Australia decides on its benchmark interest rate, Japan publishes its policy summary, while China releases its manufacturing PMI. Germany also releases CPI and retail sales on the same day. In the US, Chicago PMI and JOLTs employment data will be released, along with a series of speeches from regional Fed presidents, where views on interest rate cuts are clearly divided.
• Wednesday will see the US ADP jobs report and the Eurozone harmonized CPI, which are key data for ECB policy. In addition, the final PMIs from the Eurozone, Germany, France and the UK will be released. The Fed continues its series of speeches, including from the Vice Chairman, which will further focus the market on the employment-inflation balance.
• The climax comes on Friday when the US releases its September non-farm payrolls. If the data is weaker than expected, the chances of the Fed cutting interest rates by another 25 basis points in October will increase, weakening the USD and supporting gold prices. Conversely, strong data could reverse expectations and strengthen the greenback. On the same day, Japan releases its unemployment rate, adding to the currency market.
• Overall, this week is a clash of economic data and policy guidance. NFP will be a key measure to break the Fed’s current balance, while European and Japanese data reflect global policy divergence. For investors, gold and the US dollar are likely to be volatile, while crude oil will be influenced by inventory data and Chinese PMIs.
Technical Outlook Analysis OANDA:XAUUSD
Summary: Gold on the daily chart is running in a clear uptrend channel, buyers are still in control but need to pay attention to the accumulation phase and high RSI before entering orders.
Technical perspective
• Main trend: Strong increase — price is fluctuating in a clear uptrend channel, tops/cores/bottoms are all making lower and higher lows → bullish structure is intact.
• Moving average (MA): Short-term MA is pointing up, price is above MA → confirms the uptrend and MA acts as dynamic support when there is a pullback.
• Key support: ~3,720–3,738 USD/oz (near support/lower consolidation band); stronger support around 3,629–3,630 (previous bottom).
• Technical resistance/target: immediate resistance ~3,791 USD (recent top). Fibonacci targets if broken: 3,825 (0.5) → 3,872 (0.618) → 3,938 (0.786) → extension to ~4,022 (extension).
• RSI & momentum: RSI is in high territory but not yet giving strong reversal signals — momentum remains positive but warns of technical correction risk.
Risk management tips & signals to watch
• Split orders, don't go all-in; limit risk to 1–2% of account per order.
• Monitor RSI: if you see a negative Divergence + a strong bearish candle closing below the lower channel boundary, postpone the Buy.
• Macro news (PCE, NFP, Fed speech) can create a strong gap, it is best to use Stop Trading around those events.
• If it breaks below 3,630 with high Volume, the Bullish Scenario is null, need to switch to capital preservation.
Basic scenario: still prioritize long because of the bullish structure and MA support. However, smart Trades buy with a plan, have disciplined Stop, and don't forget: gold likes macro Drama, so keep a flexible mentality.
SELL XAUUSD PRICE 3813 - 3811⚡️
↠↠ Stop Loss 3817
→Take Profit 1 3805
↨
→Take Profit 2 3799
BUY XAUUSD PRICE 3753 - 3755⚡️
↠↠ Stop Loss 3749
→Take Profit 1 3761
↨
→Take Profit 2 3767

THE KOG REPORT - UpdateEnd of day update from us here at KOG:
Yesterday we published two levels of interest and the red box which needed to break for further upside. Although the price action was a little messy today, we managed to breach the level we wanted and complete most of our targets downside include our algo target on Excalibur.
Now, we have support here and below this 3720 which is a likely target and resistance above 3755 which could be a level for retracement! I would imagine, if 3750 holds us down on the red box, we may see this move further downside in attempt to break below the 3700 level. This needs to be monitored and we'll have to go level to level due to the move we've seen upside and there being now clean reversal on the longer time frames so far.
Price: 3670
RED BOXES:
Break above 3784 for 3790, 3794, 3804 and 3810 in extension of the move
Break below 3766 for 3755✅, 3750✅, 3739✅ and 3728✅ in extension of the move
As always, trade safe.
KOG

XAUUSD Long: Bullish Momentum ContinuesHello, traders! The prior price auction for XAUUSD was dominated by a wide consolidation range, from which the price broke out with significant bullish momentum. This breakout from the demand zone 2 established the current uptrend, which has since taken the form of a well-defined ascending channel, confirming that the market initiative is with the buyers.
Currently, the price action continues to be guided by this ascending channel. After a successful breakout above the demand level, the price has reached the upper portion of the channel and is now in a corrective phase. This pullback is a normal part of a healthy uptrend and is bringing the price back towards an area of potential support.
My scenario for the development of events is a continuation of the uptrend after this correction. I believe the price will find support, possibly after a brief dip, and then resume its rally within the channel. In my opinion, the underlying bullish momentum is strong enough to push for a new structural high. The take-profit is therefore set at 3785, targeting the upper resistance area of the channel. Manage your risk.

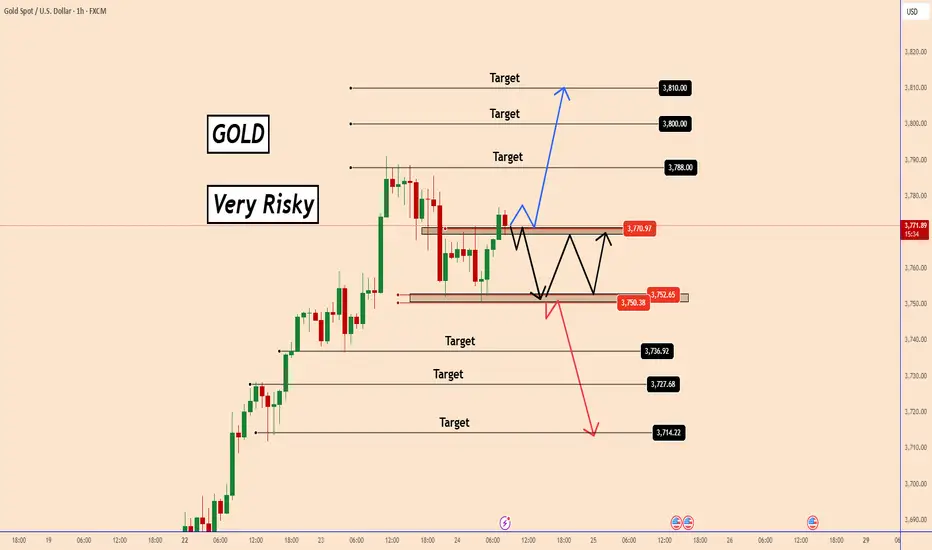
Gold Analysis – Key Levels in Play-Short-Term Structure AnalysisGold Analysis – Key Levels in Play-Short-Term Structure Analysis
Bullish Scenario (Blue Path):
If price holds above $3,770, buyers may push higher. Targets are:
$3,788
$3,800
$3,810
Bearish Scenario (Red Path):
If the price fails to stay above $3,770, it could fall to $3,752 as the first target.
If Gold breaks even below $3,752, sellers may take control. Next downside targets are:
$3,736
$3,727
$3,714
PS: For now, gold is bullish, and the blue scenario is in play.
You may find more details in the chart!
Thank you and Good Luck!
❤️PS: Please support with a like or comment if you find this analysis useful for your trading day❤️
#GOLD - #XAUUSD# Gold has reached an extreme resistance around the 1.618 Fib at $3,765, with RSI confirming overheated conditions. A likely scenario is a correction into $3,280 liquidity zone, possibly deeper toward $2,720 before resuming its bullish macro trend toward $3,800–$4,200.
In the Monthly Time Frame chart, you can observe a major resistance trend: it extends from the 2000 low to the 2012 high, and again from the late 2015 low to the 2012 high, projecting a strong resistance at the current price level.

'' Could We See 3800 This Week? ''As we can see we have an uptrend forming on gold, breaking 3750-3755 resistance level.
I think Monday will go on a retest for this support level and fly all the way up targeting (770-780-790-800)
This is just an idea for a trade, taking confirmation on lower time frame before entering it will be the best choice

XAU/USD | GOLD Breaking Records – $4K Target Loading…!By analyzing the TVC:GOLD chart on the 1-hour timeframe, we can see that nothing seems to be stopping its series of new record highs — it almost feels like the $4,000 target isn’t too far away! Every small correction in gold is simply gathering more liquidity and demand to push toward higher levels.
At this very moment, gold has printed a new ATH at $ 3,734 , and I expect the rally to continue. The next possible upside targets are $3,740, $3,780, and $3,800.
THE MAIN ANALYSIS :
Please support me with your likes and comments to motivate me to share more analysis with you and share your opinion about the possible trend of this chart with me !
Best Regards , Arman Shaban

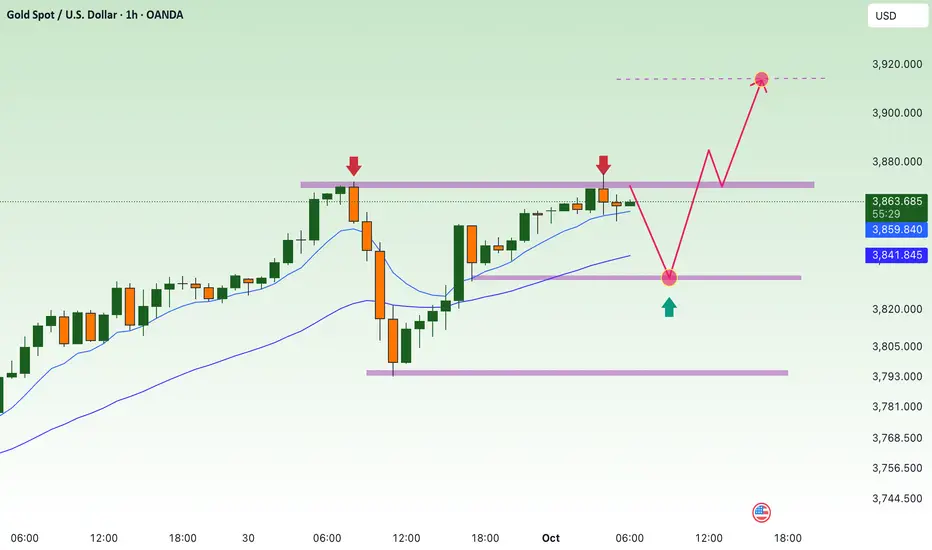
Bulls continue to increase prices, waiting for ATH 3915⭐️GOLDEN INFORMATION:
Markets, via the CME FedWatch Tool, now price in a 97% chance of a Fed rate cut in October and a 76% probability of another in December. Growing bets on easing pressured the US Dollar, making Gold more attractive to overseas buyers. Bullion also drew support from fears of a potential US government shutdown, with Washington gridlocked over funding and the Labor Department warning it would halt key data releases, including Friday’s jobs report, if a shutdown occurs.
⭐️Personal comments NOVA:
Gold price returns, continues to create new ATH 3875 in Asian session. Maintain buying power and continue the uptrend
⭐️SET UP GOLD PRICE:
🔥SELL GOLD zone: 3915- 3917 SL 3922
TP1: $3905
TP2: $3890
TP3: $3880
🔥BUY GOLD zone: $3833-$3831 SL $3826
TP1: $3845
TP2: $3860
TP3: $3870
⭐️Technical analysis:
Based on technical indicators EMA 34, EMA89 and support resistance areas to set up a reasonable BUY order.
⭐️NOTE:
Note: Nova wishes traders to manage their capital well
- take the number of lots that match your capital
- Takeprofit equal to 4-6% of capital account
- Stoplose equal to 2-3% of capital account
Gold consolidation a new chance formed to Growth sideGold has reached a new ATH (all-time high) in today’s session, reflecting strong bullish momentum US Government Shutdown Risk (Oct 1) a potential shutdown would likely weaken the dollar due to economic uncertainty Fed Rate Cut Probability (~90%): Markets are pricing in a high chance of a rate cut in October, which would further pressure the USD and support gold prices Even though some Fed officials remain cautious, the macro bias still points to a weaker USD, which is bullish for gold.
Technically ; After making a new ATH, price could retrace to the support zone (3795). This is normal profit-taking behaviour A false breakdown (brief dip below support followed by a strong rebound) is likely. If this happens, price could accelerate upward again. and we could find a next Physiological level 3885,
You may find more details n the chart,
Trade wisely best of luck buddies.
Ps; Support with like and comments for better analysis Thanks for Supporting.

Gold Pullback Toward 3,700 Within Ongoing UptrendHey Traders, in today's trading session we are monitoring XAUUSD (Gold) for a buying opportunity around the 3,700 zone. Gold is trading in an uptrend, with price currently correcting toward this key support/resistance level.
Structure: The broader bias remains bullish, but price is retracing after recent highs.
Key level in focus: 3,700 — a critical area where buyers may look to step in and resume the upward move.
Fundamentals: Softer USD sentiment and steady safe-haven demand continue to favor the bullish case for Gold on dips.
Trade safe,
Joe.

XAUUSDHello Traders! 👋
What are your thoughts on GOLD?
Gold, after its strong recent rally, is now facing the key resistance area around 3700.
Possible Scenarios:
1️⃣ Scenario One (More Likely):
Given that the market is in an overbought zone, a corrective/ranging move toward the lower boundary of the drawn channel and the marked support area is likely. From there, a new bullish wave could begin, eventually leading to a breakout above resistance and a move toward higher targets.
2️⃣ Scenario Two:
Gold makes only a shallow correction, quickly breaks above the resistance zone, and continues its bullish momentum toward higher levels.
Due to the current overbought conditions, Scenario One (correction before continuation) is more probable. However, the overall trend remains bullish as long as key support levels hold.
Don’t forget to like and share your thoughts in the comments! ❤️
