Gold on the Edge of a Breakout or a Sharp Pullback?🔎 Technical Analysis
Main Trend:
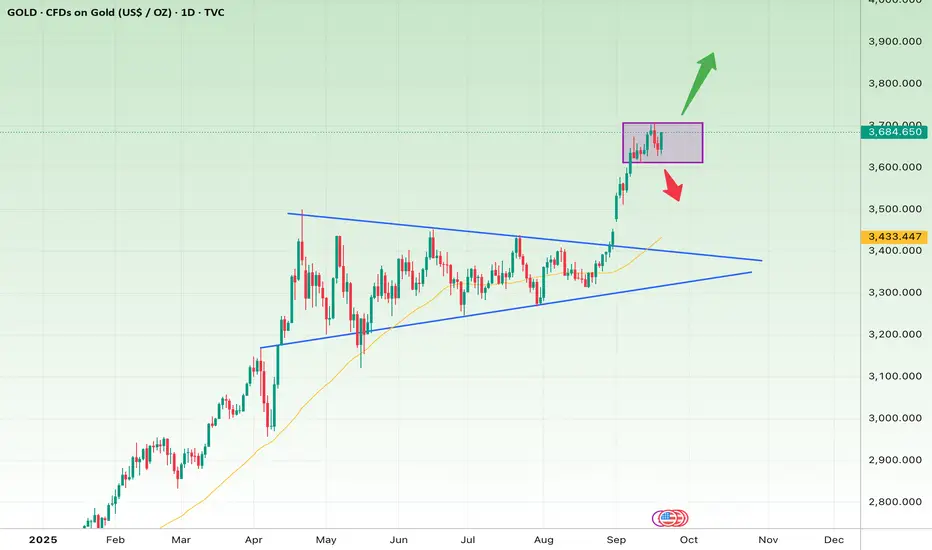
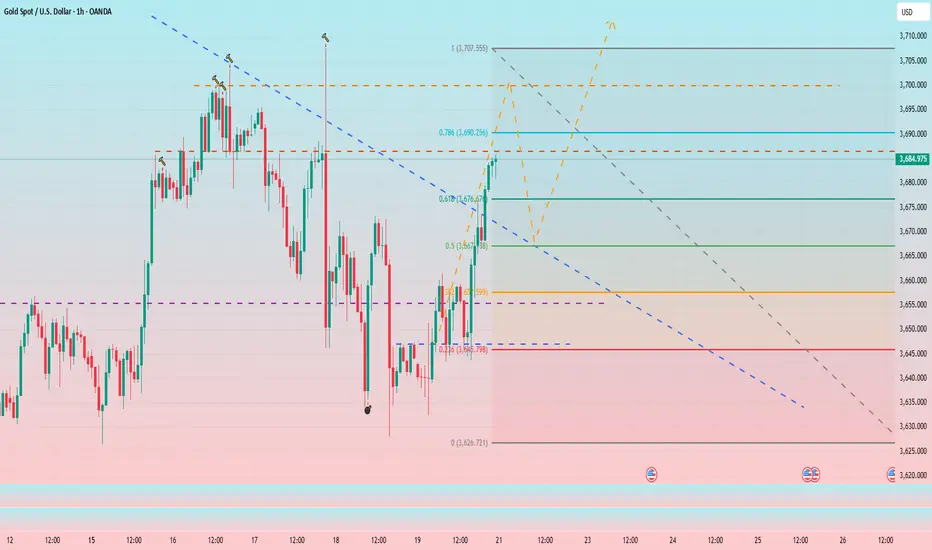
Since early 2025, gold has been in a strong uptrend. The breakout from the symmetrical triangle in September was decisive, with strong momentum, pushing the price quickly above $3,600.
Current Situation:
Price is now consolidating in a range box ($3,630–$3,700). This is a healthy pause after the sharp rally, serving as an accumulation zone before the next major move.
Indicators & Signals:
The 50-day MA (yellow) is acting as dynamic support.
Bullish candles are larger and more frequent than bearish ones → buyers remain in control.
However, a short-term pullback to retest lower supports is still possible.
📈 Short-Term Outlook (1–3 weeks)
Bullish Scenario (more likely):
A breakout above $3,700 could fuel another rally toward $3,780 – $3,850.
Stop-loss: Close below $3,620.
Bearish Scenario (less likely):
A breakdown below $3,620 could trigger a correction down to $3,480 – $3,430 (confluence with the 50-day MA and the broken triangle top).
Stop-loss for shorts: Above $3,700.
📊 Long-Term Outlook (2–4 months)
The overall structure remains bullish, with the triangle breakout still in play.
As long as price holds above $3,430, the long-term uptrend is intact.
Key targets:
First target: $3,900 (psychological level)
Second target: $4,200 (technical projection from the triangle pattern)
Long-term stop-loss: A sustained close below $3,300 would invalidate the bullish outlook.
✅ Summary:
Short-term: The key level is $3,700. A breakout above confirms continuation, while a drop below $3,620 signals a correction.
Long-term: Trend is bullish as long as price stays above $3,430, with $4,200 as a realistic upside target.
GOLDCFD trade ideas
GOLD USD WEEKLYHI GUYS,
here we have gold usd weekly structure. i expect sells around the levels illustrated in the picture above.

FED Chairman satisfied with current FED policy directionThe Fed Chairman is satisfied with the current policy direction of the Fed, while leaving open the possibility of further interest rate cuts if the FOMC deems it necessary to support the economy.
Mr. Powell assessed that the worsening employment situation has changed the balance of risks in achieving the Fed's goals.
On the other hand, the current policy stance is still tightening, giving the Fed enough room to respond to potential economic developments.
Despite the slowing growth, gold prices are still receiving support from many factors. Commerzbank said in a note that strong buying from ETF investors - fueled by expectations of interest rate cuts, concerns about the independence of the Fed and geopolitical developments - could also boost gold prices.
World gold prices received support as the People's Bank of China continued to buy gold regularly, despite the sharp increase in prices. According to the assessment of Société Générale Bank (France), China will still be the "dominant player" in the gold market for many years to come, despite high prices that may further limit purchasing power.v
XAUUSD--LONG--Bullish bias.
--tp and entry levels are as shown on chart
--for big picture check the weekly chart I published before. (I added below)

SMART MONEY CONCEPT (SMC)📊 Bullish SMC Analysis – GOLD
1. Liquidity Grab (Stop Loss Hunt)
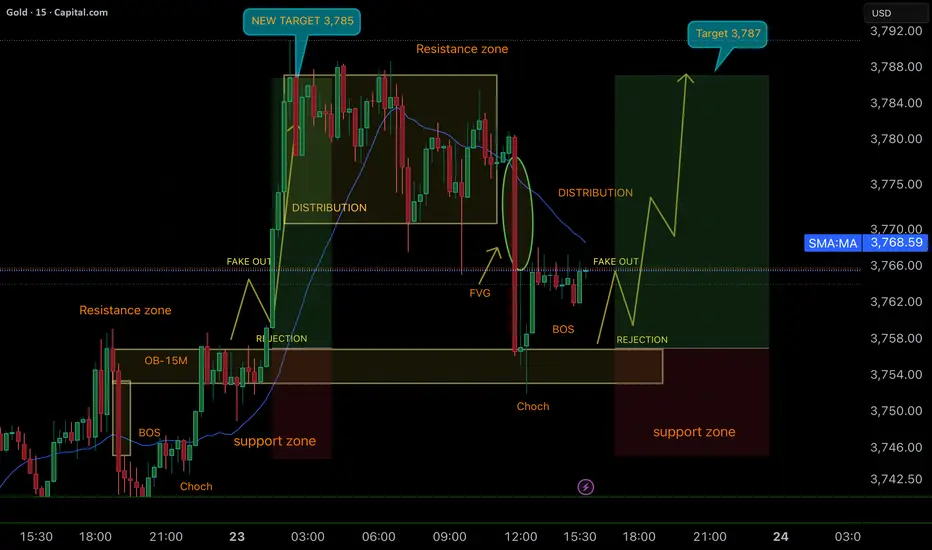
The market retraced back into the support zone, sweeping the liquidity and clearing out the stop losses left below.
2. Break of Structure (BOS)
After the liquidity grab, a BOS confirms bullish continuation.
3. Fair Value Gap (FVG)
The retracement aligns with an FVG, strengthening the bullish continuation setup.
4. Rejection Entry
The rejection off support gives the perfect signal for buyers to step back in.
5. Target 3,787 🎯
With institutions collecting liquidity and confirming direction, the next HH is projected toward 3,787.
✅ Conclusion: This is a textbook example of liquidity engineering — sweep the lows, confirm BOS, and continue the bullish leg. Clean setup with high probability.
Gold price does not break, bullish
News:
After the Fed's decision, spot gold prices briefly soared to $3,707.48 per ounce, a record high. However, following Fed Chairman Powell's speech, the dollar rebounded sharply, sending gold prices plummeting to $3,646.00 per ounce. By Wednesday's close, spot gold had fallen 0.8% to $3,659.96 per ounce.
With dovish expectations surrounding the Federal Reserve still intact, any dip in gold could be seen as a good opportunity to buy on the dip, thereby maintaining the uptrend.
The market now looks forward to the U.S. initial jobless claims data for fresh trading momentum. Furthermore, geopolitical headlines and comments from U.S. President Trump could also drive gold prices in the coming sessions.
Technical aspects:
The daily chart shows that gold buyers appear to have another opportunity for a sustained rally, as the 14-day Relative Strength Index (RSI) has finally retreated sharply from extreme overbought territory. The RSI has fallen from 80 to 70.
If bargain hunting emerges and gathers momentum, gold could retest the record high of $3,708 per ounce. A daily close above that level would open the door to the $3,750 per ounce region.
From a 4-hour analysis, effective support remains near 3620, which is currently a key defensive support level. If this level continues to fall, the bullish and bearish biases may shift in the future.
Key resistance from above remains at 3700. Strategically, consider long and short positions within this range. In the middle, be cautious and watchful, follow orders carefully, and patiently wait for key entry points. Specific operational strategies will be monitored closely.
Strategy:
Gold falls back to 3620, 3630 and buys, stop loss at 3610, target 3690-3700, break to 3720
Gold pushes to new highs at 3720’sGold pushes to new highs at 3720’s, though price action faces near-term suppression. An imbalance remains open within the 3699–3700 zone, which is expected to be cleared before the next directional move.
<<<<>>>>> Key Levels:
High: 3720’s
Imbalance Zone: 3699–3700
Bias: Bullish structure intact, correction likely follow for more insights , comment and boost idea

XAUUSD on swing highXAUUSD is still intact bullish Rising channel and we have new BOS at 3680-3690.
What possible scenario we have?
My Stance on today's move
• XAUUSD on undisputed bullish trend & I'm expecting retracement towards 3700 and I will buy from 3690-3700 area my optimal target will be 3745.
Keep in mind H4 should be close above 3690.
• secondly if H4 candle closes below 3675-3670 then our analysis will be invalid
All the entires should be taken once all the rules are applied

Gold Price Analysis – Bullish Continuation Expected Gold Price Analysis – Bullish Continuation Expected
Gold is currently maintaining a strong bullish trend structure on the 4-hour (4H) chart. The market has been consistently forming higher highs and higher lows, indicating sustained bullish momentum over the medium term.
At present, price action appears to be in a secondary corrective phase within this broader uptrend. This pullback is considered a natural part of trend development, where the market consolidates before continuing in the primary direction. Despite the temporary slowdown, the overall bias remains bullish as long as key structural levels hold.
On the downside, the $3610 level acts as a critical support zone. This level has previously served as a base for bullish moves and is now expected to act as a strong demand area. Any rejection or bullish reversal signal near this zone could present a high-probability buying opportunity.
On the upside, gold is likely to resume its bullish trajectory after the current correction completes. If the price confirms a bullish reversal pattern—such as a bullish engulfing, double bottom, or pin bar formation—around the $3610 support area, traders may look to initiate long positions with a target of $3700 in the upcoming sessions.
This projected upside aligns with the ongoing bullish structure and the potential completion of the current retracement. Traders are advised to wait for confirmation before entering, as premature entries during a correction phase can carry higher risk.
In summary, gold remains bullish on the 4H timeframe, with $3610 as key support and $3700 as the next target. A confirmed bullish reversal pattern would signal continuation of the trend and present a viable long setup.

The upward trend has been broken; are the bears doomed?#XAUUSD OANDA:XAUUSD
I had to go out for something on Friday, so I left everyone with a bearish trading strategy. As the gold price rose on Friday night, the limit order I set at 3685 before leaving was activated. At present, friends who have referred to the trading strategy should be holding short positions like me. Let’s briefly analyze the possible market trends on Monday and how to arrange the short positions in hand.
First, let’s review Friday’s trend. Driven by news and large-scale buying intervention from major ETF funds, gold in the US market broke the trend and began to rise. The 15-minute chart formed a classic W-shaped pattern, forming a double bottom near 3645. It then rebounded, breaking through the short-term resistance around 3660-3665, and ultimately rising to around 3685.
The daily chart shows that Friday saw a large bullish candlestick close, with gold prices once again stabilizing above the MA5 moving average. This suggests a renewed bullish rally, and gold prices may continue to rise on Monday.
At the same time, you can observe silver, which is also a precious metal. The upward trend of silver has not been broken, so the bulls still exist in the short term, which indirectly reflects the possibility of gold rising on Monday. But one thing worth noting is that when gold hit a new historical high earlier, silver also hit a new high. This time, silver broke through again, but gold did not follow suit and break new highs. This involves issues such as exchange rate conversion. Therefore, sometimes the US dollar and silver can be used as a reference for us, but we should not trust them too much.
Overall, my judgment on gold on Monday is that it may continue to rise at the opening and touch around 3700 before encountering resistance and falling back, falling to near the turning point and then rebounding. Therefore, friends who hold short positions do not need to worry too much. Friends with sufficient funds can consider adding short positions around 3700 and adjust the TP of all short positions in their hands to 3670-3660. For those with smaller accounts or who can't effectively manage their trades, consider hedging to protect your account and unwind the hedge after the pullback. On the contrary, if gold falls directly, we can still look towards 3670-3660.
XAU / USD 1 Hour ChartHello traders. Gold is on it's own trajectory. I am watching the current 1 hour candle to see if it respects the bottom of the previous hour's candle. Personally, I need a good pullback for a good entry. Let's see if the Pre NY volume, which starts in about half an hour from this writing, moves gold down to take out the existing longs in profit from the overnight sessions. Patience is key. Big G gets my thanks. Let's see how things play out over the next hour or so. Be well and trade the trend.

XAU/USD Bullish Channel Breakout Setup – Buy from Support 3685, Chart Analysis
Trend & Structure
Price is moving inside an ascending channel (highlighted in red and blue trendlines).
Currently, the market is near the upper boundary of the channel, showing bullish momentum.
A support level is marked around 3685–3690, where the price has previously respected.
Trade Setup (Long Position)
Entry Point: 3685.79
Stop Loss: 3671.88 (below support, giving space in case of a false breakout).
Target Point: 3745.80
Risk-to-Reward Ratio (RRR)
Risk: ~14 points (3685 → 3671).
Reward: ~60 points (3685 → 3745).
RRR ≈ 1:4.3, which is very favorable.
Expected Price Action
Chart shows a possible retest of support (3685) before bouncing upward.
If the support holds, price is expected to rally toward 3745 resistance/target zone.
If the support breaks, SL will protect from further downside.
📊 Summary
Bias: Bullish continuation.
Reason: Price respecting ascending channel + strong support level + bullish structure.
Setup: Buy near 3685 with SL at 3671 and TP at 3745 (RRR > 1:4).
⚠️ Note: If price closes strongly below 3680 (support), this setup becomes invalid.

History Repeats – Another Head & Shoulders on XAUUSDIn our past case studies, we tracked:
Case Study #3 & #4 → The first Head & Shoulders breakdown and measured move.
Case Study #5 & #6 → How market memory respected our levels and reacted with precision.
🔎 Today’s Scenario (23rd Sept Update)
Now the market has once again formed a Head & Shoulders pattern around the 3750 resistance zone.
This confirms two powerful lessons:
Patterns repeat on all timeframes.
Old resistance remains relevant even after multiple retests.
🎯 Key Levels to Watch
Upside invalidation: If price sustains above 3759–3765, we may see continuation to 3780+.
Downside trigger: A neckline break can pull price back towards 3710 / 3699 / 3675 zones.
🧠 Expert Guidance / Takeaways
Always wait for higher timeframe candlestick closing confirmation. Patterns look tempting on smaller frames, but only higher timeframe closes confirm direction.
Market memory works: The same levels where we saw rejections earlier are being respected again.
Plan for both possibilities: Predicting is risky; preparing for both directions keeps you safe.
Stay humble in winning streaks: Overconfidence can undo disciplined efforts — one wrong move without confirmation can erase gains.
⚠️ This is an educational case study, not financial advice. Trade at your own risk.
🔖 Tags
#XAUUSD #Gold #TradingCaseStudy #PriceAction #RiskManagement #MultiTimeframeAnalysis #Tradyoga #Yogeshonale

GOLD Trading Opportunity! SELL!
My dear followers,
I analysed this chart on GOLD and concluded the following:
The market is trading on 3754.1 pivot level.
Bias - Bearish
Technical Indicators: Both Super Trend & Pivot HL indicate a highly probable Bearish continuation.
Target - 3743.6
Safe Stop Loss - 3760.9
About Used Indicators:
A super-trend indicator is plotted on either above or below the closing price to signal a buy or sell. The indicator changes color, based on whether or not you should be buying. If the super-trend indicator moves below the closing price, the indicator turns green, and it signals an entry point or points to buy.
Disclosure: I am part of Trade Nation's Influencer program and receive a monthly fee for using their TradingView charts in my analysis.
———————————
WISH YOU ALL LUCK

Gold need restThis chart shows a short trade setup on Gold (30m timeframe).
📌 Reasoning behind the analysis:
The price recently made a strong upward push but is now facing resistance around $3,756 – $3,760.
The setup suggests a potential rejection at this resistance zone, expecting price to pull back lower.
Entry is placed near the resistance, with a stop loss above $3,776 (to protect against breakout).
Target is set around $3,735, which aligns with a recent support level.
✅ This setup aims to take advantage of the risk-reward ratio: risking a smaller move upward for the chance of a larger downward move.

XAUUSD Price Action: Above Support, Eye on 3880Hello there,
XAUUSD has broken above key resistance and remains bullish above the 3444 level. The primary support zones to watch are at 3477.34 and 3524.08, which act as holding levels within the broader resistance zone near 3722.
The directional bias is targeting the 3880 level, although this movement is expected to unfold gradually over time.
Happy Trading,
K.
Not trading advice.

xauusdPrevious analysis failed
If the last bottom is not broken, we will most likely
According to the analysis, we will have gold price movement

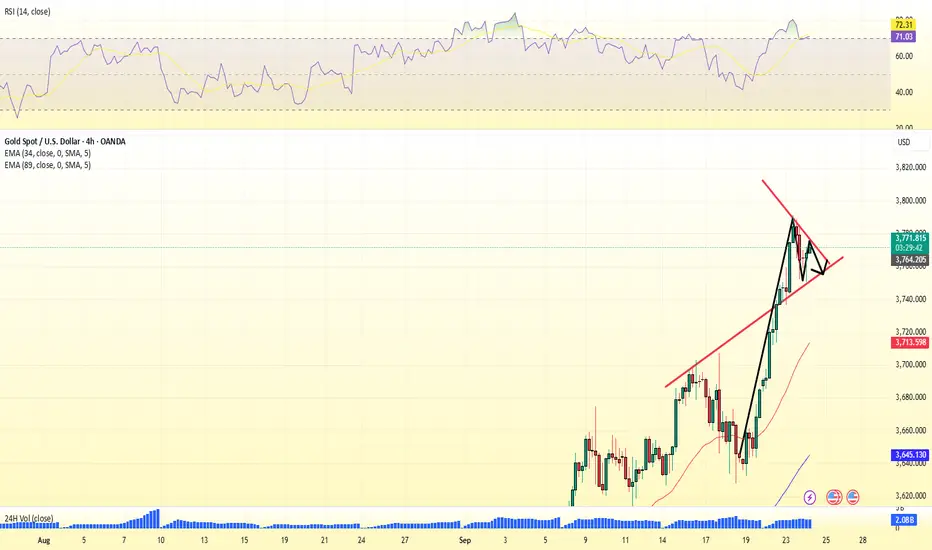
XAUUSD – Wolfe Waves continues on H4XAUUSD – Wolfe Waves continues on H4, price returns below the trendline: prioritising the correction scenario
Hello Trader,
Based on the Wolfe Waves structure on the H4 frame and current price behaviour, gold has returned to trading below the trendline, indicating a weakening of short-term upward momentum and making way for a downward correction before the market decides the next trend. The upper area has created a clear “sell zone”; below, two defensive buying zones appear for both scalping and medium-term.
Main Technical Picture
Wolfe Waves: wave 5 completes near resistance, then price falls back below the trendline — aligning with the correction scenario along Wolfe's target line 1–4.
Trendline & price box area: the close below the rising trendline shows “acceptance” below; immediate resistance lies in the 375x–376x cluster (sell zone).
Momentum: MACD H4 slows down, histogram narrows → high probability of a pullback – retest before a new decision.
Detailed Trading Scenarios
1) Sell according to the correction trend (priority)
Entry: 3756 – 3759
SL: 3764
TP: 3745 → 3732 → 3715 → 3690 → 3672
Reason: the 375x area coincides with the sell zone + upper trendline; selling at retest offers a good R:R ratio.
Confirmation/Invalidation: if H4 closes above 3764 and holds, the short-term selling scenario weakens.
2) Buy scalping in the buffer zone
Entry: 3701 – 3703
SL: 3695
TP: 3715 → 3732 → 3745 → 3766
Note: only a rebound in the correction phase; close each level and move SL according to TP1.
3) Buy medium-term (strong base area)
Entry: 3648 – 3651
SL: 3644
TP: 3672 → 3698 → 3708 → 3722 – 3727
Reason: the 365x area coincides with the demand/accumulation volume on H4; suitable for catching a deep rebound along with the larger trend.
Management: this is a medium-term order, so divide the volume, close each step, and move SL to breakeven after TP1.
Refer to my scenario if you find it reasonable, trade accordingly, and if you enjoy trading gold with high-quality scenarios, follow me

GOLD. XAUUSD Long
ENTRY 3766.47
SL 3727.37
TP 3826.36
This is essentially a trendline bounce setup: buying near support, stop just below, targeting higher highs.
Stop is 42 points below entry.
Target is 57 points above entry.
That’s a 1.3 R/R ratio (acceptable but could be improved if risk is tightened).
RSI is currently below 40 and is curving upward.
This suggests a possible bullish momentum shift (oversold bounce).
Invalidation: A break below the trendline and the stop-loss zone would suggest trend reversal or deeper pullback.
Fundamentally, Gold is undervalued versus the Treasury bond and Dollar index. I will expect a short-term bullish move.

XAUUSD (15/9/25 - 19/9/25)
1. 3655 become a strong resistance which had been tested 3 times.
2. Pool of liquidity + demand zone to be sweep before makiong any high.
3. Monitor 3630 to see if downtrend CHOHC happen and take short entry
4. When price come to 3630, it is safer to take long entry with good R:R.
Conclusion for this week
Short > Long

9.25 Will Gold Continue to Fall?
I. Core View
Overall, the gold market is currently in a sensitive period at high levels within a strong bullish pattern. The upward trend remains intact; however, after consecutively hitting new historical highs, there is a technical need for a short-term corrective pullback. Therefore, for today's trading (September 25), it is advisable to be cautiously optimistic, primarily looking to buy on dips, and avoid chasing the rally at high levels.
II. Fundamental Analysis
Bullish Factors (Supporting Gold Prices):
Fed Rate Cut Expectations: The market's ongoing anticipation of a Fed rate cut within the year remains the core driver pushing gold prices higher. A low-interest-rate environment reduces the opportunity cost of holding non-yielding assets like gold.
Geopolitical Risks: Persistent geopolitical tensions fuel safe-haven demand, leading capital to flow into gold.
Risks and Uncertainties:
Fed Communication: Although the market sentiment is leaning dovish, any hawkish remarks from Fed officials could trigger short-term market volatility.
Fundamental Summary: The fundamental backdrop still favors gold, but one must be wary of profit-taking behavior ahead of important data releases.
III. Technical Analysis
Daily Chart:
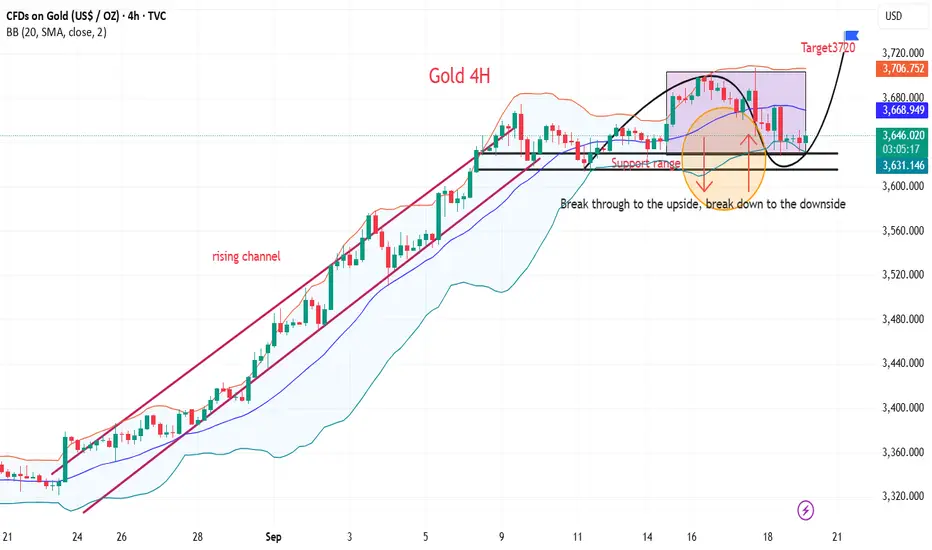
Trend: The overall trend is within a well-defined upward channel, with the price trading near the upper Bollinger Band, indicating strength.
Risk: After the continuous rise, technical indicators show signs of being overbought, suggesting a potential need for a corrective pullback towards the middle Bollinger Band. $3715/oz is the current key strong support level. As long as the price holds above this level, the overall upward trend is difficult to reverse.
4-Hour Chart:
Signal: A potential short-term top signal has appeared (a "three consecutive negative bars" candlestick pattern). This indicates that upward momentum may be pausing; it's crucial to watch if today's candle closes positively to break this pattern.
Support: The first short-term support is around $3737/oz, with more critical support at $3715/oz.
Technical Summary: Technical analysis suggests a risk of a pullback or consolidation at high levels. However, without a clear break below key support, blindly guessing the top and going short is not advisable. Trading should reference key support levels for potential long entries.
IV. Suggested Trading Strategy for Today
Primary Approach: Focus on buying on dips, with selling rallies as a secondary strategy. Avoid chasing prices up or down.
Long Strategy (Primary):
Conservative Entry: A more secure entry opportunity for long positions exists if the price pulls back and stabilizes within the strong support zone of $3710 - $3705/oz.
Target: Look for a move up towards the resistance zone of $3750 - $3760/oz. A break above this area could target levels above the $3800 psychological mark.
Stop Loss: Recommended below $3700/oz.
Short Strategy (Secondary, Short-Term):
Entry Condition: If the price initially rallies to the strong resistance zone of $3770 - $3780/oz and shows signs of rejection (e.g., stalling, bearish reversal candlesticks), consider a light short position.
Target: Look for a move down towards $3740 - $3750/oz.
Stop Loss: Place above $3795/oz.
V. Key Level Reference
Resistance: $3780 - $3790 - $3800 (Historical High)
Support: $3737 - $3720 - $3710 (Key Bull/Bear Line)
Risk Warning: Market sentiment may turn cautious today, potentially leading to narrower price fluctuations. Please strictly control position sizes, set stop losses, and closely monitor any new fundamental news that may emerge during the US trading session.

Buy gold to supply $$$Hello, traders!
My previous forecast was slightly off, as the price didn't show the liquidity grab I was expecting. Therefore, I adjusted my plan.
My new plan was to wait for the price to complete one swing up and then find an entry if it retraced before reaching the anticipated supply zone. As you can see in the image, I decided to enter the trade using a smaller than usual lot size. I must admit, I wasn't thrilled with this price zone, but I felt there was enough probability to justify an entry.
The H4 swing on gold is still bearish. I believe the price will pull back to the supply zone (SZ) before continuing its move down to the discount zone. However, there are still opportunities to trade this pullback. The best and highest-probability trade would be to wait for a short signal at the SZ, as this would offer a better risk-to-reward ratio.
My reasons for entering this trade were:
The price broke down on the M15 timeframe and retraced into the demand zone I had anticipated.
The previous high shows good liquidity, which will likely act as fuel to push the price toward the SZ.
Targets:
The anticipated supply zone (SZ).
If the price breaks the previous high, I will move my stop-loss to breakeven.

XAUUSD--Ascending Channel--Bullish bias
--Looking at the sizes of the candles, we see momentum decreases. But it seems GOLD will rise more.At least up to the upper side of the channel.
