Buying is a great opportunity3750-3760 is support. Trading around this support level today will yield profits!
Next, 3770 is minor resistance. If this level can be broken, gold prices will reach new highs. If it fails, the 3750-3760 support level will be retested. If you follow my trades, you can time your profits accordingly.
GOLDCFD trade ideas

"Bullish Breakout Potential for Gold (XAU/USD) Above Key ?Key Observations:
The price is currently rising and is reaching a key resistance level.
A potential breakout is shown above the resistance at approximately 3,723.
A blue support zone between 3,686 and 3,690 suggests that the price has recently bounced off this level, implying bullish momentum.
The target price shown in the chart (with the green box) is positioned around 3,730, indicating that the trader is expecting further upward movement.
The stop-loss is placed just below the support zone, around 3,672, which suggests that the trader is managing risk.

Gold XAUUSD: Overextension, Pullback, and Key Opportunities📊 Watching Gold (XAUUSD), we’ve seen price make an aggressive push higher, leaving the market looking overextended after such a strong run.
🔎 From here, I’m anticipating a retracement back toward equilibrium ⚖️. In the short term, this sets up the possibility of a counter-trend short opportunity.
📈 Longer-term, my focus remains bullish. I’ll be looking for price to retest key support zones and then confirm strength with a bullish break of market structure. That would offer a high-probability continuation entry 🚀.
⚠️ Disclaimer: This analysis is for educational purposes only and not financial advice. Always trade with proper risk management.

Short term buy for GoldPrice continues its bullishness. It gets into a breaker block and then, the 4h candle low is taken out(higher timeframe turtle soup)
Then it retraces back into a 1h fair value gap. On the 1h, we see another turtle soup as the 1h candle low is taken out.
On the 5m we got a market structure shift to the up side. I set my limits at the 5m order block.
Target is the 4h candle high

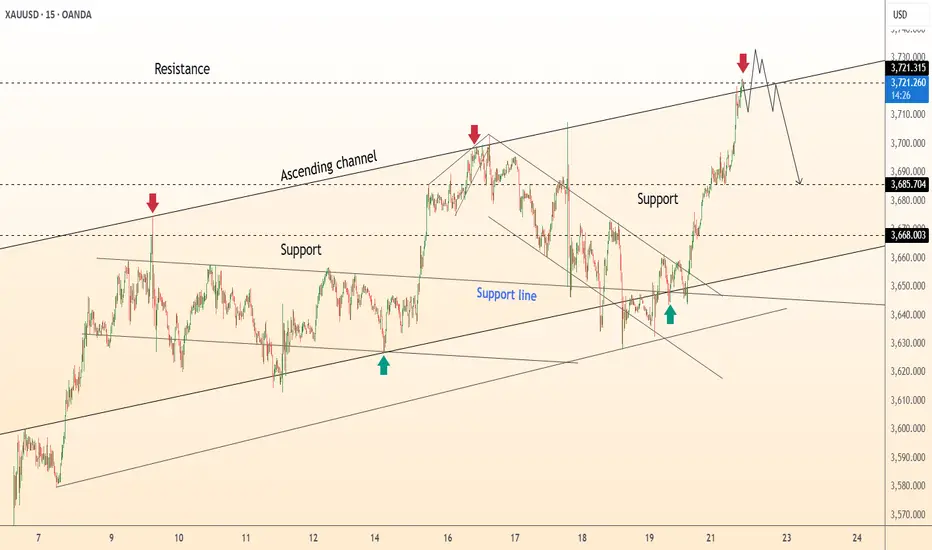
DeGRAM | GOLD reached the upper boundary of the channel📊 Technical Analysis
● XAU/USD touched the upper boundary of the ascending channel near 3720–3730, where rejection signals have formed.
● Price is expected to retrace toward 3685 and possibly 3668 support, confirming a short-term pullback.
💡 Fundamental Analysis
● Gold faces selling pressure as U.S. yields remain elevated and the dollar holds firm ahead of Fed commentary, reducing safe-haven demand.
✨ Summary
Gold shows rejection at 3720–3730 resistance, projecting a correction toward 3685 and 3668 support with short-term bearish momentum.
-------------------
Share your opinion in the comments and support the idea with a like. Thanks for your support!
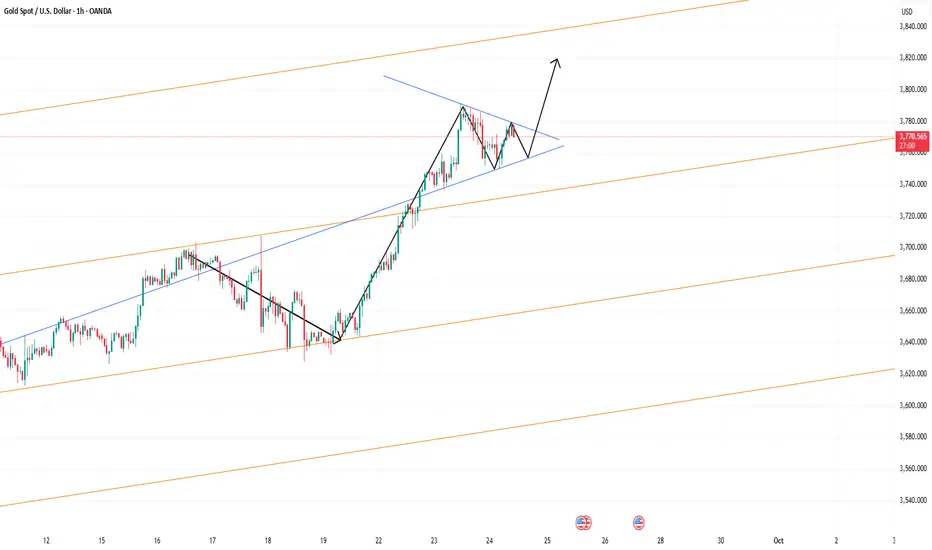
Ascending Triangle Hints at One More Push to 3800?Currently, gold is encountering resistance around 3790-3800, and the bullish momentum has slightly weakened, but the overall pattern is still bullish. Moreover, judging from the two recent pullbacks, although the bears were given the opportunity to escape from the predicament, they were supported near 3750 and rebounded many times. The strong buying support below greatly limited the retracement space.
Gold has formed an ascending triangle structure in the short term. If this structure is valid, then gold as a whole may still hit 3800, or even continue the upward trend to the 3820-3830 area, which is also the upward limit area I mentioned earlier; but this condition must be established under the premise that gold cannot fall below the 3760-3750 area during the short-term retracement.
Therefore, it is clear that the short-term structural support of gold is located in the 3760-3750 area, and the further strong support below is located in the area around 3730. At present, gold is in the ascending triangle structural resistance area of 3775-3785, so there is still a chance of a pullback in the short term.
Therefore, for short-term trading:
1. For the time being, consider shorting gold in the 3775-3785 area, with a retracement target of 3765-3755.
2. Once gold retraces to the 3765-3755 area, consider going long on gold based on market fluctuations and structural support.

Gold Market Outlook – Julius Baer & Technical PerspectiveGold Market and Fundamental Insight (via Carsten Menke, Julius Baer):Current weakness in gold is seen as temporary and not indicative of a shift in the fundamental outlook. The recent price drop may be a classic “buy the rumour, sell the fact” scenario, especially since the Fed rate cut was broadly anticipated. Profit-taking is likely behind the move — a healthy process rather than a bearish signal.
Technical Analysis:
Support level: Watching closely for a retest of the 3354 level Upside potential: If support holds, gold could rally back toward resistance at 3675. A break above 3675, and especially the psychological barrier at 3708, would strengthen the bullish case. Until then, it’s a wait-and-see scenario — needing confirmation through price action.
You may find more details in the chart.
Trade wisely best Of Luck.
Ps; Support with like and comments for better analysis Thanks for understanding.

GOLD 15MIN LONDON CHARTGOLD 15MIN CHART in london chart,if the 15min /1hr closes below 3770-3768 we are waiting for lower buy zone 3738-3733
watch 3716 and 3700 floor .
#gold #xauusd

XAU/USD: Gold Continues to Rise as USD WeakensHello traders, the XAU/USD chart is currently showing a strong upward trend. Gold has risen from the support level of 3,752.000 USD and is on track to approach the key resistance zone at 3,825.000 USD. If it surpasses this level, gold could continue to move higher.
News Impact:
U.S. Labor Market Data: The forecast is for 233K jobs to be created, higher than the previous 231K. However, the slowdown in the labor market has caused the USD to weaken. As the USD weakens, the Fed may maintain or accelerate its easing program, which usually benefits gold.
Conclusion:
With a supportive technical trend and macroeconomic fundamentals, XAU/USD could continue to rise. Traders may look for buying opportunities when the price corrects to the support zone at 3,752.000 USD, with the goal of breaking through 3,825.000 USD in the near future.


Gold: One more attemptGold has been on a strong uptrend, but the price is now testing a major trendline resistance. A possible rejection here could trigger a pullback toward the 2,500 support zone. Deeper correction is coming.
Do not risk more than 1%
Always do your own analysis
Follow for more swing ideas

GOLD Very Bullish , Can We Buy Again And Get 200 Pips ?Here is My 30 Mins Gold Chart , and here is my opinion , the price going up very hard without any correction so we should move wit it and now we finally above 3760.00 With 4H Candle ! and we have a 4H Candle closure above it And Perfect Breakout and this give us a very good confirmation , so we have a good confirmation now to can buy after the price go back to retest the broken area 3760.00 , and we can targeting 100 to 200 pips . if we have a daily closure below this area this mean this idea will not be valid anymore .
Reasons To Enter :
1- Perfect Touch For The Area .
2- Clear Bullish Price Action .
3- Bigger T.F Giving Good Bullish P.A .
4- The Price Take The Last High .
5- Perfect 30 Mins Closure .

Gold Bulls Dominate MarketGold Bulls Dominate Market
Gold price started a fresh surge above $3,750 and traded to a new all-time high.
Important Takeaways for Gold Price Analysis Today
- Gold price rallied to a new all-time high and traded close to $3,800 against the US Dollar.
- A short-term bullish flag pattern is forming with resistance at $3,770 on the hourly chart of gold.
Gold Price Technical Analysis
On the hourly chart of Gold, the price formed support near $3,625. The price remained in a bullish zone and started a fresh increase above $3,660, as mentioned in the previous analysis.
The bulls pushed the price above $3,750 level and the 50-hour simple moving average. Finally, it traded to a new all-time high at $3,791. The price is now consolidating gains below $3,770 and the RSI is above 50.
Initial support on the downside is near the 23.6% Fib retracement level of the upward move from the $3,627 swing low to the $3,791 high at $3,750 and the 50-hour simple moving average.
A downside break below $3,750 could start a larger downside correction. In the stated case, Gold could drop toward the 50% Fib retracement at $3,710. The next area of interest for the bulls might be $3,690. A daily close below $3,690 could spark bearish moves and send the price to $3,625.
If there is a fresh increase, the price could face resistance at $3,770 and a short-term bullish flag pattern. The next sell zone might be $3,790. An upside break above the $3,790 resistance could send Gold price toward $3,820. Any more gains may perhaps set the pace for an increase to $3,850.
This article represents the opinion of the Companies operating under the FXOpen brand only. It is not to be construed as an offer, solicitation, or recommendation with respect to products and services provided by the Companies operating under the FXOpen brand, nor is it to be considered financial advice.

XAUUSD MARKET OUTLOOK!Price seems quite bullish from the H4 timeframe. We can also see a symmetrical triangle pattern which indicates a bullish trend continuation. I’m looking forward to buying gold if price retraces to 3698.21 and 3655.06 respectively. A buy opportunity is envisaged.

LETS GOO GOLD FLY 3830 SOON Gold Have A Super Sharp X Setup
Gold Buy Now Hold Till Physcology Level 3830
Support + RBS + Buy Trendline + Sell TL Breakout
Lets gooo
Good Luck Guys !

Buying every dip on GoldTechnical analysis: Gold is comfortably Trading not only above the broken Higher High’s trendline of the Hourly 4 chart’s healthy Ascending Channel that started after September #23 Bottom, also representing the #3,752.80 pivot Medium-term Support, Price-action is Trading above Triple Top’s rejection point. #3,778.80 - #3,785.80 Resistance zone is still showcasing strong durability (rejecting every upside attempt posing as each rejection local High’s). However if Resistance zone breaks / High Volatility zone is invalidated and zone break might open the way towards #3,800.80 benchmark / Resistance in form of an aggressive spike / extension similar to May #10 Low’s. It is crucial to mention that all this above (Bullish bias) is possible and will be sustainable only if DX extends current Bearish fashion and struggle to make a Bullish comeback since DX weakness is one of the reasons which is keeping Bullish bias alive. Sellers haven’t got any other option than to await their chance and adjust their model as with DX slightly recovering, Gold is not under heavy Selling pressure.
My position: I have Bought Gold on each dip and current orders I engaged are #3,752.80 benchmark re-Buy orders which I closed near #3,775.80 High's half an hour ago (kept them over-night). I continue with Buying every Low's on Gold.

XAU/USD | Day Trade Bullish Map – Can Gold Reach 3800 This Week?🏆 XAU/USD | Metal Market Wealth Strategy Map (Day Trade) 🥇
🎯 Plan: Bullish Wealth Heist
The thief’s map is drawn — and today, the gold vault is our target.
🔑 Strategy Style (Thief Layering Method):
Instead of a single-entry, this plan uses layered limit orders (multiple entry levels). Think of it as planting “buy traps” across the chart to secure the best loot.
📥 Entry Layers (Buy Limits):
3660 💰
3670 💰
3680 💰
3690 💰
3700 💰
(⚡ Add more layers if your style allows — the thief never comes with just one key!)
🛑 Stop Loss (Escape Door):
SL @ 3630 (⚠️ Reminder: This is MY thief escape hatch. You’re free to place your own exit plan depending on risk appetite.)
🎯 Target (Loot Point):
TP @ 3800 (near strong resistance, overbought zone & police patrol 🚨)
— Remember: take profits where you feel safe. The thief escapes when the bag is full!
📊 Thief’s Key Notes
This is a layering strategy, designed for dynamic entries & better position cost-averaging.
XAU/USD often reacts strongly around resistance bands — watch for liquidity hunts before the move.
Don’t marry the trade — grab profit, exit quick, and live to raid another day.
🔗 Related Pairs to Watch (Correlation Check)
OANDA:XAGUSD (Silver): Moves in sync with Gold, but can be more volatile.
TVC:DXY (US Dollar Index): Inverse correlation — if USD weakens, gold often rallies.
FX:EURUSD : Another inverse play against USD, gold strength may reflect here.
SP:SPX / PEPPERSTONE:NAS100 : Risk sentiment cousins — equity weakness often boosts gold.
✨ “If you find value in my analysis, a 👍 and 🚀 boost is much appreciated — it helps me share more setups with the community!”
⚠️ Disclaimer: This is a Thief Style Strategy, shared for educational & fun purposes only. Not financial advice — trade at your own risk.
#XAUUSD #Gold #Forex #DayTrading #TradingStrategy #ThiefTrader #FXCorrelation #Metals #Scalping #TradingView


DeGRAM | GOLD will correct from the $3800📊 Technical Analysis
● XAU/USD surged from the 3715 support, reaching the 3780–3800 resistance zone within a steep rising channel.
● Price is now overextended, with rejection likely near 3800, suggesting a short-term correction back toward 3750–3760.
💡 Fundamental Analysis
● Gold’s recent rally was fueled by safe-haven demand as Fed officials signaled caution on further rate hikes, but stronger U.S. yields still limit upside momentum.
✨ Summary
Gold faces resistance near 3800, with short-term downside risk toward 3750–3760 if rejection confirms.
-------------------
Share your opinion in the comments and support the idea with a like. Thanks for your support!

Gold Weekly September 22 - Candlestick of the third week of Sept
Weekly 9/22
- This is a weekly candle that must have a price increase amplitude to at least test the position 3712-3748, to have strong retracement levels.
- Of course, the peak price of 3706 is still under consideration, and there is still a possibility that the selling area is not strong. If this week's candle sweeps to the positions approaching the 3706 area, including the EQL - EQH positions of the Market to sell, it is still likely to be a Bearish Pinbar.
- However, as mentioned, the market format is showing that the Bears have appeared but failed in their attempt to short the 2 BMS uptrend break positions, so unless Powell speaks Tuesday night that he will raise interest rates in the last 2 meetings of the year, or else everything will have to go according to the technical price movement,
Weekly Support
- Next, when excluding the possibility of a sell-off, for further gains, the price will need support. And we have 2 positions close to the opening price of the candle in the 3680 area, specifically the 2 price areas 3688 & 3678.
- Avoiding the Backtest, we still have the BMS uptrend area 3658 which is the BUEC price area (note the terminology used compared to Chart H.4), but because the 3658 area is already a good SHakeout area, the potential proximity area if the price of 77 is broken out, and the price is anchored above 3658, will be the area 3661-3663. The last utrend support area of the W.1 tree this week.
Choch - 3651
🍓 We will not have any comments, and if the price sweeps here, the team will be ready to hit the Downtrend back to the 3594 area. Let's see

Daily live trade with XAUUSD in 15m/30m/1h 20250924Daily live trade with XAUUSD in 15m/30m/1h 20250924

Gold Weekly 22/9[/b] - The candlestick of the week of September
Candlestick W.1 (9/15)
- This is the candlestick of last week, and as you can see, it continues to be a green Spinning top, showing that although the market has run out of liquidity from the Buy side, it still holds its position in strong support price areas, helping the closing price of the candlestick to stay above the opening price of the week at 3643, and the Buy side, although not completely in control, still has a stable peak demand, helping the price stay above 3688 during the week.
- If we consider the amplitude, candle shape, and Market format, we can see that after the BUllish candle confirming the uptrend Break out 3499, the 2 consecutive W.1 candles have the same amplitude, even though these are the 2 weeks without the strongest data in the month, including CPI & FOMC Meeting.
- Therefore, it can be seen that the uptrend price channel, which was originally formed from the beginning, and despite overcoming 2 strong news periods, the 2 W.1 candles that followed in the form of green candles still ensure that the latest BUllish Uptrend candle, which is a candle with extremely large demand, cannot be re-tested.
- Another factor is that with a good push wave form in the Uptrend price channel, along with 2 failed resistance W.1 candles, has helped the uptrend price channel to be more stable and sustainable, and therefore, the 3706 area will no longer be an area with a strong pullback in the near future. and you will have more basis to consider 2 areas 3712 & 3748.
BMS uptrend 3658 & 3594
- As the previous publications have updated, you can see the BMS uptrend position of each weekly candle, after the comprehensive BUllish uptrend in these 2 positions.
- And as you can see, after 2 Spining top W.1 with the same amplitude, the BMS uptrend position has been better consolidated. And now we will give you some clues in this weekly candle.
