XAU/USD | Day Trade Bullish Map – Can Gold Reach 3800 This Week?🏆 XAU/USD | Metal Market Wealth Strategy Map (Day Trade) 🥇
🎯 Plan: Bullish Wealth Heist
The thief’s map is drawn — and today, the gold vault is our target.
🔑 Strategy Style (Thief Layering Method):
Instead of a single-entry, this plan uses layered limit orders (multiple entry levels). Think of it as planting “buy traps” across the chart to secure the best loot.
📥 Entry Layers (Buy Limits):
3660 💰
3670 💰
3680 💰
3690 💰
3700 💰
(⚡ Add more layers if your style allows — the thief never comes with just one key!)
🛑 Stop Loss (Escape Door):
SL @ 3630 (⚠️ Reminder: This is MY thief escape hatch. You’re free to place your own exit plan depending on risk appetite.)
🎯 Target (Loot Point):
TP @ 3800 (near strong resistance, overbought zone & police patrol 🚨)
— Remember: take profits where you feel safe. The thief escapes when the bag is full!
📊 Thief’s Key Notes
This is a layering strategy, designed for dynamic entries & better position cost-averaging.
XAU/USD often reacts strongly around resistance bands — watch for liquidity hunts before the move.
Don’t marry the trade — grab profit, exit quick, and live to raid another day.
🔗 Related Pairs to Watch (Correlation Check)
OANDA:XAGUSD (Silver): Moves in sync with Gold, but can be more volatile.
TVC:DXY (US Dollar Index): Inverse correlation — if USD weakens, gold often rallies.
FX:EURUSD : Another inverse play against USD, gold strength may reflect here.
SP:SPX / PEPPERSTONE:NAS100 : Risk sentiment cousins — equity weakness often boosts gold.
✨ “If you find value in my analysis, a 👍 and 🚀 boost is much appreciated — it helps me share more setups with the community!”
⚠️ Disclaimer: This is a Thief Style Strategy, shared for educational & fun purposes only. Not financial advice — trade at your own risk.
#XAUUSD #Gold #Forex #DayTrading #TradingStrategy #ThiefTrader #FXCorrelation #Metals #Scalping #TradingView
GOLDCFD trade ideas

Daily live trade with XAUUSD in 15m/30m/1h 20250924Daily live trade with XAUUSD in 15m/30m/1h 20250924


Gold Weekly September 22 - Candlestick of the third week of Sept
Weekly 9/22
- This is a weekly candle that must have a price increase amplitude to at least test the position 3712-3748, to have strong retracement levels.
- Of course, the peak price of 3706 is still under consideration, and there is still a possibility that the selling area is not strong. If this week's candle sweeps to the positions approaching the 3706 area, including the EQL - EQH positions of the Market to sell, it is still likely to be a Bearish Pinbar.
- However, as mentioned, the market format is showing that the Bears have appeared but failed in their attempt to short the 2 BMS uptrend break positions, so unless Powell speaks Tuesday night that he will raise interest rates in the last 2 meetings of the year, or else everything will have to go according to the technical price movement,
Weekly Support
- Next, when excluding the possibility of a sell-off, for further gains, the price will need support. And we have 2 positions close to the opening price of the candle in the 3680 area, specifically the 2 price areas 3688 & 3678.
- Avoiding the Backtest, we still have the BMS uptrend area 3658 which is the BUEC price area (note the terminology used compared to Chart H.4), but because the 3658 area is already a good SHakeout area, the potential proximity area if the price of 77 is broken out, and the price is anchored above 3658, will be the area 3661-3663. The last utrend support area of the W.1 tree this week.
Choch - 3651
🍓 We will not have any comments, and if the price sweeps here, the team will be ready to hit the Downtrend back to the 3594 area. Let's see

Gold Weekly 22/9[/b] - The candlestick of the week of September
Candlestick W.1 (9/15)
- This is the candlestick of last week, and as you can see, it continues to be a green Spinning top, showing that although the market has run out of liquidity from the Buy side, it still holds its position in strong support price areas, helping the closing price of the candlestick to stay above the opening price of the week at 3643, and the Buy side, although not completely in control, still has a stable peak demand, helping the price stay above 3688 during the week.
- If we consider the amplitude, candle shape, and Market format, we can see that after the BUllish candle confirming the uptrend Break out 3499, the 2 consecutive W.1 candles have the same amplitude, even though these are the 2 weeks without the strongest data in the month, including CPI & FOMC Meeting.
- Therefore, it can be seen that the uptrend price channel, which was originally formed from the beginning, and despite overcoming 2 strong news periods, the 2 W.1 candles that followed in the form of green candles still ensure that the latest BUllish Uptrend candle, which is a candle with extremely large demand, cannot be re-tested.
- Another factor is that with a good push wave form in the Uptrend price channel, along with 2 failed resistance W.1 candles, has helped the uptrend price channel to be more stable and sustainable, and therefore, the 3706 area will no longer be an area with a strong pullback in the near future. and you will have more basis to consider 2 areas 3712 & 3748.
BMS uptrend 3658 & 3594
- As the previous publications have updated, you can see the BMS uptrend position of each weekly candle, after the comprehensive BUllish uptrend in these 2 positions.
- And as you can see, after 2 Spining top W.1 with the same amplitude, the BMS uptrend position has been better consolidated. And now we will give you some clues in this weekly candle.

GOLD (XAUUSD): Intraday Bullish Signal
Gold looks very bullish this morning, forming a confirmed
Change of Character after a test of a key intraday horizontal support.
With a high probability, the price will rise more today and reach 3784 level.
❤️Please, support my work with like, thank you!❤️
I am part of Trade Nation's Influencer program and receive a monthly fee for using their TradingView charts in my analysis.

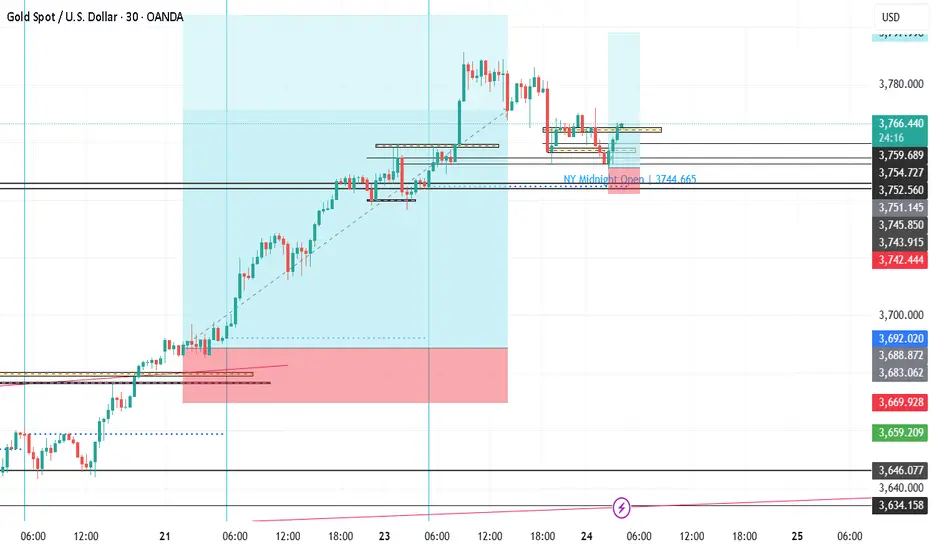
24/9/68 : XAUUSD ( Europe / London Session )Using it from Europe Session until 7.00PM , I'll new analysis and update at 8.00PM
Resistance
3789-3794
3779-3784
3774
Support
3763
3752-3757
3742-3747

longPrice.Recent pullback tested ~3,750 area, which aligns with a short-term support zone.
Strong bullish momentum candles earlier indicate buyers are still in control.
The long lower wicks show rejection of downside moves.
Entry zone is near support, minimizing risk.
Market is showing some consolidation / sideways movement after the last rally.
If 3,744 breaks with strong momentum, a deeper correction could follow.
analysis may change at any time without notice and is provided solely for educational purposes to help traders make independent investment decisions.
The information and publications are not intended to be, and do not constitute, financial, investment, trading, or other types of advice or recommendations supplied or endorsed by TradingView.
XAUUSD – Gold Trading Plan (H2): Eyeing Key Reaction Zones📊 Market Context
Gold continues to hold firm after its recent push above 3,720 USD/oz, maintaining strong bullish momentum. The Fed’s dovish tone, which suggests further rate cuts later this year, and ongoing geopolitical tensions are keeping safe-haven demand intact. Price action indicates buyers are still in control, but key resistance levels could trigger profit-taking or pullbacks before any new highs are tested.
🔢 Technical Levels (H2)
🔴 Resistance / SELL Zones
3,818.758 – Major reaction zone; sellers likely to defend this level strongly.
3,757.270 – Secondary resistance, potential pivot for a short-term pullback.
🟡 Intermediate Supports
3,710.947 – First level to watch for a bounce if price retraces.
3,689.759 – Key support for reloading longs on deeper dips.
🟢 Major BUY Zone
3,661.715 – Strong structural support and potential low-risk entry for trend continuation.
📈 Trade Scenarios
1️⃣ Bullish Continuation (Primary Bias)
BUY: Look for price confirmation at 3,710 or 3,689–3,661 zones.
Targets: 3,757 → 3,818, keep a runner open if momentum breaks above 3,818.
Stop Loss: Below 3,655 to manage downside risk.
2️⃣ Countertrend SELL Opportunity
SELL: Enter shorts at 3,757–3,818 only if clear rejection signals or bearish candlestick patterns appear.
Targets: 3,710 → 3,689, trail stops to lock profits as price moves in your favor.
3️⃣ Deep Correction Play
BUY: Scale in around 3,661 if the market flushes lower.
Targets: 3,710 → 3,757, aligning with the overall bullish structure.
⚠ Key Notes for Traders
Volatility may remain elevated due to global headlines—adjust position sizes and manage risk carefully.
Avoid entering trades mid-range between 3,710–3,757 without clear confirmation.
Watch for strong candlestick or volume signals to validate entries at reaction zones.
💬 Community Discussion
📊 Will gold push through 3,818 for another leg higher, or retrace toward the buy zones first? Share your outlook and chart setups below so we can compare strategies!

Gold Potential Reversal Ahead - Gold Sell OpportunityGold is currently trading around 3647 after making a strong bullish move. Price has reached near a weak high zone and is showing signs of exhaustion, which indicates a possible retracement. The immediate resistance at 3659 has created a weak high. If Gold fails to sustain above this level, sellers are likely to step in, pushing price down toward the levels at 3620 – 3604. A confirmed rejection candle around the sell zone will act as the sell trigger, with 3578 as a deeper bearish target if momentum increases.
🔑 Key Levels to Watch:
- Resistance: 3687 – 3712
- Support: 3,628 - 3600
📌 Sell Zone & Sell Trigger:
- Sell Zone: 3670 – 3685 area
- Sell Trigger: A rejection candle or confirmation of failure to break above 3670 – 3685 zone.
Note
Please risk management in trading is a Key so use your money accordingly. If you like the idea then please like and boost. Thank you and Good Luck!

[Long] XAUUSD (September 23, 2025)Entry: 3758.155
SL: 3753.226
TP: 3778.155
This is possible set up for XAUUSD.
This set up is valid by 4am EST.

Today's gold strategy! Please refer to (3765-3700)After a period of rising, the gold price has been blocked and entered a consolidation stage. This trend is highly similar to last week's market situation, both showing a pattern of continuously hitting new highs before turning into a range-bound consolidation.
Based on this pattern analogy analysis, it is expected that today's market movement may repeat the pattern of last Wednesday: for the gold price to achieve further stable upward movement, it may need to first pull back to release short-term pressure, thereby laying a healthier foundation for subsequent rises.
Based on this judgment, I plan to set up short positions in the 3765 to 3770 range, and then choose an appropriate time to enter long positions when the price falls to a reasonable support level.
During this period of strong gold price gains, some investors who followed the trend have realized substantial returns. Meanwhile, many others are facing significant pressure due to holding short positions against the trend.
According to market observations, this trend-following trend remains relatively common, with some investors already exiting their positions due to stop-loss orders, while others continue to suffer losses.
Regardless of your current position, please leave a comment in the comments section, providing your entry point and relevant trading information. I will provide professional analysis and respond to each one, helping you optimize your subsequent strategies and turn losses into profits. Welcome to join my free channel.

MORE BUYS FROM HERE One of the best entries you would ever get because it fails to buy from here then it would sell a bit longer, this is a buy and hold.

Is the gold price target this week at 3,900?Is the gold price target this week at 3,900?
Gold has already broken through $3,780/oz. Is the next target between 3,875 and 3,900?
As shown in Figure 4h:
Gold has broken through an ascending triangle, opening an upward trend. The corresponding target is around 3,900.
Gold is currently consolidating at a high level, but its upward momentum remains strong.
Overall, gold prices may fluctuate in the short term due to profit-taking, but will remain supported in the medium and long term.
-----------------------------------------------------------------------------------
1: Federal Reserve Monetary Policy: A 25 basis point interest rate cut was implemented in September, and the market expects two more rate cuts this year.
Key Focus: PCE inflation data to be released on Friday and speeches by Federal Reserve officials.
2: Continuing uncertainty in multiple regions, including escalating tensions in the Middle East, the French debt crisis, and the resignation of the Japanese Prime Minister.
These are all important positive factors. As a traditional safe-haven asset, global uncertainty is driving demand for gold.
3: Major central banks around the world (such as China and Russia) continue to increase their gold holdings.
Gold prices are currently at an absolute high.
Key psychological support levels: around $3,700 and $3,750.
The next key resistance level is in the $3,800-3,875 range.
------------------------------------------------------------------------------------
Current Trading Strategy:
1: Market volatility will intensify.
2: Focus on Friday's US PCE inflation data and speeches by Federal Reserve officials.
3: The fundamentals supporting gold prices (rate cut cycle, central bank gold purchases, geopolitical risks) remain unchanged.
4: A pullback in gold prices may be an opportunity to position.
5: Inflation and employment data, in particular, will directly influence the Fed's subsequent decisions.
Trading Strategy:
1: Continue buying at low prices as long as gold prices remain above $3,750.
2: Avoid chasing the rally. Wait for a pullback before going long, with a stop-loss around $3,750.

GOLD GOLD ,COMPLETE reaction, when the price is running calm down and strategize ,nothing stays up for ever, what ever goes up will come down.
wait for the lower level buy. Both buy zones are valid.
GOODLUCK
#XAUUSD #GOLD .

GOLD WILL FALLING SOON According to H1 analysis gold market continuously on flying pressure now gold market is in all time high now it make RESISTANCE LEVEL now market will be touch resistance level again and it will be falling soon so we have chance to go short from here
TRADE AT YOUR OWN RISK
REGARD ALBERT
