𝐌𝐓𝐗 | Pitstop Zone to Continue the 1,300 Pip Potential Rally1️⃣ Key Levels
• 729 – 737 → Major golden support zone.
• 759 – 760 → Key resistance / breakout trigger.
• 691 – 683 → Strongest potential buy zone of the week.
⸻
2️⃣ Expected Scenarios
• Bearish:
• 4H close below 759 → retest of the 729–737 support zone.
• 4H close below 729 → extension toward 709 → 700 → 691.
• Zone 691–683 is the most important potential reversal area this week, with multiple confluences, possibly triggering a strong rally toward the 3800 high again.
• Bullish:
• 4H close above 760 → continuation toward 780 → 791.
• 4H close above 792 → further bullish momentum targeting 808 → 817 → 830.
⸻
⚖️ Summary
The market is positioned between critical zones:
• Holding above 759–760 confirms strength toward 830.
• Breaking below 729 increases the probability of testing the 691–683 demand zone, which could be the week’s strongest reversal setup.
GOLDCFD trade ideas

GOLD's Situation, A Comprehensive Analysis ! (XAUUSD)In my opinion, the price will rise to around $4000 and then enter a corrective wave. Currently, the price is forming the third upward wave, which I have estimated using technical analysis. These upward waves will continue up to around $4000, and after this rise, the price could decline toward the PRZ (Potential Reversal Zone). However, this price correction depends on the breakout of the wedge pattern.

Gold - Just buy the all time high!🔱Gold ( TVC:GOLD ) will rally even higher:
🔎Analysis summary:
Gold remains totally bullish. And after the recent all time high breakout rally of about +15%, traders are willing to accept much higher prices. Following the significant long term rising channel formation, Gold will rally another +25% before we will see a retracement.
📝Levels to watch:
$4.000, $4.500
SwingTraderPhil
SwingTrading.Simplified. | Investing.Simplified. | #LONGTERMVISION

Buy gold immediately if it retraces to 3718-3723!
Gold is no longer a one-sided rally. Its technicals are undergoing a major correction. Our strategy is to follow the trend and prioritize both long and short positions. Now, let's analyze the broader trend. The most common question we receive is: has the market started to decline? Has gold peaked? Yesterday's daily close was negative, and the previous trading day saw another vague tombstone candlestick pattern. Currently, we can only confirm short-term resistance, but we can't confirm a major trend peak or a bullish trend. Furthermore, the short-term correction hasn't disrupted the bullish trend, so today we'll continue to maintain a long strategy on pullbacks.
Based on the 2-hour analysis, effective support remains near 3718-3723, with upward pressure focused on 3756-3765. Our strategy is to primarily buy on pullbacks. In the intermediate range, be cautious and follow orders cautiously, patiently waiting for key entry points. I'll provide detailed trading strategies during the trading session, so stay tuned. Go long on gold if it falls back to 3718-3723, target 3756-3765;

DeGRAM | GOLD is correcting 📊 Technical Analysis
● XAU/USD tested resistance at 3871 within an ascending channel and showed rejection, signaling a short-term corrective phase.
● Price structure suggests a pullback toward 3825–3785 support before a potential re-test of upper channel levels.
💡 Fundamental Analysis
● Dollar strength is reinforced by hawkish Fed commentary and firm bond yields, weighing on gold’s near-term outlook.
✨ Summary
Gold faces rejection at 3871, with downside targets near 3825 and 3785. Short-term bias remains bearish while under resistance.
-------------------
Share your opinion in the comments and support the idea with a like. Thanks for your support!

US Government Shutdown Boosts Gold, FOMO BUY Momentum Continues🚀 XAUUSD – Daily Trading Plan| MMFLOW TRADING
📊 Market Context
Gold kicks off Q4/2025 with strong bullish sentiment as safe-haven flows continue to dominate. The shock of a US government shutdown has sparked fresh concerns, driving investors to accelerate their demand for gold as the ultimate hedge.
Adding to the momentum, the potential delay in the NFP jobs report this week leaves markets “thirsty” for guidance, putting gold in the spotlight. Meanwhile, the US Dollar remains under pressure from political instability and expectations that the Fed may lean closer to further rate cuts.
Together, this backdrop highlights gold’s resilience after its explosive rally and points to further upside potential as safe-haven inflows and FOMO buying pressure continue to fuel the trend.
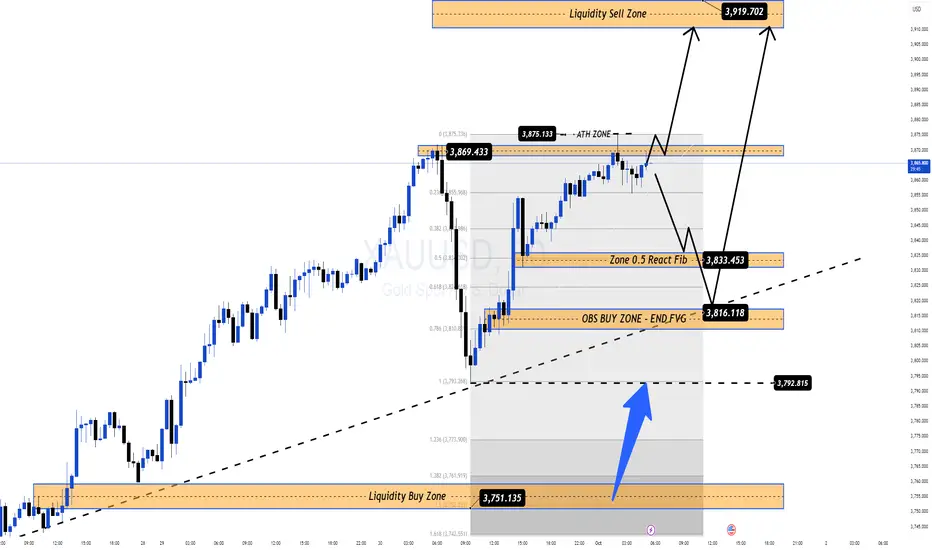
🔎 Technical Analysis (H1/H4)
Price remains within the main bullish structure, holding above key supports.
Primary BUY Zone: 3833–3831 (Fib + CP zone), strong reaction expected.
Secondary BUY Zone: 3817–3815 (OBS zone), deeper support, ideal for additional long entries.
Liquidity Sell Zone 3919–3923: A potential liquidity trap area to watch.
🔑 Key Technical Levels
BUY Zones: 3833–3831, 3817–3815
SELL Zone (watch carefully): 3919–3923
Key Levels: 3800, 3855, 3880
📈 Trading Scenarios & Plan
✅ BUY ZONE 1: 3833–3831
SL: 3827
TP: 3838 - 3842 - 3846 - 3850 - 3855 - 3860 - 3870 - ???
✅ BUY ZONE 2: 3817–3815
SL: 3810
TP: 3822 - 3826 - 3830 - 3835 - 3840 - 3850 - 3860 - 3870 - ???
⚠️ Risk Management Notes
A US government shutdown may trigger unexpected volatility, especially with the NFP delay.
Enter longs only with price action confirmation at support zones.
Avoid chasing highs – patience is key, wait for pullbacks into BUY zones.
✅ Summary
Gold is directly benefiting from political turmoil and delayed US economic data. The main bias remains BUY with safe-haven inflows, focusing on 3833–3831 and 3817–3815 as strategic zones. Targets expand toward 3870–3880 and potentially above 3920 if bullish momentum holds strong.
📢 Follow MMFLOW TRADING for real-time updates and early access to BIGWIN setups!
XAUUSD-gold Bearish Breakout!GOLD made a bearish
Breakout of the key horizontal
Level of 3750.17 and the
Breakout is confirmed so
We are bearish biased and
We will be expecting a
Further bearish move down !

Xauusd setupThis analysis shows a bearish setup for Gold (XAU/USD). Price is expected to drop from the 3,823 level towards the target zone around 3,758, with key support at 3,793. Stop loss is placed above 3,842 to manage risk.

XAUUSD: Rally will Continue after CorrectionHello everyone, here is my breakdown of the current Gold setup.
Market Analysis
The prior Upward Channel has been broken, and the price is now trading below a major Trend Line, indicating that the strong bullish momentum has paused and the market has entered a corrective phase.
Currently, this corrective phase has taken the form of a horizontal Range or consolidation above the Support 2 level. The price has been oscillating between local support and resistance, and is now making another move down towards the bottom of this Range for what I see as a critical test.
My Scenario & Strategy
I'm looking for the price to complete its correction down into Support zone. A confirmed bounce from this area would be the first signal that the pullback is over. The next key step would be a breakout from the top of the current Range.
Therefore, the strategy is to watch for this bounce. A successful breakout from the Range would validate the long scenario. The primary target for the subsequent rally is 3825, which aims for a retest of the major broken Trend Line from below.
That's the setup I'm tracking. Thank you for your attention, and always manage your risk.

Gold prices began to correct, 3690⭐️GOLDEN INFORMATION:
Gold (XAU/USD) holds firm near $3,750 in Thursday’s Asian session, supported by expectations of further Fed rate cuts and ongoing geopolitical risks. The Fed’s September 25 bps cut lowered the policy rate to 4.00%–4.25%, with its dot plot signaling two more reductions this year and another in 2026. Lower borrowing costs reduce the opportunity cost of holding Gold, keeping the metal underpinned.
⭐️Personal comments NOVA:
Gold price continued to break the 3750 support and fell sharply afterwards. Gold price started a major correction after the market was too FOMO on the buying side.
⭐️SET UP GOLD PRICE:
🔥SELL GOLD zone: 3788- 3790 SL 3795
TP1: $3780
TP2: $3770
TP3: $3760
🔥BUY GOLD zone: $3691-$3689 SL $3684
TP1: $3700
TP2: $3710
TP3: $3725
⭐️Technical analysis:
Based on technical indicators EMA 34, EMA89 and support resistance areas to set up a reasonable SELL order.
⭐️NOTE:
Note: Nova wishes traders to manage their capital well
- take the number of lots that match your capital
- Takeprofit equal to 4-6% of capital account
- Stoplose equal to 2-3% of capital account

GOLD – Dollar Strength Weighs as Market Awaits PCE DataGOLD – Overview
Gold eased in early trading as a stronger U.S. dollar weighed on prices after Fed Chair Jerome Powell struck a cautious tone on further rate cuts in his Tuesday speech.
Looking ahead, Friday’s U.S. PCE inflation data will be key—softer numbers could revive expectations for additional monetary easing and help gold reclaim recent highs.
Technical View
Gold is stabilizing below the pivot line at 3,770, keeping short-term pressure on the downside.
Bearish Scenario:
As long as price trades below 3,770, the metal is likely to continue its bearish correction toward 3,754 → 3,739.
A confirmed 15-min close below 3,739 would open the way to deeper support at 3,714.
Bullish Scenario:
A confirmed 1H close above 3,787 would invalidate the correction and signal a push toward 3,801 → 3,807.
Key Levels
Pivot: 3,770
Resistance: 3,780 – 3,800 – 3,806
Support: 3,754 – 3,739 – 3,714

XAUUSD Short: Targeting 3800 on a Corrective MoveHello, traders! The price auction for XAUUSD has been operating within a well-defined ascending channel, confirming a strong bullish trend. This structure has guided the price higher through a series of impulsive moves and pullbacks, with buyers maintaining the initiative throughout this phase.
Currently, the auction is at a critical inflection point at the top of this channel. The price has rallied to directly test the channel's ascending supply line after a strong run-up. This is a key area where sellers are expected to emerge and challenge the prevailing bullish momentum.
My scenario for the development of events is a short-term corrective move from these highs. I expect that sellers will defend the supply line and reject the price, initiating a downward rotation back towards the channel's support. A failure to break out higher would confirm a temporary correction is underway. The take-profit is therefore set at 3800, targeting the major demand zone. Manage your risk.

GOLD (XAU/USD): Bullish Rally ContinuesIt appears that gold is expected to continue its upward trend, potentially reaching the 3920 level.
A confirmed break of structure on the 4-hour chart suggests that buyers are currently in control.
Given the lack of significant US news today, the market is anticipated to maintain a strong bullish sentiment.

Gold (XAU/USD) - Technical OutlookAnalysis
Gold (XAU/USD) has broken out of the descending channel and is now trading inside an ascending channel. The breakout was supported by strong bullish momentum.
Key zones:
🔵 Demand zones around 3765 – 3755 where price could find support on a pullback.
🔴 Supply zone around 3795 – 3805 where price may face resistance.
Outlook:
As long as the price holds above the demand zones, bullish continuation within the ascending channel is possible. A clean break below 3755 would weaken the bullish structure.

Don't think it's ridiculous, 3500 is coming soonAs shown in the chart gold will continue to fall. The first target is to look at 3700 first. I believe that many of my friends who followed me have made money during this gold rally. However, some new friends may have had their orders trapped or their accounts wiped out due to a single surge! This market is like this: it can bring both wealth and disaster! So, don't lose heart if you've lost your account. I can assure you that everyone who enters this market has experienced this, and I haven't either! Life requires some failures to become better. This gold trend K-line is like every rise, which will experience a bottoming out.

XAU/USD – Bulls Eyeing Breakout Toward 3,820From my point of view, Gold (XAU/USD) is showing signs of strength after rejecting support levels multiple times. The chart highlights a clear horizontal range where buyers have consistently stepped in around the 3,713 – 3,720 zone. This area is acting as a strong base, signaling that demand is present whenever price dips lower.
On the other side, resistance near 3,780 has been tested several times, and each rejection has been weaker than the last – which often signals that sellers are losing control. A breakout above this zone could unleash a strong impulsive rally.

Powell tightens, Dollar flies high, GOLD is falling!US Dollar Accelerates, Gold “Slides” After Fed Chairman Powell’s Cautious Speech OANDA:XAUUSD spot prices plunged in the latest session as the US dollar and Treasury yields rose in tandem, following a cautious speech by US Federal Reserve Chairman Jerome Powell.
Powell: “Caution remains the priority”
In his speech on Tuesday, Mr. Powell said the Fed still needs to carefully consider the two parallel risks: high inflation and a weak labor market. According to him, current monetary policy is still “sufficient to respond to the underlying economic developments,” although it is still limited.
Powell this time appeared “more open but tough,” as if to emphasize that the Fed cannot rush to cut interest rates when inflationary pressures are still persistent.
Yields and US Dollar put pressure
The sharp fall in gold prices also came from rising US Treasury yields. The 10-year yield inched up 3 basis points to 4.137%, while real yields rose nearly 3.5 basis points to 1.767%. This made gold, which does not yield interest, less attractive.
The US dollar index (DXY) also rose 0.66% to 97.85, making US dollar-denominated gold more expensive for investors holding other currencies.
Markets await US economic data
Traders are now focused on US GDP data, jobless claims and personal consumption expenditure (PCE) for fresh clues on monetary policy.
The gold market is reacting to both the Fed comments and geopolitical tensions.
Russia-Ukraine tensions and the haven factor
On the geopolitical front, US President Donald Trump unexpectedly declared support for Ukraine, asserting that “Kiev can take back all its territory”. At the same time, the Ukrainian army said it had attacked two oil pumping stations in Volgograd (Russia).
In the context of instability, gold is often considered a safe haven. However, with the acceleration of the dollar and bond yields, the pressure on gold is still quite large.
Outlook
The Fed will continue to rely on economic data to make decisions, thereby directly affecting the US dollar, interest rates and market sentiment.
Investors now expect the Fed to cut interest rates by 25 basis points at each of its remaining meetings in 2025, with another cut in the first quarter of 2026.
However, with interest rates still an “unknown” factor, gold, which does not generate income, will find it difficult to break out if the Fed does not send a clear signal about the pace of policy easing.
Technical outlook analysis of OANDA:XAUUSD
Overall Trend
• The daily chart (D1) shows that gold has been in an uptrend channel since August, with breakout candles accompanied by high volume.
• Current price: 3,734 USD/oz (after testing resistance near 3,750 – 3,791).
• The main trend is still up, but the price is having a technical correction after a hot rally.
Key technical milestones
Key Technical Levels
• Near Resistance:
3,791 USD (Fib 0.382 + recent high).
3,825 USD (Fib 0.5).
• Far Resistance:
3,872 USD (Fib 0.618).
3,938 USD (Fib 0.786).
4,022 USD (maximum target according to Fib 1.0).
• Important Support:
3,720 USD (Fib 0.236 + MA zone).
3,628 USD (Fib 0.0 – stronger support, in case of deep correction).
RSI
• RSI has reached the overbought zone (>70) and cooled down → supporting a short-term correction before continuing to increase.
Personal trading idea
• Entry 1 (cautious): Wait for the price to correct to 3.720 – 3.730 (nearby support) to buy.
• Entry 2 (risky): Can enter immediately when the price holds above 3.734 with a short stoploss.
• Stoploss: Below 3.700 (safer than below 3.628 if you want to hold long-term).
• Take Profit (TP):
o TP1: 3.791 (nearby resistance).
o TP2: 3.825 (Fib 0.5).
o TP3: 3.872 – 3.938 (strong resistance).
o Further: 4.022 (maximum target in an uptrend).
SELL XAUUSD PRICE 3767 - 3765⚡️
↠↠ Stop Loss 3771
→Take Profit 1 3759
↨
→Take Profit 2 3763
BUY XAUUSD PRICE 3700 - 3702⚡️
↠↠ Stop Loss 3696
→Take Profit 1 3708
↨
→Take Profit 2 3714

GOLD XAUUSD GOLD ,we called 3737 buy zone during the early hours of London session and the price moved into 3782-3785 sell rejection zone and drops to 3761 a strong demand floor.
3761-3758 will be watched as a key demand floor ,if that layer is respected we go higher to break 3782-3785 zone with 3800-3845 as target.
ON A FLIP SIDE IF WE BREAK OUT FROM 3737 ASCENDING TRENDLINE HOLDING BUYERS THEN WE LOOK FOR SELL AND TARTGET 3700-3690,I DONT SEE A DROP EXCEPT THE DXY AND US10Y STARTS TO SHOW BEARISH SIGNS FROM ITS EARLY REBOUND.
GOLD COULD CLOSE THE YEAY 4000$ FROM THE STRUCTURE.
GOODLUCK #GOLD #XAUUSD

Gold Aims for $4000 in October: Trade the Monday DipAs we move into the final quarter of the year, gold continues to capture attention with its strong performance. After breaking through the 3500 mark in September, the metal repeatedly set new historical highs, approaching the key 3800 level and closing the month near 3791. With such momentum, what can traders expect in October? How should positions be managed, and is a market top in sight?
Market Overview: The Path to $4000
The broader trend remains undeniably bullish. Based on current momentum and macroeconomic conditions, I maintain that gold reaching $4000 by year-end is highly plausible—a move of just over $200 from current levels, which is well within reach given recent volatility. Two primary scenarios could unfold from here:
Direct Ascent: Prices rally directly toward $4000 before undergoing a deeper correction.
Corrective Then Bullish: A deeper pullback occurs first, followed by a renewed upward push toward $4000.
A "deep correction" in this context would refer to a decline of $200–250 from the peak. Currently, I see Scenario 1 as more likely, for three key reasons:
Technical Strength Intact: The daily chart shows consistent strength, with pullbacks being shallow and short-lived. Single-day corrections have repeatedly failed to disrupt the broader uptrend.
Upcoming Fed Decisions: With two Fed meetings remaining—one in October and another in December—market expectations strongly lean toward another 25-basis-point cut in October. This near-term catalyst may limit the room or time for a significant downturn before year-end. The October FOMC decision (scheduled for October 30) is likely to keep bullish sentiment alive through most of the month, with any major corrective move potentially delayed until November.
Seasonal Pattern Echoes 2024: This year’s gold trend closely mirrors the pattern observed in the latter half of 2024, where a second rally phase extended through late October, followed by a $254 correction in November. A repeat of this sequence appears probable.
Trading Plan for Monday
Looking at the Friday session: despite bearish sentiment among many traders, gold rallied strongly into the close, surpassing 3780. In my analysis, I identified 3736 as a key support level for a rebound. The market dipped to 3734—just two dollars from my entry—before advancing as projected. We took half profits at 3755 and closed the remaining position at 3780, capturing a 44-point move.
With Friday’s strong close and a modest overnight pullback, Monday’s session is likely to see renewed upward momentum. Traders can watch for a retest of the triangle consolidation support line around 3753 for a potential long entry. The earlier the bullish momentum resumes during the day, the stronger the signal. A break above 3783–3791 would strongly increase the odds of gold pushing through the 3800 level this week.
Final Thoughts
In current conditions, hoping for a deep correction may lead to missed opportunities. Recent heavy buying by the world’s largest gold ETF underscores the solid underlying institutional confidence. Follow the trend—don’t try to pick a top. Staying aligned with the broader direction minimizes strategic error; the rest comes down to tactical execution.
About Me: With years of experience specializing in gold market analysis, I focus on combining technical precision with macroeconomic insights to help traders navigate volatility. My strategies emphasize risk-aware positioning and clear, actionable levels—whether you're new to trading or seeking more structured guidance.
Trade with insight, not impulse.

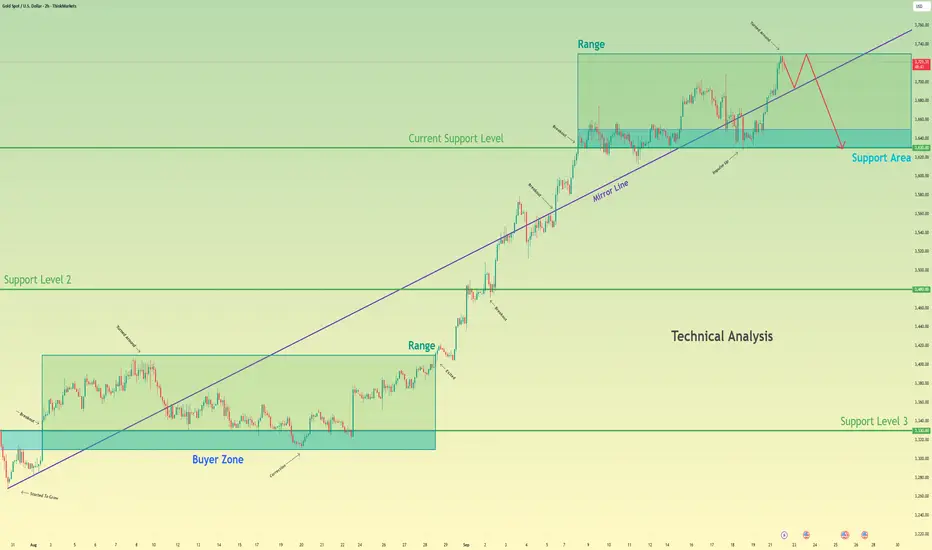
Gold can Complete its Topping Pattern and FallHello traders, I want share with you my opinion about Gold. The market has been developing a complex consolidation structure after its initial uptrend failed to sustain momentum. After breaking out of a first range, the bullish impulse failed, leading to a breakdown below the major ascending mirror line and establishing the current, higher second range. The price action for XAU has since been contained within this new consolidation, repeatedly testing the upper resistance and lower support boundaries. Currently, the asset is again testing the upper boundary of this range, an area that has consistently attracted sellers. In my mind, this price action is forming a complex topping pattern. I expect that the price will be rejected from the top of the current range, perhaps after a brief interaction with the nearby mirror line, and then fail at the highs one more time. I think this final failure will trigger a significant decline with enough momentum to break the mirror line support decisively. Therefore, I have placed my TP at the 3630 current support level, targeting the bottom of this second range. Please share this idea with your friends and click Boost 🚀
Disclaimer: As part of ThinkMarkets’ Influencer Program, I am sponsored to share and publish their charts in my analysis.
GOLD XAUUSD GOLD XAUUSD, 1hr break and retest seem to be the impetus for higher buy despite newyork buy back from London gold market selloff.
if we return at 3870-3872.5 expect a rejection on 1hr or 4hr because that will be a new demand floor for buy ,if we break and close above this zone 3890 -3900 zone .this level will be watched with a possible target into 3954-4000$
watch out for correction from the 5min double top 3896 level,this could retest 3872 0r 3875 for another buy or bearish correction.
trading is 100% probability.
#gold #xauusd

rally back up to sweep the BSL again.POI (Point of Interest): Highlighted in purple around the 3,780 – 3,790 level, where price is expected to react.
BSL (Buy Side Liquidity): Marked in blue near the 3,860 – 3,880 zone, suggesting liquidity resting above recent highs.
SSL (Sell Side Liquidity): Marked in red near the 3,710 – 3,720 zone, showing liquidity below recent lows.
Price Action: Price made a strong bullish move upward, tapped into the BSL zone, then rejected sharply down toward the POI area.
Projection: The dotted arrow suggests a bullish expectation — price may retrace to the POI and then rally back up to sweep the BSL again.

Short Term Market Outlook XAU/USDWhat goes up must come down!
🎯15m chart analysis 🎯
As most experienced gold traders are already aware of its aggressive ranging behaviour many new retail gold traders fail to understand this causing them to get chewed up and spit out in this power house of a pair.
Having an edge against this aggressive range is the key to being able to trade gold successfully long term.
I have highlighted some important areas for you guys to keep an eye out for pull backs, look for rejections and candle closures above and below these zones. Overall market sentiment remains bullish so take sells with extra caution and lighten your positions up. I will keep you guys updated with further levels throughout the week, subscribe and turn notifications on 👁️👁️
Good luck to everybody, let’s make some money this week 💥
