XAUUSD Bearish Dip Toward Demand Zone Before Potential ReboundThis 30-minute gold (XAU/USD) chart shows a sharp drop after rejecting resistance around the $3,870 zone, where a weak high was formed. Price broke structure (CHOCH) and is currently retracing lower, targeting the demand zone between $3,750–$3,770. The projection suggests a possible rebound from this support area, with the potential to recover back toward the $3,860 resistance region, aligning with the marked weak high. This indicates a short-term bearish move followed by a bullish correction.
GOLDCFD trade ideas

Gold prices plummet! Analysis of the intraday gold price trend!Market News:
In early Asian trading on Thursday (September 25), spot gold prices fluctuated narrowly, currently trading around $3,750 per ounce. As investors digested comments from Federal Reserve Chairman Powell, the US dollar and US Treasury yields strengthened, sending international gold prices sharply lower. Powell signaled a cautious outlook for rate cuts, noting that the Fed must continue to balance the risks of high inflation and a weak job market in future rate decisions. Furthermore, Trump presented a Gaza peace outline to Arab leaders, the Russian and US foreign ministers reiterated their commitment to a peaceful resolution to the Ukraine crisis at a meeting, and the EU and US reached a tariff agreement, significantly cooling market risk aversion. Looking ahead, the market's attention is focused on two key US economic data releases later this week, which will provide further clues to the Fed's policy path and directly influence London gold prices. Thursday will see the release of weekly initial jobless claims data, while Friday's release of the US core personal consumption expenditures (PCE) price index, the Fed's preferred inflation indicator, will draw even greater attention.
Technical Analysis:
The US dollar index continued its upward trend during the day, briefly approaching the $98 mark. Gold prices adjusted under pressure, closing with a negative candlestick pattern on the daily chart. It retreated to the 5-day moving average at 3718, finding support at 3736. Since Tuesday's overbought top divergence from the RSI on the daily chart, gold has adjusted by over $70. Currently, the price of gold on the daily chart remains above the 10-day and 7-day moving averages, trading above 3700 and 3710, respectively. On the short-term four-hour chart, the price has retraced to the middle Bollinger Band, with the RSI indicator simultaneously adjusting to the 50 level to find support. The moving average formed a downward crossover at the high of 3767. Gold trading today is expected to continue with a wide range adjustment. Sell high and buy low, with the initial focus on the 3720/3760 range.
Trading strategy:
Short-term gold: Buy at 3717-3720, stop loss at 3708, target at 3750-3770;
Short-term gold: Sell at 3772-3775, stop loss at 3784, target at 3730-3710;
Key points:
First support level: 3732, second support level: 3720, third support level: 3713
First resistance level: 3763, second resistance level: 3780, third resistance level: 3800

GOLD (XAUUSD) – Short-Term Sell Setup Before Bigger Upside MoveGold is approaching an interesting setup. My analysis shows a possible short opportunity from the 3860 zone, with a reaction expected before price pushes higher.
🔻 Sell Zone: 3860 (short-term rejection expected)
🎯 Upside Target: 3870 (after the dip, bulls may take control)
⚠ Keep an eye on how price reacts around 3860 – rejection could offer a quick sell, while a strong breakout would confirm continuation toward 3870 and beyond.
👉 Do you agree with this short-term sell before the upside move?

XAUUSD H1 – Bulls or Bears, Who Takes Control?🟡 XAUUSD (H1) Trading Setup
Gold is trading near 3749, right between strong supply and demand zones. The market is building liquidity, and the next H1 close will decide direction.
🟢 Bullish Case
If price breaks and holds above 3760–3770, it shows buyers gaining strength. Example: A strong H1 candle close above 3770 can push price towards 3780 – 3800.
🔴 Bearish Case
If price rejects from 3760–3770 and breaks below 3720, sellers will take control. Example: A clean break below 3720 could open the way to 3700 or lower demand zones.
📌 Reasoning: Price is reacting perfectly to supply & demand zones, so confirmation on H1 close is the key before entering.
⚖️ Conclusion: Market is neutral for now – wait for breakout or rejection before choosing buy or sell.

My next long positionThe next trade can be based on this. The next important support point is marked on the chart. When the desired point is reached, the long position is activated and, taking into account the specified stop loss, we hold the long position until the target point is reached.

Gold Hits Record High: US Shutdown Looms - Buy the Dip?Gold just hit a record high of $3,833.37/oz (Sept 29), driven by a surge in safe-haven demand over the potential US Government shutdown (Oct 1) and expectations for FED rate cuts (PCE data confirmed). A slight decline in the USD (0.2%) also offered support.
The sharp drop to $3,794 is viewed as likely end-of-month profit-taking, not a fundamental shift. This keeps the Buy opportunity open if US budget tensions escalate.
📈 Technical Analysis & Trading Strategy
Gold saw a big shake-out, flushing out FOMO buyers early in the European session. Selling pressure remains, but don't rush to SELL immediately. Watch for a technical bounce to fill the FVG before any potential continuation lower.
Key Levels:
Resistance: $3827 / $3846 / $3870
Support: $3787 / $3778 / $3763
Detailed Trading Strategy (US Session):
1. BUY Zone (Counter-Trade/Dip Buy):
Price Zone: $3784 - $3782
SL (Stop Loss): $3774
TP (Target): $3792 / $3812 / $3832
2. SELL Scalp (Quick Short):
Price Zone: $3827 - $3829
SL (Stop Loss): $3833
TP (Target): $3824 / $3814 / $3804
3. SELL Zone (Main Short Entry):
Price Zone: $3866 - $3868
SL (Stop Loss): $3876
TP (Target): $3858 / $3838 / $3818
⚠️ Warning: The US Government shutdown is the core focus. If budget negotiations succeed, Gold could retreat sharply. Use tight SL and manage risk carefully!
Will you be buying the dip at $378x or selling the rally at $382x? 👇
#XAUUSD #Gold #TradingStrategy #USShutdown #FED #TechnicalAnalysis #Forex #MarketUpdate

Gold Hits New High at $3831 – Can the Rally Hold?📌 Market Overview
Gold (XAU/USD) surged today, marking a fresh high at $3831/oz, breaking well above previous resistance zones. The rally was fueled by expectations of a potential Fed policy adjustment, a weaker USD, and rising safe-haven demand amid ongoing financial and geopolitical uncertainties.
📊 Technical Analysis
• Key Resistance: 3831 (new high) – 3850
• Immediate Support: 3805 – 3790
• EMA 50 & EMA 200 (H1/H4): Both trending upward, confirming short-term bullish momentum.
• RSI (H1): Approaching overbought territory >70, signaling potential short-term correction.
• Chart Pattern: Strong parabolic rally, though vulnerable to a pullback toward support.
🧐 Outlook
The current uptrend remains supported by safe-haven flows and policy easing expectations. However, with gold posting new highs, profit-taking pressure may emerge near the 3830–3850 zone. A technical pullback to test support is a likely scenario in the short term.
🎯 Trading Strategy
• Cautious BUY: Consider buying on pullbacks toward 3805–3790, SL below 3785.
• Short-term SELL (scalping): Consider selling near 3830–3835, SL above 3840, short TP of 40–80 pips.
• Risk management is essential — avoid FOMO entries at the peak levels.

GOLD TRADE IDEALooking at the 30 minute timeframe we can see price has liquidity above, price is on bullish trend overall and we anticipate price to break today's high and yesterday's high of the day which were created by the London session on both days. A long term buy to all time highs.

trade idea on xauusdwait for the break and retest of the 3872.24-3875.00 zone, look for confirmations then hop on the buys
our initial entry got hit at sl but trade idea stll valid
apply proper risk management

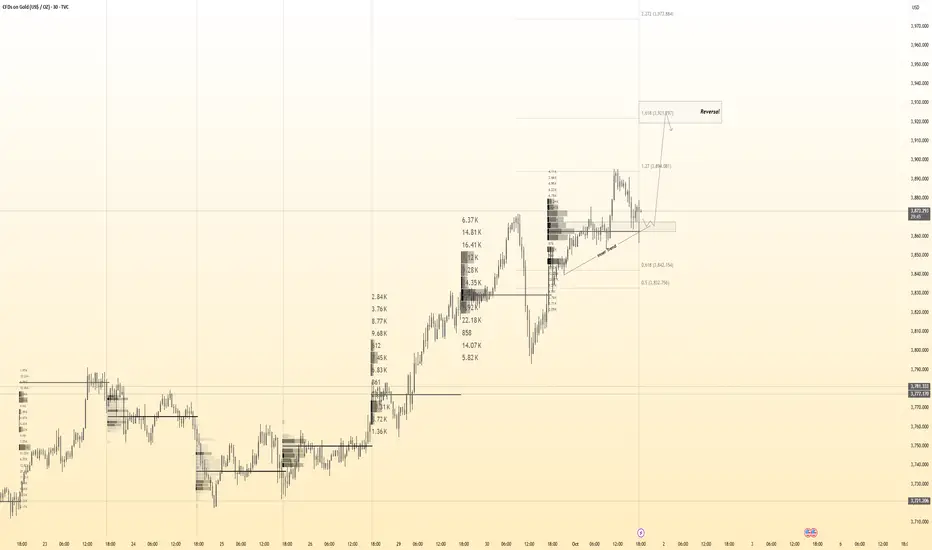
Kwrwshmhmdy4 If you look carefully at the monthly, weekly, and daily time frames, the chart is bullish and almost all time frames are mixed and liquidity is clearly visible in all time frames. The last area marked with a probability of 80% will be the last resistance ahead, which the price will not pass and the sellers will take control of the market.

Gold to go higherwatch the marked area. follow the trend up!
The overall trend on Gold has been bullish so I'd stay buying Gold.

XAUSD Dialy CLS:Model Long from KEy level -LONGXAUUSD experienced a liquidation grab and is now in a pullback phase. With the current price action, the pair shows signs of likely continuation to the upside.Daily range manipulated
Liquidity level taken.SL-3330 and Target 3760 and 3800.

Gold 30Min Engaged ( Bullish Reversal Entry Detected )Time Frame: 30-Minute Warfare
Entry Protocol: Only after volume-verified breakout
🩸Bullish Reversal : 3868
➗ Hanzo Protocol: Volume-Tiered Entry Authority
➕ Zone Activated: Dynamic market pressure detected.
The level isn’t just price — it’s a memory of where they moved size.
Volume is rising beneath the surface — not noise, but preparation.
🔥 Tactical Note:
We wait for the energy signature — when volume betrays intention.
The trap gets set. The weak follow. We execute.
4 Hour TF - Strong Buying Gold Level - Droid TradingGold Take Support Strongly near BOS , Where FVG or OB Present, Check Chart
Entry (3317-3325)
SL - 3307
Target (3365-3370)
BOOK Profit as your Understanding or Daily Target
Entry with Proper SL, as your Risk, Don't use Complete Fund.

XAUUSD POSSIBLE MOVE Gold is showing strong momentum and a possible move to the upside.
Market sentiment remains supportive for buyers, and price action indicates strength for a bullish continuation.
This could be a good opportunity to watch closely, as buying pressure may lead to further gains in the coming sessions.

9.29 Gold price hits a new highOn the hourly chart, gold successfully broke through the $3,700 mark last week and continued its strong performance by breaking through $3,800 on Monday. For support, the $3,800 mark is a key level. Gold prices surged higher this morning, and after a breakout, prices continued to rise. For upward pressure, the intraday high, also a historical high, at $3,819 is also near the upper limit of the daily Bollinger Band. If gold prices stabilize at $3,800 and reach new all-time highs, the upward trend is expected, with no predictions of a top. The 5-day moving average and the MACD indicator are forming a golden cross, while the KDJ and RSI indicators are forming a golden cross in overbought territory. Short-term technical indicators suggest that bulls maintain their advantage.

Is the gold price out of control?Is the gold price out of control?
Gold is currently trading around $3,863, driven primarily by expectations of a Federal Reserve rate cut, a potential US federal government shutdown, and geopolitical tensions.
Technical analysis suggests the market is in a strong overall bullish trend, but there is also the risk of a short-term pullback.
Immediate resistance: $3,880-3,900. A break above $3,860 would create both psychological and technical resistance.
Key support: $3,810-3,805, currently a short-term bullish and bearish pivot point. A break below this level could trigger a deeper technical correction.
Core support: $3,767-3,730, a medium- to long-term trendline. Key moving averages, including the 20- and 50-day exponential moving averages (EMAs), converge here, providing support for the continuation of the bull market.
Short-term trend (1-4 hour chart):
Gold is currently trading steadily within a clear upward trend channel.
Technical indicators show strong bullish momentum, but the market has just broken through overbought territory, so there's still room for further gains.
Note: If prices fail to rally repeatedly around $3,850-3,860, a short-term top structure could form, triggering a pullback to $3,810 or even $3,780.
Current Market Trading Strategy Reference:
1: Follow the Trend: In a bullish trend, the primary strategy is to look for buying opportunities after pullbacks.
Consider entering with a small position if gold prices retrace to the $3,810-3,805 support area, with a stop-loss below $3,778.
2: Beware of Pullbacks: Given that gold prices have reached all-time highs, it's crucial to avoid blindly chasing long positions at high levels.
If prices quickly rise to the strong resistance zone of $3,880-3,900, a small short position could be cautiously considered, but the stop-loss should be set above $3,865 to protect against extreme market rallies.
3: Follow-up after a breakout: If gold prices break above the upper channel level at $3,860, the uptrend could intensify, with the next immediate target at $3,900. Consider initiating a small position for follow-up trading, but risk management is equally important.
------------------------------------------------------------------
Federal Reserve Policy Trends: Federal Reserve officials will deliver a speech on September 30th. Any hawkish comments (supporting tighter monetary policy) could dampen expectations of a rate cut and put pressure on gold prices.
Government Shutdown Risk: If the US government shuts down before midnight due to budgetary issues, the non-farm payroll data scheduled for release this Friday could be delayed. This uncertainty would significantly exacerbate risk aversion in the market and could further support gold prices.
Geopolitical Situation: Ongoing geopolitical conflicts are a long-term factor supporting demand for gold as a safe-haven asset.


Patience is also a position — the market always rewards discipli Analysis & Reasoning
• Price is currently moving inside a rising channel after a sharp bearish impulse, showing corrective behavior.
• The OB (Order Block) supply zone around 3775–3785 remains a key resistance where sellers are likely to defend.
• Liquidity above recent highs could be taken before a potential reversal.
• If price rejects this OB zone and breaks the channel to the downside, we may see continuation of the bearish leg.
• Next major demand lies around 3686, which aligns with previous liquidity pools.
⸻
📉 Trade Idea
• Sell Zone: 3775–3785 (OB / Supply)
• Reason: Corrective channel + OB supply + liquidity sweep potential
• Target: 3720 → 3686 (major demand)
• Invalidation: Break and close above 3790

puria bebin 👋 Welcome puri juuun!
Let's dive into today's Bitcoin analysis. The market has had an upward movement. Let's see what's ahead in the market.
⏳ 1-Hour Timeframe
Yesterday, I mentioned that there was a high probability of movement and that it would be a good idea to keep an eye on the chart during the New York session as the market could move.
📊 With the start of the New York session, good buying volume entered the market, and after breaking 109890, Bitcoin started an upward wave.
🔑 The first area where the price could have faced resistance was 111605, which was broken on the first attempt. After a pullback, the next leg started.
🚀 The break of 109890, along with RSI entering Overbuy and the entry of buying volume, was a good trigger for a long position, and we could have opened a position with it.
⭐ Now, the price has reached a very important resistance zone, and the probability of a correction starting is high. For taking profit, I suggest you lock in profits whenever RSI exits the Overbuy zone, as this will reduce the upward momentum and increase the chances of a correction.
📈 For new positions, no triggers are available yet, and it's better to wait until the market gives us a clearer structure. However, if the price reacts several times to the level, we can open a long position in subsequent attempts if it breaks.
❌ Disclaimer ❌
Trading futures is highly risky and dangerous. If you're not an expert, these triggers may not be suitable for you. You should first learn risk and capital management. You can also use the educational content from this channel.
Finally, these triggers reflect my personal opinions on price action, and the market may move completely against this analysis. So, do your own research before opening any position.

XAUUSD high probability buying zoneXAUUSD good buying area i think, because the price action still bullish and i found a good area to buy bellow the inducement area. so many people will take buy position on inducement area because he think its a good demand, but big player will grab their stop loss and buying below inducement.

Gold prices are under pressure in the 3900-39709 range.Gold prices are under pressure in the 3900-39709 range.
As shown in Figure 4h,
I believe you'll remember my analysis immediately.
If you carefully study my chart structure and classification, you'll come to a clear conclusion.
However, many lack such patience and are still waiting for my direct answers regarding gold trading.
Will gold prices reach $4,000?
As the chart shows, it's absolutely possible.
Currently, gold prices are under pressure in the 3900-3870 resistance range.
But it's undeniable that they're still struggling to make sufficient adjustments for the next leg up.
Current effective support: 3810-3820.
Current turning support: around 3785.
Two conclusions follow from this:
1: As long as gold prices remain above 3785, the bullish trend remains intact.
2: As long as gold prices remain above 3810, the gold trading strategy is to wait for a low price to buy.
Isn't that hard to understand?
Do you need to consider news and policies?
At least from a technical perspective, not yet.
Mastering these two trading rules will prevent you from suffering a crushing defeat, but will significantly increase your chances of making money.
As for mastering the details of your trading?
I'm Katyusha.

XAU/USDWell, gold continues its upward trend, but it will stop at some point and needs a price correction. We expect it to start its decline after reaching the ceiling.
