Bulls Gathering Momentum for Further GainsGold is currently consolidating around the 3820 level while maintaining a structure that favors buying on dips. The approach remains to seek long positions during retracements rather than chasing upward movements. From a technical perspective, some corrective pullback would provide healthier momentum development.
Although the intra-hour charts show signs of divergence, we should remain cautious about the possibility of a corrective decline if prices fail to stabilize above the 3830 level. For now, we are not considering near-term short positions.
Key support awaits in the 3805-3800 zone. Whether gold can close above 3800 today will significantly influence short-term market sentiment.
4-Hour Chart Analysis:
Immediate Support: 3805-3800
Major Support: 3785-3790
Immediate Resistance: 3830-3835
Trading Approach:
The primary strategy remains buying on dips toward support. Avoid entering positions in intermediate price ranges - maintain patience and wait for key levels before executing trades.
📈 Actionable Trading Plan:
Initiate long positions in the 3805-3800 zone
Add to long positions near 3785-3790
Stop loss below 3778
Take profit targets: 3825-3830
About me: With years of experience specializing in gold market analysis, I focus on combining technical precision with macroeconomic insights to help traders navigate volatility. My strategies emphasize risk-aware positioning and clear, actionable levels—whether you're new to trading or seeking more structured guidance.
GOLDCFD trade ideas

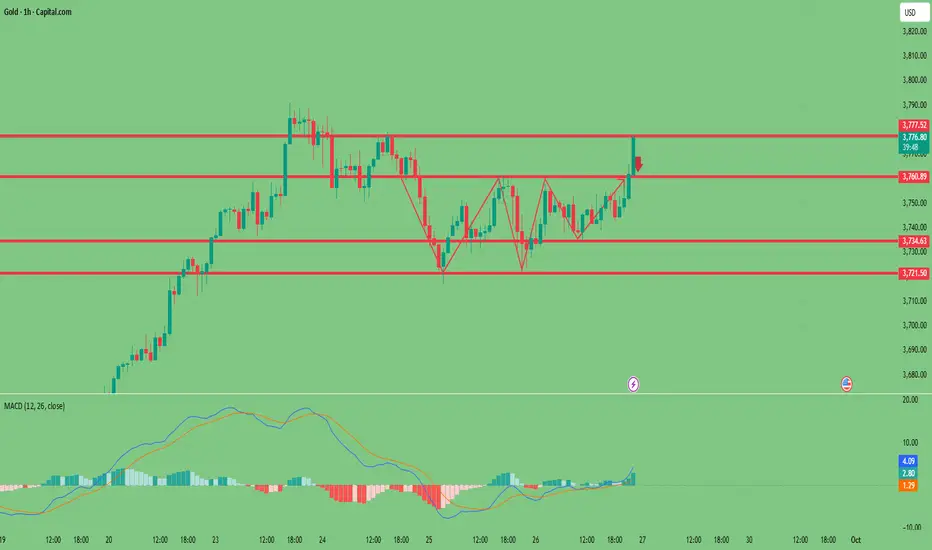
Gold Trading AnalysisTechnical Analysis:
Gold:
Gold continued its upward trend overnight, dipping lower in the morning before rebounding and confirming resistance at 3762. It then oscillated under pressure in the European session and dipped again before the US market opened, briefly dropping to above 3720. However, it rebounded from the lows in late trading, closing above 3750. Focus on the following intraday trading strategies.
Price:
Resistance: 3755/3765, followed by 3780, and then above 3790 (upper limit yet to be determined).
Support: 3730/35, followed by 3720/10, and then 3700.
Trend and Timing:
Upward pressure is slowing at 3791 and 3780, and the market is entering a period of consolidation in the short term. Initial support is currently confirmed at 3710/20. The market has already been moving within this range for three trading days. The question for the intraday market is whether it will continue its broad sweeping correction or, after repeatedly consolidating support, gradually shift into a bullish extension phase. The two different rhythms require completely different approaches (if it's more of a sweeping trend, continue to maintain a high-short-low-buy strategy, coordinating with each other). Conversely, if it gradually breaks away from the sweeping trend and returns to the directional extension point (then try to follow the trend and avoid following the short position). The two strategies require careful monitoring of intraday strength fluctuations to gradually determine the winner.
Returning to the market trend, the previous 3790 level has been used as a pressure point, slowing the upward trend into a sweeping consolidation phase, and has subsequently exerted downward pressure over time. The currently confirmed support band below is 3720. /3710 area. The previous three days of sweeping movements reveal two patterns:
First, the time cycle: a dip confirms support in the Asian session, a rebound confirms the high in the European session, and a break below the low under pressure in the US session (and a period of volatility in the late trading session), a cycle of first falling and then rising.
Second, the spatial pressure: the sweeping downward trend line formed by 3791 and 3780 was extended below 3765 yesterday, and the corresponding extended pressure today is down to 3755 (in other words, if the downward sweep or retest is to continue, regardless of the struggle in the downward zone, the best intraday trend is to remain below 3755).
Based on the above two time and spatial cycles, if the intraday trend needs to continue to maintain This is a more of a sweeping formation. From a node perspective, the Asian session confirmed a rebound from the low. The current European session is experiencing a rebound, but it's hovering below 3755, along the downward trend line of the sweep. Therefore, whether it's sideways or volatile from the European to US sessions, it's best to target this area directly, with further declines occurring before and after each session (to confirm the validity of the two aforementioned cyclical patterns).
Based on this premise, the first step in the European session was to defend against the pressure zone and maintain a sweeping strategy:
1. Before the European session, I initially took short positions below 3752 and profited at 3740.
2. Currently, the European session has reached 3750/54, and I continue to short positions in batches to defend above 3760, still eyeing the 3740/35 area.

#XAU/USDTOver the past few days, I have been experimenting with a new strategy that I recently implemented on my charts, and I wanted to share my experience here. Yesterday, I decided to test this method by opening a sell position. The strategy is based on a combination of indicators, with the CCI (Commodity Channel Index) playing a very important role in identifying potential entry points. When I noticed the signals aligning in favor of a short position, I entered the trade and the outcome was successful, which gave me more confidence in this setup.
Encouraged by the results, I applied the same technique today but this time for a buy position. The conditions on the chart matched my rules for confirmation: the indicator setup provided clear signals that suggested an upward opportunity was forming. Based on this, I executed a buy trade. Looking at the current price action and the way the chart is developing, this moment appears to be one of the best possible times to go long, at least according to the rules defined in my strategy.
What I find particularly interesting about this approach is that it is adaptable to both directions — it worked effectively in a downtrend yesterday and is now showing strength in an uptrend today. The CCI indicator, in combination with my chosen filters, allows me to spot shifts in momentum more clearly and with higher confidence.
Of course, like any trading idea, this is not financial advice and everyone should manage their own risk carefully. However, based on my personal testing and the chart conditions right now, I believe that the buy opportunity at this stage carries strong potential.

XAUUSD Analysis: Rising Wedge StructureThe 1-hour chart of Gold (XAUUSD) is currently presenting a rising wedge structure, a pattern known for its potential reversal characteristics when it forms after a strong upward move. This wedge is neatly defined by converging support and resistance trendlines, capturing price action within a narrowing upward channel.
Scenario 1 – Bullish Breakout Above the Wedge Resistance
In the bullish case, if the price breaks above the upper resistance trendline decisively with strong momentum and volume, it will signal a continuation of the uptrend. This could push Gold prices toward $3,920–$3,960 and possibly even the psychological $4,000+ mark in the short term. For this to play out, the breakout should be clean and sustained, not a false spike followed by a quick sell-off. Traders looking for long opportunities should wait for a confirmation candle and place stops below the breakout zone.
Scenario 2 – Bearish Breakdown from the Wedge Support
Alternatively, if Gold fails to break out and drops below the wedge's lower support, it will trigger a bearish reversal pattern. This breakdown could accelerate downside momentum, pulling prices back toward $3,820, followed by $3,760, and possibly even $3,700 or lower. Such a breakdown would confirm the wedge's bearish implications and shift intraday sentiment into a corrective or reversal phase. In this scenario, short trades can be considered with strict stop-loss placement just above the breakdown candle.
Scenario 3 – Sideways Consolidation Before Decision
If neither a clear breakout nor breakdown occurs, Gold may enter a sideways consolidation zone around current levels ($3,860–$3,880). This would indicate temporary indecision in the market and a potential buildup before a sharp move in either direction. This type of price action can trap both bulls and bears if acted upon prematurely. Therefore, in this scenario, it is best to remain neutral and patient, waiting for volatility to pick a direction.
Final Thoughts for Traders
Gold is at a critical juncture, and traders must approach this setup with discipline. The rising wedge structure demands clear confirmation before execution, and each scenario offers its own opportunity — but also its risks. Always follow strict risk-reward ratios, and avoid emotional trades inside the wedge before confirmation.
Keep an eye on macroeconomic events or dollar strength/weakness that could act as a catalyst for the breakout or breakdown.

Gold forecast trading strategy for September 29th:
Core View: Short-term gold prices face technical correction pressure near record highs, but the overall fundamental backdrop remains optimistic. Expect initial consolidation to digest gains next week, with the key focus being whether a decisive break above the historical high can be achieved. Operationally, it is advised to look for selling opportunities near key resistance levels and consider buying on dips around important support levels.
I. Fundamental Analysis: Mixed Factors, but Safe-Haven Demand and Rate Cut Expectations Dominate
Bullish Factors:
Moderate Inflation and Fed Rate Cut Expectations: The latest PCE data did not exceed expectations, alleviating market concerns about rebounding inflation. Following the Fed's 25 basis point rate cut in September, the market expects two more cuts within the year. Expectations of a weaker USD and lower interest rates provide core support for gold prices.
Technical Breakout: Gold prices have broken through the recent consolidation range of $3720-$3760, attracting more technical buying momentum, indicating strong upward momentum.
Potential Risks and Bearish Factors:
U.S. Economic Resilience Exceeds Expectations: Q2 GDP grew at 3.8%, and the Atlanta Fed raised its Q3 GDP forecast to 3.9%. Strong economic data could reduce the urgency for the Fed to implement aggressive rate cuts.
Profit-Taking Pressure at Highs: After six consecutive weeks of gains and approaching the historical high, some longs may choose to take profits below the historical peak of $3791, leading to a technical pullback.
II. Technical Analysis: Facing a Key Decision at Highs, Beware of Double Top Risk
Trend Pattern: On the weekly chart, gold has posted six consecutive positive weeks, indicating the overall uptrend remains intact. On the daily chart, it has broken out of the consolidation range but has not yet decisively stabilized above the historical high of $3791.
Key Levels:
Resistance: The $3780-$3793 area. This is a strong resistance zone formed by recent highs and the historical peak, serving as a key test for whether the bulls can initiate a new upward leg.
Support:
Primary Support: $3750 (recently breached range top, near the 21-period moving average).
Core Support: $3720-$3700 (previous consolidation range low and key psychological level).
Patterns and Indicators:
4-Hour Chart: The moving average system is in a bullish alignment, but the price encountered selling pressure and retreated near $3783.
1-Hour Chart: Need to be cautious of the risk of forming a "Double Top" bearish pattern near $3780. If this level cannot be strongly breached early next week, the probability of a pullback increases.
Technical Summary: Technical indicators suggest gold is short-term overbought and faces clear profit-taking pressure below the historical high. If it fails to decisively break above $3791, a retest of lower support levels is likely. $3750 is the short-term bull-bear dividing line; a break below would signal a deeper adjustment.
III. Trading Strategy for Next Week
Operational Approach: Adopt a range-bound, slightly bearish mindset, prioritizing selling near key resistance levels and buying on dips at important support levels.
Short-term Short Opportunity (Selling High):
Entry Zone: $3775-$3785 range.
Target: Primary target $3750, further target $3720.
Stop Loss: Place above $3795 (exit if the historical high is decisively broken).
Rationale: Betting on a technical correction before the historical high, with a potential double top forming on the 1-hour chart.
Short-term Long Opportunity (Buying Low):
Entry Zone: $3740-$3730 support area.
Target: $3760-$3770.
Stop Loss: Place below $3720.
Rationale: This area represents a strong support level from the previous breakout. If the price corrects to this zone and fundamentals haven't deteriorated, it may find buying support for a rebound.
Breakout Strategy:
Upside Breakout: If the price strongly breaks and stabilizes above $3795, consider entering a light long position, targeting new highs around $3810-$3820.
Downside Breakout: If the price decisively breaks below the key support at $3720, the short-term uptrend might reverse, consider following through with a short position, targeting $3700 or even $3680.
Summary and Recommendations:
Early next week, before major data releases, market sentiment may turn cautious, and gold prices are more likely to fluctuate between $3750 and $3780. Traders should remain flexible, use light positions, set strict stop-losses, and adjust strategies promptly based on the actual data results. In the current environment, trading "pullbacks within the trend" is a relatively steady strategy.

XAUUSD - RETEST STRATEGY On the 1-hour timeframe Gold is currently showing a clear bullish structure supported by both trendline support and a recent breakout above resistance. For several sessions, price has been forming higher lows along the ascending trendline, showing consistent buyer strength. This upward momentum has now resulted in a breakout above the resistance zone around 3,780, which had previously acted as a ceiling for price action.
With this breakout, the market structure has shifted further in favor of the bulls. However, as is common after such moves, price may retest the broken resistance before continuing its upward journey. A retest of the 3,780–3,785 zone would be a healthy sign of market confirmation, turning old resistance into new support.
Trading Plan:
• Look for long entries on a clean retest of the 3,780–3,785 area.
• Maintain bullish bias as long as the price holds above the ascending trendline.
• Target levels point toward 3,824, which represents the next potential resistance/price objective.
Risk Management:
A stop-loss can be placed just below the retest zone or under the ascending trendline to protect against false breakouts. Always size positions according to your risk tolerance.

Elliott Wave ABC Correction Projection on Gold (XAU/USD)This chart outlines a potential Elliott Wave ABC corrective pattern forming on Gold (XAU/USD) in the 15-minute timeframe. After the recent decline, price action suggests wave A may have completed, with a possible retracement toward wave B before continuing downward into wave C. The EMA 9 and EMA 25 are indicating short-term bearish momentum, supporting the idea of further downside once the corrective bounce is finished.

XAUUSD – Intraday Plan: Fibo Reaction Zones in Focus📊 Market Context
Gold is consolidating sideways below 3,750$ during the Asian session, holding above yesterday’s low. Powell’s cautious remarks earlier this week cooled expectations for aggressive Fed easing, keeping volatility compressed.
📍 Key Reaction Zones
🔴 SELL Zone: 3752 – 3754 (Fibo retest resistance)
🟢 Support Zone: 3725 – 3727 (interim reaction level)
🟢 Major BUY Zone: 3698 – 3700 (Fibo 1.5 – 1.618 confluence)
🎯 Trading Scenarios
1️⃣ SELL Setup
Entry: 3752 – 3754
Stop Loss: 3760
Take Profit: Scale RR 1:2 → 1:3 → 1:4
Idea: Short-term rejection expected at retest resistance.
2️⃣ BUY Setup (Deeper Pullback)
Entry: 3698 – 3700 with bullish confirmation
Targets: 3725 → 3750
Stop Loss: Below 3690
⚠️ Notes for Traders
USD strength could accelerate corrections.
Focus on SELL at resistance today, BUY only on strong reaction from deeper Fibo support.
Stick to RR discipline, avoid chasing mid-range moves.
💬 Community Discussion
Do you expect Gold to retest 3700 before bouncing, or will the rejection at 3754 hold? Share your setups below 👇

THE KOG REPORT - UpdateEnd of day update from us here at KOG:
We started the week well with the move upside working well, however, we broke above our red box indicator so the short trade was in effect, short lived!
Now, we're at all time highs again and support level being used are more intra-day than 4H and above. For that reason, just like we shared with the wider community this morning, we're sharing our red box indicator levels and awaiting the next move. A break above should attempt 3795-8 and above that 3810, while a break below the bias level should start a correction.
RED BOXES:
Break above 3785 for 3792, 3795, 3804, 3806 and 3815 in extension of the move
Break below 3768 for 3758, 3755, 3748, 3740 and 3733 in extension of the move
Not much more to report on.
As always, trade safe.
KOG

Lingrid | GOLD Rally Targeting $3800 Resistance Level ?The price perfectly fulfilled my previous idea . OANDA:XAUUSD is pressing higher after breaking out of its consolidation channel and reclaiming the 3750 level. The market structure is supported by an upward trendline with successive higher highs confirming bullish momentum. As long as price holds above 3728, a push toward the 3800 resistance zone remains likely. The broader trend continues to favor buyers with gold eyeing new all-time highs.
⚠️ Risks:
A drop back below 3728 would weaken the breakout and open the way for a retest of 3700 support.
Stronger USD from Fed Chair Powell comments could cap upside momentum.
Profit-taking near the 3800 psychological level may trigger short-term volatility.
If this idea resonates with you or you have your own opinion, traders, hit the comments. I’m excited to read your thoughts!

GOLD (XAUUSD): Updated Support & Resistance Analysis
Here is my latest structure analysis for Gold.
Horizontal Structures
Support 1: 3767 - 3793 area
Support 2: 3690 - 3736 area
Support 3: 3613 - 3644 area
Support 4: 3560 - 3580 area
Resistance 1: 3898 - 3902 area
Vertical Structures
Vertical Support 1: Rising trend line
Support 1 and Vertical Support 1 will compose an important contracting demand zone.
There will be a high chance to see a bullish movement from that.
❤️Please, support my work with like, thank you!❤️
I am part of Trade Nation's Influencer program and receive a monthly fee for using their TradingView charts in my analysis.

XAUUSD: Targeting $3600 By End Of The YearGold has successfully bridged the liquidity gap in the daily timeframe, indicating a bullish trend since then. We have an opportune moment to initiate a bullish position within our “drawn” area. However, it is imperative to verify the volume and price dynamics in a shorter timeframe. Upon witnessing robust confirmation, it would be optimal to take any position.
We extend our best wishes for successful trading. It is crucial to adhere to meticulous risk management practices during trading. It is important to note that this analysis does not guarantee price movements in accordance with the provided description.

2025-09-26: GOLD LONGXAUUSD LONG
EP 3741 3744
TP 3758 3769 3779 3788
SL 3732
Move SL to BE @ TP1
Yesterday was lots of convergence to this point
RSI is mid point, MACD is flatlining, and volume level suggests this will favour Bulls
Only about an hour of entry availability here, quite a narrow window (Sorry I woke up late)
Trade at your own risk, do your own research, I'm not a professional or an advisor, just sharing what I do recreationally with money I have spare and don't care about loosing.

Gold price accumulates around ATH 3790✍️ NOVA hello everyone, Let's comment on gold price next week from 09/29/2025 - 10/03/2025
⭐️GOLDEN INFORMATION:
Gold climbs as PCE data reinforces Fed easing bets, with the core index holding below 3%. Market sentiment stays upbeat despite weaker Michigan Consumer Sentiment, as inflation expectations point to gradually easing price pressures and lingering concerns over the labor market.
⭐️Personal comments NOVA:
The bulls continue to try to break through ATH and increase the price. The momentum of interest rate reduction in the next rounds in 2025
🔥 Technically:
Based on the resistance and support areas of the gold price according to the H4 frame, NOVA identifies the important key areas as follows:
Resistance: $3812, $3832
Support: $3727, $3697
🔥 NOTE:
Note: Nova wishes traders to manage their capital well
- take the number of lots that match your capital
- Takeprofit equal to 4-6% of capital account
- Stoplose equal to 2-3% of capital account
- The winner is the one who sticks with the market the longest

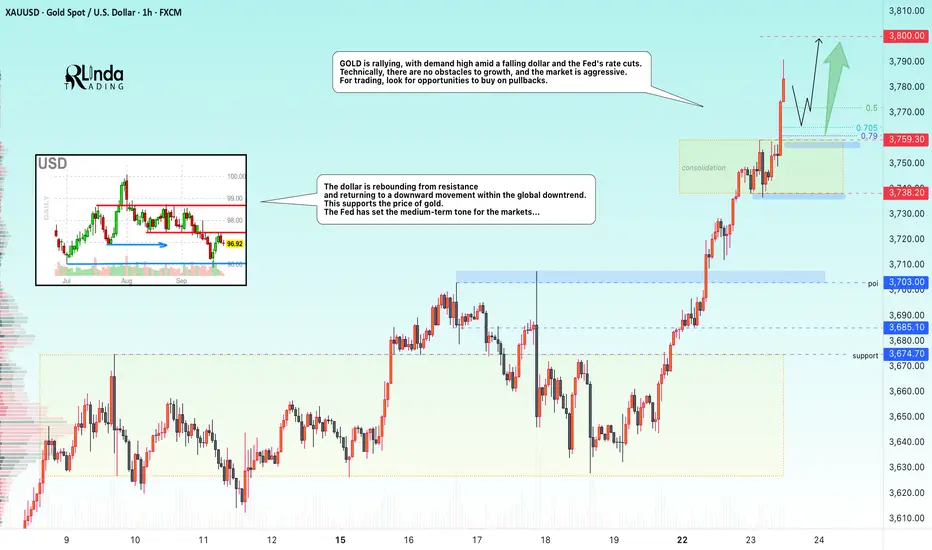
GOLD → Aggressive growth is not over. Powell's speech...FX:XAUUSD is rallying, with demand high amid a falling dollar and the Fed's rate cuts. Technically, there are no obstacles to growth, and the market is aggressive. For trading, look for buying opportunities on pullbacks.
Gold is rallying and hitting new highs as people realize what's going on (interest rates are falling). Powell's speech is coming up, and it may trigger a correction (profit-taking) amid growing risks.
Key factors: Powell's speech today, at which time the market is waiting for hints of further easing of Fed policy.
PMI data (US), weak figures will support the possibility of further rate cuts...
Demand for metal is supported by geopolitical tensions in the Middle East and Eastern Europe.
Resistance levels: 3800
Support levels: 3760
Many factors are supporting the rise in gold, and there are no compelling reasons to sell gold now. The ideal trading strategy is to wait for a pullback and retest of support levels with the formation of strong reversal points for buying.
Sincerely, R. Linda!
XAUUSD || GOLD ANALYSIS BASED ON SMART MONEY ORDERS (REAL TIME )🤖 GOLD ANALYSIS What’s Moving the Market Today? (September 26, 2025)
🚀 Welcome to Trade with DECRYPTERS
We break the charts down into clean levels so you can spot where smart money is buying 🟢 and selling 🔴.
Keep it simple, stick to the plan, and let the levels guide your moves.
🟡 Gold Slips to $3,747 — Dollar’s Flexing Its Muscles!
A stronger US dollar and mixed economic signals are pushing gold prices down.
When the dollar gains, gold gets less attractive as it’s priced in dollars.
Investors are watching closely!
🏦 Fed Says “No Rush” on Rate Cuts — Gold Feels the Heat!
Strong US jobs data makes the Fed cautious about cutting rates soon.
Lower rates usually boost gold, so this hesitation is bad news for prices.
🌍 Middle East Tensions Flare — Gold’s Safe-Haven Glow Shines!
Rising conflicts and US-China trade worries make investors nervous, driving them to gold.
As a safe-haven asset, gold prices get a lift when global risks spike.
📊 Jobs Report Looms — Will Gold Get a Break?
Next week’s US jobs data could shake things up.
If the report shows weakness, it might spark hopes for rate cuts, pushing gold prices higher.
🚀 US Economy Roars at 2.8% — Gold’s Not Impressed!
Solid US GDP growth eases recession fears, making gold less appealing.
Strong economies often reduce demand for safe-haven assets like gold.
⚡ Trump’s Tariff Threats Stir Chaos — Gold Loves It!
Talk of new tariffs and global uncertainty keeps gold in demand.
Investors turn to gold as a hedge when trade wars heat up.
🏛️ Central Banks Hoard 900 Tonnes — Gold’s Got Backup!
Central banks are buying tons of gold to diversify reserves.
This steady demand supports higher gold prices over time.
⚡⚡So what we are Expecting .. ? ⚡⚡ Current Price around 3744.
🟢 Buy Zone (3717–3698)
Buyers waiting to load up.
3705 is the key bounce point 🔑.
🔴 Sell Zone (3777–3790)
Sellers may step in hard here.
Watch for a sharp push ⚡ into this zone before any drop.
📊 Todays possible Daily Range:-
High of the day: 3792 ⬆️
Low of the day: 3703 ⬇️
CONCLUSION :-
With today’s range between 3703–3792, price action near 3744 sits right in the middle.
Key levels: Buy Zone 3717–3698 (bounce at 3705) and Sell Zone 3777–3790.
Bias is slightly bullish 🟢, but confirmation will come only from reactions at these zones.

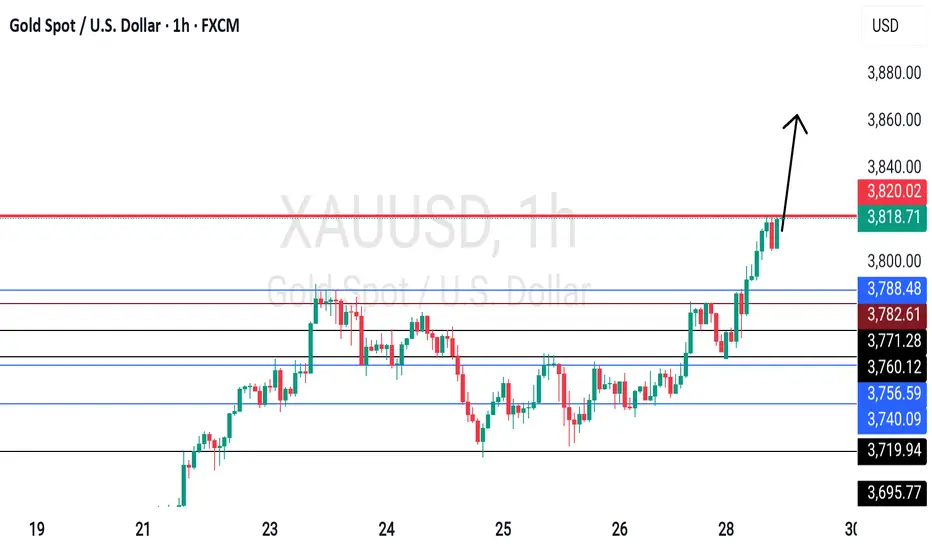
GOLD Breakout Resistance ? What's next??#GOLD.. market just broke his resistance n sustain above.
Now it should stay above 3822-14
Then further rise expected.
Good luck
Trade wisely
Selling pressure continues to adjust, reaching 3692?⭐️GOLDEN INFORMATION:
Gold (XAU/USD) slips in Friday’s Asian session, unable to build on Thursday’s rebound as strong US data lifted the Dollar to a three-week high and tempered Fed rate-cut bets. Still, losses may be limited with traders awaiting the US PCE inflation report for clearer direction.
⭐️Personal comments NOVA:
Gold price adjusted, accumulated according to 2 trend lines. Waiting for break and continue to get liquidity around support zone 3692
⭐️SET UP GOLD PRICE:
🔥SELL GOLD zone: 3788- 3790 SL 3795
TP1: $3780
TP2: $3770
TP3: $3760
🔥BUY GOLD zone: $3692-$3690 SL $3685
TP1: $3700
TP2: $3710
TP3: $3725
⭐️Technical analysis:
Based on technical indicators EMA 34, EMA89 and support resistance areas to set up a reasonable SELL order.
⭐️NOTE:
Note: Nova wishes traders to manage their capital well
- take the number of lots that match your capital
- Takeprofit equal to 4-6% of capital account
- Stoplose equal to 2-3% of capital account

Gold 30Min Engaged ( Bullish Reversal Entry Detected )Time Frame: 30-Minute Warfare
Entry Protocol: Only after volume-verified breakout
🩸Bullish Reversal - 3750
➗ Hanzo Protocol: Volume-Tiered Entry Authority
➕ Zone Activated: Dynamic market pressure detected.
The level isn’t just price — it’s a memory of where they moved size.
Volume is rising beneath the surface — not noise, but preparation.
🔥 Tactical Note:
We wait for the energy signature — when volume betrays intention.
The trap gets set. The weak follow. We execute.
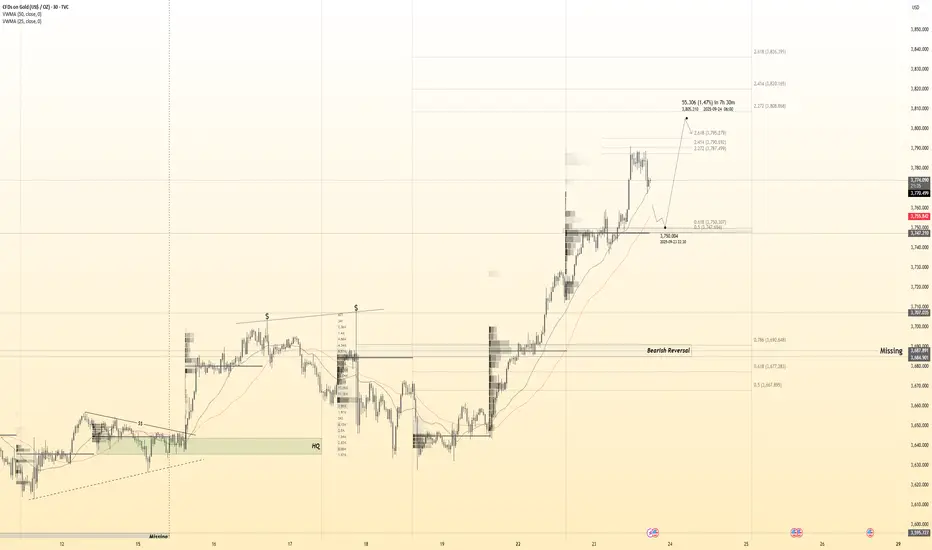
Gold Trade Plan 01/10/2025Dear Traders,
With the heavy drop that gold had yesterday, followed by a quick rebound and the formation of a new higher high, we are now approaching the end of wave 3 of the strong bullish move, and currently wave 5 of 3 is being completed.
Very soon, we are likely to see a major decline in gold toward the 3600–3700 zones.
⚠️ Buyers should be extremely cautious, as the market could reverse at any moment.
Regards,
Alireza!

Gold Prices Plunge from Historic PeakGold Prices Plunge from Historic Peak
As shown by the XAU/USD chart, yesterday gold prices reached a new all-time high, surpassing the $3,870 level for the first time. This rise was supported by concerns over the high likelihood of a US government shutdown.
According to media reports:
→ Vice President J.D. Vance stated that the US is heading towards a government shutdown, blaming the Democrats.
→ “We have very large disagreements,” said Senate Minority Leader Chuck Schumer.
Fears over the potential impact of a shutdown boosted demand for safe-haven assets, including gold. However, today XAU/USD has dropped sharply. What might this mean?
Technical Analysis of the XAU/USD Chart
In our previous analysis of gold prices, we drew an ascending channel, which remains intact.
Within the context of this channel, it is worth noting that each time the price exceeds its upper boundary, this tends to trigger a correction, a consequence of the market being overbought (in most cases confirmed by the RSI indicator).
Yesterday, during heightened activity in the US trading session, gold prices moved significantly above the upper boundary of the channel, leaving the market vulnerable to a correction. For this reason, today’s decline during the European session can be explained by traders reassessing risks, as well as profit-taking after a rise of more than 11% since the start of the month.
Note the speed of the decline — it indicates strong conviction among the bears. Overall, yesterday’s rise combined with today’s sharp fall can be interpreted as a bearish engulfing pattern. This strengthens the case for a deeper correction towards the psychological $3,800 level, where the median of the channel lies (possible support levels are marked in purple).
Therefore, it is possible that bulls exhausted their momentum yesterday, and for an upward trend to resume, another consolidation period with the formation of a “bull flag” pattern may be required.
This article represents the opinion of the Companies operating under the FXOpen brand only. It is not to be construed as an offer, solicitation, or recommendation with respect to products and services provided by the Companies operating under the FXOpen brand, nor is it to be considered financial advice.

XAUUSD--LONG--High bullish momentum
--tp and entry levels are as shown on chart
--for big picture check weekly chart I added below.

Gold 3780 can open short positionsThe gold price has now reached a key suppression point. The importance of this position has been mentioned in the previous trading opinion. A breakthrough will lead to further increases.
Despite this, I think today is not the best time for a breakthrough. There is a high probability that it will encounter resistance at this position and consolidate downwards, which will continue to wash out traders with weak wills. The upward breakthrough node can be paid attention to next week. Therefore, I plan to initiate a short position near 3775-3780.
Trading strategy: sell at 3775-3780.
If you don't have a good trading plan yet, please follow my strategy sharing. I will update my gold trading plan daily for your reference, free of charge, to help you avoid detours and turn losses into profits!