Does gold correct?
Hi my dears
After a good bullish rally in gold, we should probably see a decline and correction in gold, which of course is consistent with the fundamental news we hear about the balanced relationship between the US and China. Therefore, we should look for more sales entries.
Whenever the price of gold closes below the blue line, there is a possibility of reaching the specified prices, so we should keep an eye on the chart and open a sell trade after the specified condition is activated.
Trade ideas

XAUUSDHello Traders! 👋
What are your thoughts on Gold?
Gold has reached a key support zone after a sharp two-day drop.
From this area, we expect a corrective rebound toward the broken structure.
This retest could complete a pullback phase before the next wave of decline resumes.
A short-term rally toward the resistance zone is likely.
If price shows rejection there, the next downside targets are expected to follow.
As long as price remains below the red resistance zone, the bearish bias remains intact.
Look for bearish confirmation signals on lower timeframes before entering short positions.
Don’t forget to like and share your thoughts in the comments! ❤️

XAUUSD – Gold Eyes a Breakout Above $4,030: Momentum Still Build🟢 XAUUSD | Gold Breakout Setup – Educational Analysis
Gold continues to show constructive price action following sustained bullish momentum across intraday timeframes. After a healthy consolidation phase, the market is now testing a critical resistance zone around $4,030.
A clean breakout and confirmed 1H close above $4,030 would signal renewed strength, aligning with the broader bullish structure observed on higher timeframes (4H & Daily).
🔹 Technical Outlook
The current structure suggests the potential for continuation toward higher liquidity zones if the breakout holds.
Sustained trading above $4,030 would confirm buyer control, invalidating the short-term correction phase.
📈 Trade Plan (Educational Setup)
Entry (Buy Stop): $4,030
Stop Loss (SL): $4,000
Take Profit Targets (TP):
TP1 → $4,060
TP2 → $4,090
TP3 → $4,120
TP4 → $4,150
TP5 → $4,180
TP6 → $4,210
💡 Analyst’s Commentary
This setup aims to capture the potential breakout continuation, with risk contained below the $4,000 psychological support.
Momentum confirmation on H1 and H4 closes will be key for trade validation.
Traders may consider partial profit-taking along the way and trailing stops to secure gains.
⚖️ Risk/Reward: ≈ 1 : 3.5
🕓 Timeframe: H1 – Short-Term Swing
⚠️ Disclaimer:
This analysis is shared for educational and research purposes only as part of Middle East Trading Academy’s ongoing market study.
It does not constitute financial advice or an investment recommendation.

$GOLD is COOKED! Rotation into $BTC Soon!!MARKETS ARE SIGNALING RISK-ON 🔥
TVC:GOLD is so unbelievably COOKED 👨🍳
3 Black Crowes printed on the Daily, with a decisive close below the 20MA 🗡️
Waiting on the final nail in the coffin to close below the DANGER ZONE ~$3,900 where we will then see GOLD retest the 50MA along with the 50% Gann retrace $~3,750 ⚠️
I very much expect the rotation into CRYPTOCAP:BTC soon 👑

Gold Intraday Trading Plan 10/28/2025Gold being very naughty yesterday has just broken 4000, which is a very strong support. I am expecting it continue to drop today. I will look to sell from 4000. My first target is 3950 and ultimate target for today is 3850.

Gold finally has a supply range! Time for bullish correction?I talked about everything but the obvious inverse head and shoulders/Quasimodo forming the right shoulder now. If everything goes right can we expect an arm to extend upwards here during the stochastic buy cycle?
Let me know what you think and be sure to share and care for others if you found this helpful.
Also talked about the "REAPER WARNING" as we have a reaper inversion range actively terrorizing price 🧩

LiamTrading - XAUUSD: SCENARIO BEFORE FOMC LiamTrading - XAUUSD: SCENARIO BEFORE FOMC - $3840 Level Awaits Bottom Fishing Reaction Wave
Hello traders community,
The Gold market is showing a strong and sustainable downtrend. We are witnessing a crash after prices broke through key support zones. With the upcoming FOMC event, our strategy is to seek Buy opportunities at deep liquidity zones and continue Selling when prices recover to retest the broken trend.
📰 MACRO ANALYSIS & CASH FLOW CONTEXT
Gold is currently under dual pressure:
Downward Pressure 🔴: Optimism about the US-China trade progress has significantly weakened the demand for Gold, a safe-haven commodity. Spot Gold prices have fallen below $3950, hitting a three-week low, down about 0.78% on the day (28/10).
Short-term Support 🟢: Bets on the possibility of a Fed rate cut continue to weaken the US Dollar (USD), which is the only factor that could potentially support this precious metal.
Conclusion: This tug-of-war makes it difficult to determine the bottom. The bearish scenario remains the top priority.
📊 TECHNICAL ANALYSIS: THE DOWNWAVE CONTINUES
Based on the H4 chart (image_5fa7fa.png):
Current Trend: The price has successfully broken through the key liquidity support zone near $3950 and is continuing its downtrend.
Current Fibonacci Level: The price is touching and reacting at the 1.618 Fibonacci zone (around $3950).
Next Level: The next level Gold is targeting will be the 2.618 Fibonacci zone (around $3840), which is a large liquidity area expected to see a strong reaction.
Main Strategy: We focus on two scenarios: Bottom fishing reaction at 3840 and continuing to Sell when the price recovers.
🎯 DETAILED TRADING PLAN (ACTION PLAN)
We have two detailed scenarios based on the current price level:
🟢 BUY Reversal Scenario
We wait for the price to hit the deep liquidity bottom zone of 3840 to execute a buy order with the expectation of a technical recovery.
Entry Zone: 3840
Stop Loss (SL): 3832 (tight SL)
Take Profit Targets (TP): TP1: $3872 | TP2: $3898 | TP3: $3925 | TP4: $3950
🔴 SELL Retest Scenario
If Gold recovers without breaking the downtrend structure:
Entry Zone: Watch for a Sell retest at $4091
Stop Loss (SL): $4099
Take Profit Targets (TP): TP1: $4065 | TP2: $4033 | TP3: $4004 | TP4: $3965
SUMMARY & DISCIPLINE (Steven's Note)
Gold is in a strong fall ahead of the FOMC, with significant volatility expected. Capturing deep Fibonacci and Liquidity zones is key.
Note: Always adhere to the set Stop Loss. Capital management is the number one priority, risking only 1-2% of the account per trade.
Wishing traders a successful and disciplined new trading week!

n' Nothin but airas you all know gold has just started a long term bullish movement and i believe the main target is 2500 $
soon will touch this area
regards

Update before New York sessLet's see how it goes.
Price break the support zone, turning it into a resistance zone.
Expecting a retracement before potential drop during the New York session.
Or eventually breaking resistance and pushing further up.
Stay tuned for next update.
@TeamWeprint

Lingrid | GOLD Weekly Support Hold Long OpportunityOANDA:XAUUSD pulled back sharply from the resistance and printed a higher low right at the confluence of the uptrend and above previous week low 4,050. Structurally, the broader upward channel remains intact while price retested the downward trendline from above, keeping the higher-low sequence alive. If 4,000–4,050 support continues to hold, it favor a rebound toward 4,245 and, if momentum extends, a run at 4,400; a daily close back below 4,043 would defer the bounce. Broader momentum still skews bullish with successive higher lows, suggesting the recent drop is a corrective pullback within the trend rather than a top.
⚠️ Risks:
A decisive break below 4,000 that invalidates the uptrend confluence could extend losses toward 3,950–3,900.
Strong USD and higher real yields on hawkish Fed rhetoric/data may cap upside or accelerate downside.
Diminishing geopolitical risk or risk-on equity strength could sap haven demand for gold.
If this idea resonates with you or you have your own opinion, traders, hit the comments. I’m excited to read your thoughts!

Gold Pullback: Technical Correction Keeps the Main Trend IntactHello everyone,
Gold is currently trading around 4,112 USD on the H4 chart after a fairly deep correction. Many traders seem concerned seeing strong selling pressure, but a closer look at price action reveals this is merely a technical pullback, not a signal of a long-term trend reversal.
After the parabolic surge, gold paused due to profit-taking. The dense Fair Value Gaps (FVG) in the 4,050–4,130 USD area indicate plenty of “unfinished business” — liquidity has not been fully tested, stop-losses not swept, supply and demand not fully balanced.
The 4,050 USD zone is key support, both technically and psychologically for buyers. Holding above this level preserves the H4 uptrend structure. Meanwhile, the 4,130 USD zone presents a short-term resistance — FVG combined with the Ichimoku cloud — and gold must decisively handle this region to continue higher.
From the news perspective, the market is caught between two forces: anticipation of Fed rate decisions and the upcoming US CPI, which could trigger volatility; versus easing US–China tensions, temporarily reducing safe-haven demand. The recent selling was mostly profit-taking after a 5.5% rally earlier this month; buyers haven’t exited, they are merely reorganising positions before returning.
My preferred scenario: gold retests 4,050–4,070 USD, sweeps remaining liquidity, and then bounces to test 4,130 USD. Only if 4,050 USD breaks with high volume would the market likely head toward 4,000 USD, where buyers will defend aggressively. If it holds, a recovery is expected and gold could target higher levels.
Do you see this as a normal pullback or a precursor to a sharp drop? Share your thoughts below.

Gold Bull Market Outlook And Targets: 5000 USD/7500 USDGold Bull Markets Long Term Overview and 2025 Market Update
________________________________________
🌊 Five-Wave Roadmap — Targets & Timing
• Wave 1 (2016–2020): From ~$1,050–1,200 to the COVID-era spike; established secular up-trend.
• Wave 2 (2020–2022): Consolidation/corrective pullback (~–20%).
• Wave 3 (2023–2025/26): Power leg to ATHs (current). Room to extend toward $4,200–$4,500 on flow surges before pausing.
• Wave 4 (2026, base case): Re-accumulation/consolidation ~12 months; likely range-bound –10% to –15% from the Wave-3 peak as institutional buying digests gains.
• Wave 5 (2027–2030/32): Final thrust to the cycle’s terminal zone:
– First objective: $5,000–$5,500 (consistent with 2026 Street “bull wave” scenarios).
– Terminal extension: $7,500–$8,000 by 2030–2032 (our desk’s stretch path if real yields stay muted, official-sector demand persists, and private capital rotation broadens).
Why Wave-4 can last ~12 months: prior secular bulls often paused for a full year near major breakouts while flows “change hands.” Expect lower realized vol, fading retail FOMO, and steady official accumulation to define the tape.
📈 Top 10 Stats of the Current Bull 2025
1. Price & ATHs: Spot ~$3.75–$3.79k; fresh ATH $3,790.82 on Sep 23, 2025.
2. 2025 YTD: Roughly +40–43% YTD
3. Central Banks: 1,045 t added in 2024 (later revised to ~1,086 t as lagged data came in). H1/Q1’25 tracking remained elevated.
4. ETF Flows: Back-to-back strong quarters; Q2’25 total demand 1,249 t, value US$132bn (+45% y/y) with ETFs instrumental.
5. Gold vs Equities: Gold ≈+40% vs S&P 500 ≈+13% total return YTD.
6. Jewelry Demand: Tonnage softened as prices surged; value at records (2024 down y/y; weakness persisted into H1’25).
7. Gold–Silver Ratio: ~85–88 (silver torque improving as it pushes into the mid-$40s).
8. Macro Link: Safe-haven bid + expected policy easing keep real-yield headwinds contained.
9. Technical: Confirmed 13-yr cup-and-handle breakout (Mar ’24) underpinning trend.
10. Street Forecasts: GS baseline $4,000 by mid-’26; bulled-up houses (HSBC/BofA) flag $4.9–$5.0k potential into 2026 if private/ETF rotation persists.
• This cycle is different: record central-bank buying + renewed ETF inflows + lower real rates = powerful tailwind.
• Price: Gold notched fresh ATHs this month (up to $3,790.82). 2025 is shaping up as the strongest year since the late 1970s.
• Relative: Gold is crushing equities YTD (≈+40% vs S&P 500 ≈+13% total return).
• Setup: A 13-year “cup-and-handle” breakout in 2024 kick-started the move.
• Outlook: Street base cases cluster near $4,000 by mid-’26; several houses now publish $4,900–$5,000 stretch targets into 2026 as flows accelerate.
________________________________________
🏆 Historic Gold Bull Markets — Timeline & Stats
1. 1968–1980 “Super Bull”
• Start/End: ~$35 → $850 (Jan 1980)
• Gain: ~2,330%
• Drivers: End of Bretton Woods, oil shocks, double-digit inflation, geopolitical stress.
• Drawdown: ~–45% (1974–1976) before the final blow-off run.
2. 1999–2011/12
• Start/Peak: ~$252 (1999) → ~$1,920 (2011–12)
• Gain: ~650%
• Drivers: Commodities supercycle, EM demand, USD weakness, GFC safe-haven bid.
3. 2016/2018–Present (The “CB-Led” Cycle)
• Start Zone: $1,050–$1,200 → New ATH $3,790 (Sep 2025)
• Gain: ~215–260% (depending on 2016 vs 2018 anchor)
• Drivers: Record central-bank accumulation, sticky inflation/low real rates, geopolitics; 2024 13-yr base breakout.
________________________________________
📊 At-A-Glance Comparison (Updated 2025)
Metric | 1968–80 Super Bull | 1999–2012 | 2016/18–2025 Current
🚀 Total Gain | ~2,330% | ~650% | ~215–260% (so far)
⏲️ Duration | 12 yrs | 13 yrs | 7–9 yrs (ongoing)
💔 Max Drawdown | ~–45% (’74–’76) | ~–30% (’08) | ~–20% (2022)
🏦 Main Buyer | Retail/Europe | Funds/EM | Central Banks
🏛️ Pattern | Secular parabolic | Cyclical ramps | 13-yr base → breakout (’24)
Notes: current-cycle characteristics validated by WGC demand trends & the 2024 technical breakout.
________________________________________
________________________________________
________________________________________
🔄 What Makes This Bull Different 2025 Edition
• 🏦 Central-Bank Dominance — Third consecutive 1k+ tonne year in 2024; 2025 is still tracking strong on a run-rate basis. This “sticky” demand is from price-insensitive reserve managers.
• ⚡ Faster Recoveries — Drawdowns are shallower/shorter vs the 1970s analog, consistent with a structural rather than speculative buyer base.
• 📈 Coexisting With Risk Assets — ATHs with equities positive YTD = macro hedge + diversification bid, not just “panic buying.”
• 📐 Structural Breakout — 13-yr base cleared in 2024; market now in multi-year price discovery.
________________________________________
🎯 Strategy Ideas 2025 & Beyond
• Buy/Hold on Dips: Stagger entries (DCA) into physical (allocated), ETFs (e.g., GLD/IAU), and quality miners/royalties.
• Prefer Physical/Allocated where counterparty risk matters; use ETFs for liquidity and tactical tilts.
Satellite/Leverage
• Silver & GSR Mean-Reversion: With GSR ~85–88, silver historically offers torque in up-legs. Pair with high-quality silver miners.
• Factor Tilt in Miners: Prioritize low AISC, strong balance sheets, reserve growth, rule-of-law jurisdictions; emphasize free-cash-flow yield and disciplined capex.
Risk-Management
• Define max drawdown per sleeve; pre-plan trims near parabolic extensions or if macro invalidates (e.g., real-yield spike).
• Use options overlays (collars on miners; long-dated calls on physical proxies) to shape payoff in Wave-3 late innings and Wave-4 digestion.
________________________________________
🧪 Reality Check: What Could Invalidate the Bull?
• Real yields + USD rip higher (sustained) → compress gold’s opportunity cost.
• Official-sector buying stalls (policy or FX-reserve shifts) → removes the anchor bid.
• Growth re-acceleration + faster-than-expected disinflation → weaker safe-haven + fewer rate cuts.
• Technical break: a persistent move below ~$3,600–3,700 would question Wave-3 extension and pull forward Wave-4.
________________________________________
🧭 Quick Reference Tables
🧾 Summary: Historic vs Current
Feature | 1968–80 | 1999–2012 | 2016/18–2025
Total Gain | ~2,330% | ~650% | ~215–260%
Duration | 12 yrs | 13 yrs | 7–9 yrs (ongoing)
Correction | ~–45% | ~–30% | ~–20% (’22)
Main Buyer | Retail/Europe | Funds/EM | Central Banks
Pattern | Parabolic | Cyclical | Cup & Handle → Secular
🧩 “If-This-Then-That” Playbook
• If real yields fall & CB buying persists → Ride trend / add on consolidations.
• If USD + real yields jump → Trim beta, keep core hedge.
• If GSR stays >80 with silver momentum → Overweight silver sleeve for torque.
________________________________________
🔚 Key Takeaways Updated
• Twin pillars: relentless official-sector demand + 2024 structural breakout.
• Base case: Street ~$3.7–4.0k by mid-’26 with upside to $4.5–5.0k on accelerated private/ETF rotation.
• Roadmap: Extend Wave-3 → Wave-4 re-accumulation (~12 months) → Wave-5 to $5,000–$5,500, then $7,500–$8,000 by 2030–2032 under favorable macro/flow dynamics.
• Operating stance: keep core, add on dips/sideways phases, manage beta and drawdowns proactively.

GOLD WEEKLY CHART MID/LONG TERM ROUTE MAPHey everyone,
Please check out our updated Weekly Chart Route Map, featuring updated revised key levels after completion of our last long term weekly chart idea for precise level-to-level tracking.
We’ve refreshed our long-term structure on the weekly chart. Price action recently rejected the 4294 level and is now range-bound between 4284 (resistance) and 4059 (support). This consolidation aligns with a detachment from the EMA5, highlighted on the chart with a circle. Even if a full detachment doesn’t materialize, a partial (halfway) correction remains the more probable scenario.
To determine the next directional move, we’ll need a decisive test and break of either boundary level. On the broader horizon, 3006 stands as the long-range pivotal swing zone, which may come into play if a major correction unfolds.
🔹 Note: The key distinction between a retracement range and a swing range is that swing ranges typically produce larger bounces and wider price reactions compared to standard retracement ranges.
We’ll continue to update this outlook throughout the week as the structure develops. Thank you all for your likes, comments and follows, we really appreciate it!
Mr Gold
GoldViewFX

Gold Eyes 4,010 Support Ahead of CPI – Big Move Loading?Hey Traders,
In tomorrow’s trading session, we’re monitoring XAUUSD for a potential buying opportunity around the 4,010 zone. Gold remains in a broader uptrend and is currently in a correction phase, approaching a key support and resistance confluence around 4,010 that aligns with the ascending trendline.
Market Focus:
All eyes are on tomorrow’s U.S. CPI release, with expectations for headline inflation at 3.0% and core at 3.1%. A softer-than-expected print could weigh on the U.S. Dollar, potentially igniting fresh momentum for GOLD to resume its bullish trend.
Next Move:
Watching price action around 4,010 closely — if CPI data confirms disinflation, we could see a strong rebound toward recent highs as safe-haven demand strengthens.
💬 What’s your take on the CPI? Are you positioning long or waiting for confirmation? Drop your thoughts below!
Trade safe,
Joe

GOLD HIGH PROBABILITY SETUP SOON!!! 🚨 XAUUSD HIGH PROBABILITY BUY SETUP 🚨
* Here We Can See Clearly The Next Potential Moves For GOLD Coming Hours/Days.
* Keep Your Eyes Close On Your Trading Positions.
* Happy PIP Hunting Traders.
FXKILLA.

Gold 1H – Bearish Reaction After Consecutive Gains🟡 XAUUSD – Intraday Trading Plan | by Ryan_TitanTrader
📈 Market Context
After several sessions of steady gains, gold is showing signs of exhaustion as U.S. Treasury yields stabilize and traders reassess the Federal Reserve’s next move.
The market’s focus today is on U.S. housing data and Fed officials’ remarks, which could shape expectations for the December policy outlook.
• A hawkish tone from policymakers may strengthen the dollar and pressure gold lower.
• Conversely, softer remarks could briefly trigger buying around key discount zones, but the overall tone remains corrective after the recent rally.
Market liquidity is concentrated near the $4,230 area — where price may tap into unmitigated supply before continuing its bearish leg.
🔎 Technical Analysis (1H / SMC Style)
• Structure: The overall bias has shifted bearish following consecutive ChoCH and BOS formations.
• Premium Zone: The 4,230–4,228 area aligns with an H1 order block and previous liquidity pool — a prime zone for short re-entry.
• Liquidity Sweep: The recent upside push toward 4,230 may sweep late buyers before the next bearish leg unfolds.
• Discount Zone: Short-term liquidity may rest around 4,080–4,100, which aligns with previous sell-side imbalance (SSI) and acts as an intraday reaction zone.
🔴 Sell Setup
• Entry: 4,230 – 4,228
• Stop-Loss: 4,240
• Take-Profit Targets: 4,100 → 4,080 → 4,050+
🟢 Buy Scalp Setup (Short-Term Countermove)
• Entry: 4,081 – 4,083
• Stop-Loss: 4,074
• Take-Profit Targets: 4,100 → 4,115
(Only valid if liquidity sweep confirms reaction within discount zone)
⚠️ Risk Management Notes
• Confirm M15 BOS/ChoCH before entry — avoid blind orders during news.
• Reduce position size for scalp entries; primary directional bias remains bearish.
• Lock partial profits near first liquidity targets and trail stops as structure confirms continuation.
✅ Summary
Gold faces near-term correction pressure after multiple bullish sessions.
The 4,230–4,228 zone offers a clean premium OB entry for continuation shorts, while reactive buyers may scalp intraday from 4,081 if liquidity sweeps occur.
Stay adaptive — today’s sentiment is short-term bearish within a larger range-bound structure.
FOLLOW RYAN_TITANTRADER for daily SMC setups ⚡

Gold key Levels (3800-4100)These are the Gold key levels which I’ll be using for trading.
Here’s how I trade these levels:
- Close above a level → Buy setup
When a candle closes clearly above a level, it confirms bullish momentum and I look to enter long immediately after the close.
- Close below a level → Sell setup
A confirmed candle close below support signals bearish strength, and I enter short right after the close.
- Rejection from a level → Opposite trade
If price shows a strong rejection from a level, I trade in the opposite direction - rejection from resistance = sell setup, rejection from support = buy setup.
These levels works well for both day trading (using 1H candles) and scalping (using 15M or lower timeframes). It keeps trading simple, just reactions to market behaviour.

XAUUSD: Final Dip Before RallyGold has completed its major 5-wave rise and is now finishing a corrective W-X-Y pattern. The recent drop looks like the final leg of this correction, meaning sellers are getting weaker. Price may show a small bounce up and then one last dip to complete the correction. After that final drop, a strong new uptrend is expected to start again. In short: correction ending soon, last dip big bullish move ahead.

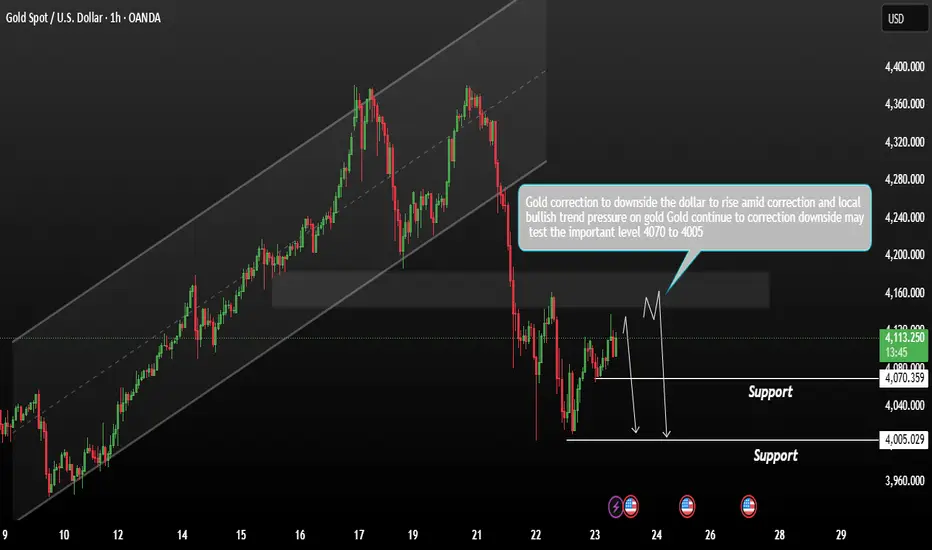
Gold forming a consolidation range What should Next?Gold prices continue to correct to the downside, forming a consolidation range near current levels. The market remains supported, but momentum is weakening as the US Dollar strengthens amid a local bullish trend.
As long as the dollar maintains its upward correction, downside pressure on gold is likely to persist. a break below the trading range support could trigger further declines toward the 4,070 4,005 zone (support area). This level may act as a potential retest zone for buyers. For now, it’s best to wait for price action to slow down near the lower boundary of the range before considering new trades — patience and confirmation are key to avoid false breaks.
You may find more datils in the chart,
Trade wisely best of Luck Buddies.
Ps; Support with like and comments for better analysis Thanks for Supporitng.
XAU/USD Completing Wave Y: Final Dip Before RallyGold has completed its major 5-wave rise and is now finishing a corrective W-X-Y pattern. The recent drop looks like the final leg of this correction, meaning sellers are getting weaker. Price may show a small bounce up and then one last dip to complete the correction. After that final drop, a strong new uptrend is expected to start again. In short: correction ending soon, last dip big bullish move ahead.
Stay tuned!
@Money_Dictators
Thank you :)

Gold is Targeting #5,100.80 benchmark / Medium-termGold's Short-term: Gold reached my personal maximum (regarding Short-term of course) of almost invalidating #4,400.80 benchmark / both Short and Medium-term Buyers / investors started taking Profits and as Naturally, asset cannot only Trade in one direction, Gold dipped creating aggressive Descending Channel and is now testing the Lower Low’s pressure point. However, #4,000.80 is very strong Support zone for the fractal which won't be invalidated without serious cause and even with Short-term development (due current decline) Investors drawing capital from Gold to more riskier assets - I doubt Gold has more potential to go Lower below my Support zones on the chart regarding Short-term. The current Selling accumulation pattern on Hourly 4 chart is now on total Neutrality but attempting to break towards last week’s Lower Low's. Current Fed loan climate is Gold friendly as Gold often demonstrates resilience during early phases of Fed tightening cycles before investment flows adjust to Higher Rates. If Rates go down more aggressively, Gold will soar more (another reason why I am Bullish on Gold).
#MA50 and #MA200 observation: Keep both lines on your Weekly (#1W) chart, as they are pointers for Long-term. As Long as Gold is Trading above them, Bullish Long-term stance remains and Gold will Target upper levels.
Fundamental commentary: Gold was Trading on #1,800.80 on mid-October #2023 Year, and currently tested #4,400.80 benchmark which records one of the most aggressive rises of Gold in history. It was up almost (# +65.00%) lately / when confidence in financial system is on a decline (which is the case in current and last few Years), Gold is soaring as hedge. U.S. Dollar just had one of its weakest first halves in #50 Years, down more than (# -10.00%) against other major currencies. Massive debt (# 315 trillion globally), rising government spending and tariff regulation and impact on the markets have shaken confidence in the system world-wide. When U.S. Dollar weakens, Investors are in search of asset that feels more stable to store their money / it is always one and almost only option - Gold. In addition, Central banks have been Buying Gold in bulk / over #1,000 tons annually for the past #3-Year fractal, most since #1,967 Year which is not surprise or weird / something is going on. Part of that started with Middle East conflict escalation #2,023 Year, U.S. freezing #300 million Russian reserves in #2,022 Year, showcasing other countries that their Dollars can be shut off as political leverage.
Recapitulation: Segment which makes the almost (# +65.00%) increase on Gold unusual is that both Gold and Stock markets are both hitting record Highs at the same time. Institutions are still sitting on trillions in cash. Many are still not deciding to go "all in" on Stocks at these levels. Also on the contrary, they also don't want to lose to Inflation sitting on the sidelines / so they're parking most of the money in Gold as a temporary middle ground and that demand is helping push Gold Higher from big institutions, and also independent Investors world-wide. Even with all the questions and uncertainty right now, keep this in mind: Gold is used to protect wealth, not grow it. Gold usually spikes when confidence in the financial system drops, but it can dip just as fast once confidence returns. In #1,980 Year, Gold hit a record of #850.80 per ounce then dropped (# -50.00%) by #1,982 Year. After peaking at #1,920.80 in #2,011 Year, it took nearly a decade to recover and if full confidence returns, Gold may fall fast as mention above, however confidence for financial system is far from delivered or happening.
My personal thoughts: All Traders are well aware that I am well known Seller of the market however what made me triple my account, is switching to being a Bull in recent times as Trading against the trend is disastrous for a Trader. I do believe that even if Gold dips, near Lower Low's is maximum as illustrated on my chart and #5,100.80 benchmark is my next point of interest and my next Medium to Long-term Target. #6,100.80 - #6,200.80 represents Ultimate Top's for now and stabilization zone where another aggressive dip is possible, fuel only for Gold to soar further. I do believe Financial system is about to collapse even more and with ever-growing Inflation world-wide, Gold will skyrocket and I am here to Buy it / Trade it even more than ever, expecting my Targets to be met. Remember, trend is your friend and hope all of Sellers which got liquidated accounts, sending me many messages will turn their Technicals and finally start Buying Gold. Yours, goldenBear88

Gold/Copper Signaling Recession & Market Super bubble!We're continuing to see extreme signals from Gold, and that should raise concerns.
Earlier, I highlighted the Gold/Oil ratio — now, I want to draw your attention to the Gold/Copper ratio:
🔗
Historically, such extreme readings in the Gold/Copper ratio have consistently preceded recessions. The only exception? A period of economic stagnation and sideways markets — not exactly a bullish outcome. See the chart from 2014 to 2016
🔗 www.tradingview.com
Quick recap:
Gold = Fear + Inflation hedge
Copper = Economic strength + Inflation signal
Oil = Similar to Copper; reflects growth and inflation expectations
These divergences aren't random — they’re warning signs of a recession & market Super Bubble that's about to POP!
These are not random fluctuations of prices. You can choose to view them as such. I get it. But from a macroeconomic perspective, this is bad JUJU!
Capitalism without failure is like religion without hell! Remember that!
Click boost, like, and subscribe! Let's get to 5,000 followers! ))

Xauusd Focus ShortOn the XAU/USD chart, the hourly timeframe is currently in a downtrend, while the daily timeframe remains in an uptrend.
Therefore, the decline seen on the hourly chart represents a pullback within the broader daily uptrend.
Once this pullback completes, the daily trend is expected to push toward a new all-time high (ATH) before entering a longer-term correction phase.
Given this context, the current pullback could extend for several thousand points, so the focus should remain on short positions (sell setups) during this retracement phase.
