XAUUSD on swing After the FOMC market makes implusive fall after rates Cut.
What are my conditions For This setup?
Currently i m looking for again buy trade from 3935-3945 zone .
I expecting the market has to rise at these points.
H1-H4 candle closing should be above 3930.
Targets: 3995- 4025.
✳️Secondly if H4-H1 candle closes below 3930-3920 our buying will be compromised & and I wil lwait for next confirmation
Trade ideas

Balances and Imbalances in Gold🔴 Why Point of Control (POC) Acts as Strong Support or Resistance to Create a Balance
In a Volume Profile, the Point of Control (POC) represents the price level where the highest traded volume occurred during a specific period. This level attracts attention because it reflects the fairest price accepted by both buyers and sellers.
➥ In an Uptrend:
When the market is trending higher, previous POCs often act as strong support zones. Traders who missed earlier entries tend to buy when price revisits these high-volume levels, believing them to be fair-value areas within the broader uptrend. Moreover, institutional participants often reload positions near the POC since liquidity is abundant there.
In short, when price revisits a past POC during an uptrend, demand tends to emerge again, creating a bounce from that level.
➥ In a Downtrend:
Conversely, in a downtrend, previous POCs act as strong resistance zones. What was once a fair price for buyers now becomes a fair price for sellers. Market participants who were trapped at higher levels use these zones to exit or add fresh short positions. Thus, when price rallies toward a prior POC, supply often re-enters, leading to rejection or a pullback. In this backdrop, let's discuss Gold chart.
🔴 Gold Chart Analysis in This Context
In the above 1H chart of Gold, the relationship between price and POC is clearly visible.
➥During the earlier part of the chart, Gold is in an uptrend. Each time the price retraced, it found support around the previous session’s POC. These levels acted as liquidity zones, where strong buying interest reappeared, helping the price continue its upward leg. This repetitive structure created a classic “staircase” pattern - each rally was followed by a controlled pullback to the prior POC, confirming the zone as a demand base.
➥However, as momentum shifted, Gold entered a downtrend. In this phase, the same POC logic flipped - price began reacting bearishly around previous POCs. Each time the market attempted to rally, it stalled or reversed near those old value areas, signaling that sellers were defending the former fair-value levels. This behavior turned prior supports into resistance shelves, reinforcing the bearish control.
➥Currently, price seems to be retesting one such POC zone near the $4000 zone. If sellers maintain control, the next leg lower could unfold toward the next lower-volume pocket or untested POC zone. But before that we need some sign of weakness near 4000- shortening of the thrust/lack of buying interest/impulsive selling etc. before pulling the trigger or else 4125 to 4150 might be on the cards.
What do think at this point? Will it pass through the resistance zone or react sharply back to 3900.
Do comment and 🚀

XAU/USD: Bearish Decline to 3827?OANDA:XAUUSD is exhibiting bearish momentum on the 1-hour chart , with price respecting a downward trendline and pulling back toward the EMA 50 (1H) as dynamic resistance, creating a prime short opportunity near the highlighted entry zone amid ongoing consolidation. This setup suggests continuation of the downtrend if sellers push through toward lower supports. 🎯
Entry zone between 3979-4020 for a sell position. Target at 3827 near the support and take profit zone, yielding a risk-reward ratio greater than 1:2.5 . Set a stop loss on a close above 4035 to manage risk. 🌟 Await confirmation with a bearish close below the entry and rising volume, tapping into gold's sensitivity to USD strength.
Fundamentally , this week features the FOMC meeting on October 29, where the Fed's rate decision could bolster the dollar if hawkish tones prevail. Additionally, outcomes from the ongoing Trump-Xi trade talks—kicking off this week in Asia—could spark major market volatility, potentially pressuring gold if a US-China deal materializes. 💡
📝 Trade Plan:
🎯 Entry Zone: 3979 – 4020 (short setup near resistance)
❌ Stop Loss: Close above 4035
✅ Target: 3827 (support / take-profit zone)
💎 Risk-to-Reward: Greater than 1:2.5, offering an excellent downside opportunity for disciplined traders.
What's your view on this gold drop? Comment below! 👇

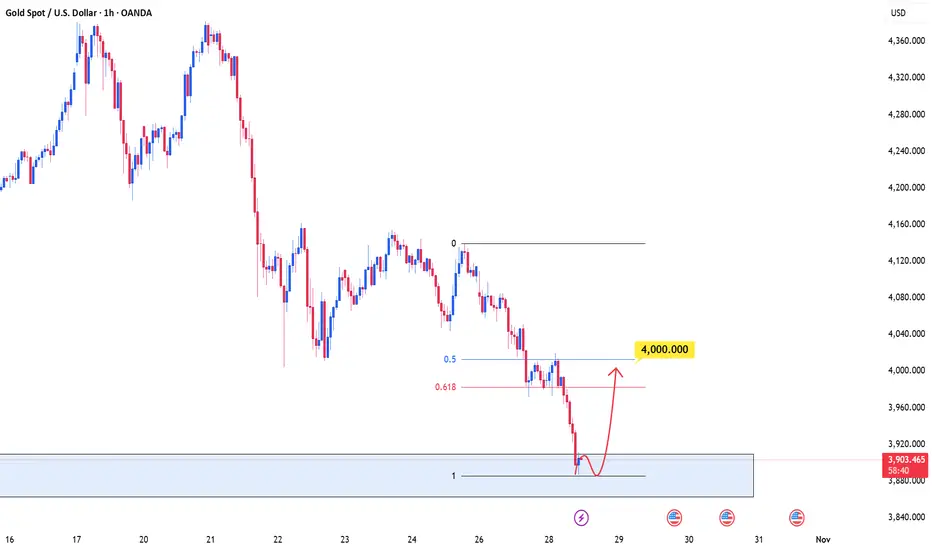
GOLD will return to the Fibonacci level after a sharp declineOANDA:XAUUSD The price recently experienced a sharp sell-off and, after being strongly rejected at a key resistance level, is now entering a stabilization phase. We’re currently in a consolidation phase, where the selling pressure is gradually subsiding.
If buyers can hold this level and push the price higher, the next target will be the Fibonacci retracement zone of 0.5–0.618, ranging between 4,000 and 4,020. This is a critical area, as it could mark the point where sellers may re-enter the market, creating further fluctuations.
Wishing you all successful trades and substantial profits!
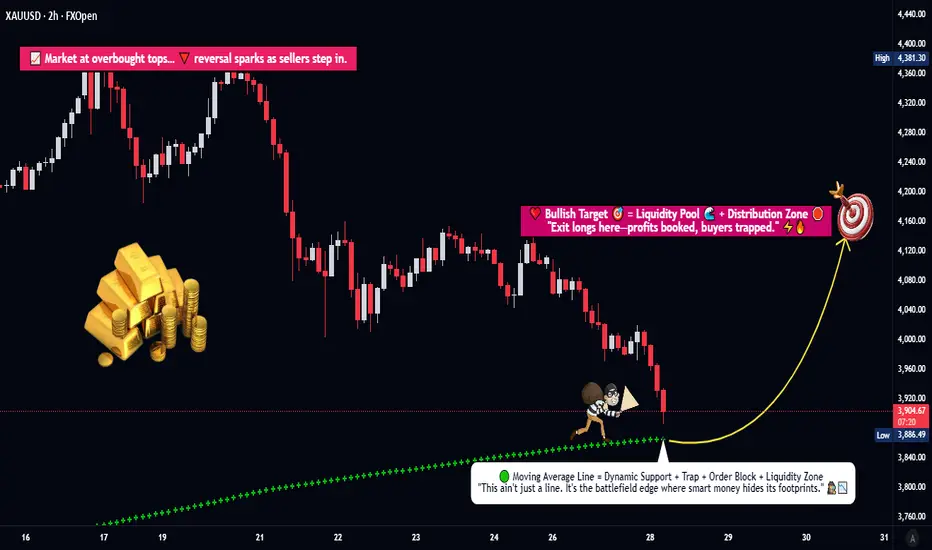
Is This the Start of Gold’s Next Major Upswing?🦸♂️ Title: XAU/USD Heist: The Golden Pullback Play (Swing/Day Trade) 💰
📈 Executive Brief (The "Why")
The shiny rock is pulling back to a key support zone! We're looking for a potential bullish continuation swing. The plan is to catch the dip as it retests a dynamic support level, aiming for a ride back up to a major resistance area. This is a classic "buy the dip" setup in a structurally strong asset.
🎯 The Trade Plan (The "How")
Asset: XAU/USD (Gold)
Bias: Bullish
Strategy: Pending Order on a Pullback
📍 Entry Zone:
YOU CAN ENTER THE MARKET AT ANY PRICE LEVEL AFTER THE WEIGHTED MOVING AVERAGE PULLBACK @ ~3860.00
(Look for a bullish rejection candle or momentum shift confirming the bounce)
🚨 Stop Loss (The "Escape Route"):
This is thief SL @ ~3760.00
Place your SL after the breakout I mentioned price level. This level is below the recent swing low, invalidating the bullish structure if breached.
🎯 Take Profit (The "Cash Out"):
OUR target @ ~4150.00
This aligns with a strong resistance + overbought + trap is there so kindly escape with profits. We're taking profits before price potentially reverses.
⚖️ Risk & Reward Management (The Fine Print)
Note to the Thief OGs: Dear Ladies & Gentleman, I am not recommending to set only my SL & TP. It's your own choice. You can make money, then take money at your own risk. Manage your position size accordingly! The provided levels are a framework, not a financial command.
🌍 Related Pairs to Watch (The Intel)
TVC:DXY (U.S. Dollar Index): Gold's arch-nemesis! 👊 A weaker DXY often means a stronger Gold price. Watch this for correlation cues.
$EUR/USD: The biggest component of the DXY. A strong Euro often pressures the Dollar, which can boost Gold.
$XAG/USD (Silver): Gold's volatile cousin. Often moves in the same direction but with more amplitude.
AMEX:GLD / AMEX:IAU : Gold ETF proxies; they track the physical metal's price.
Key Correlation Point: Gold is typically inversely correlated with the U.S. Dollar. Keep one eye on the Dollar Index for confirmation of your Gold trade's direction.
✨ Community Boost
“If you find value in my analysis, a 👍 and 🚀 boost is much appreciated — it helps me share more setups with the community!”
#Gold #XAUUSD #Trading #SwingTrading #TechnicalAnalysis #Finance #Pullback #WMA #DXY #Forex
Strategic positioning ahead of the Fed decision
News:
The Federal Reserve's interest rate decision is poised to trigger significant market volatility today.
Gold prices remain bearish after three consecutive days of declines. The Fed will announce its monetary policy decision on Wednesday.
This week's expectations for the Fed meeting focus on two points: a 25 basis point rate cut, and, given the growing disagreement among policymakers regarding the future path of interest rates, Powell is unlikely to provide any clear guidance.
Powell hinted earlier this month that the FOMC will continue to focus on threats to the labor market. Last week's weaker-than-expected inflation report may temporarily dampen hawkish rhetoric within the Fed regarding inflation.
Due to the US government shutdown, Fed officials have been unable to obtain complete data on the labor market since early September.
Specifically:
Gold prices have fallen below $4,000/oz. In the coming weeks, gold prices may fall further towards the $3,850-$3,800/oz range. Unless a strong rebound occurs, the short-term outlook remains bearish.
Looking at the 4-hour chart, gold prices previously fell along a descending slope from a high of $4,155, reaching a low of $3,886 before forming a V-shaped rebound. During this rebound, Fibonacci retracement levels formed a clear "stepped resistance-support" pattern.
If inflation subsequently rises, or the labor market tightens again, causing the market to downgrade the consensus from "two rate cuts this year" to "one," the dollar and long-term interest rates will rise, and gold will return to below the upper edge of the descending channel. The consolidation phase, where time is used to create space, will be prolonged, and the $4,050-$4,090 range will evolve into a "strong resistance box," with multiple attempts to break through it failing to hold.
Trading strategy:
Buy: 4025-4035, SL: 4050, TP: 3920-3880-3820
If the price of gold does not retrace to the target level before the speech, then a short position can be established at the current price.

Gold at a Critical Crossroad: Bounce or Breakdown Ahead?Hi!
The gold price is currently trading around $4,042, sitting just above a critical support area near $3,953.80. This gray zone is a key decision point for the next major move.
Trend Structure:
The broader trend remains bullish, moving within a well-defined ascending channel.
Double Top Formation:
A short-term double top has formed near recent highs, triggering a corrective move down into the channel’s midline and the gray support area.
Critical Support Zone ($3,953.80):
This level aligns with previous structure support and the channel’s bottom, making it a high-probability reaction zone.
________________
Scenario 1: Bullish Reaction (Primary Scenario)
If gold holds above the gray critical area and bounces within the ascending channel, we could see a renewed bullish wave.
Confirmation: A strong bullish reaction or higher low around $3,953–$3,980.
Target: The green target zone around $4,619.57, corresponding to the upper channel boundary and a potential measured move from the recent correction.
Scenario 2: Bearish Breakdown
If the gray area fails to hold, it could signal deeper downside momentum.
Trigger: A clean break and 4H close below $3,953.80.
Target: The pink support zone near $3,656.01, which aligns with prior accumulation and the lower channel boundary.
________________
Disclaimer: As part of ThinkMarkets’ Influencer Program, I am sponsored to share and publish their charts in my analysis.

#XAUUSD: Massive Drop Is In Making! Bears In ControlDear all,
We are seeing significantly increased bearish volume since yesterday now we think price is likely to remain bearish for couple of days or week so price could make major correction. Please wait for price to settle down.
Good Luck
Team Setupsfx_


GOLD PENDING SELLGold pending sell order
will enter if:
- no new high is made today
- 5 min candle close below entry

Gold Extends Decline Below $4,000 as Risk Appetite Returns🔍 Market Context
Gold continues to weaken as renewed optimism over US–China trade relations reduces safe-haven demand.
Despite the Fed’s dovish tone after the latest FOMC meeting, the Dollar remains relatively capped, offering limited support to bullion.
However, the technical landscape remains bearish — the decisive break below the $4,000 handle signals a continuation of the downside structure that’s been unfolding since early in the week.
📊 Technical Analysis
• Structure: Clear downtrend across H1–H4, with consistent lower highs and controlled liquidity sweeps.
• Key Resistance: 3,985 – 4,000 (former support now turned supply).
• Short-Term Targets:
– 3,925 – 3,930 → initial liquidity pocket.
– 3,880 – 3,860 → extended bearish target aligned with Fibo 1.618 extension.
• Invalidation: Only a confirmed break & hold above 4,020 – 4,030 would shift bias neutral-to-bullish.
🎯 Trading Outlook
If gold retests the 3,985–4,000 zone and fails to reclaim it, sellers are likely to extend control toward 3,920 or lower ahead of the FOMC-driven volatility.
Momentum remains bearish as long as the market trades below the 4,000 pivot — liquidity below 3,900 may attract smart money before any meaningful rebound.
⚜️ Summary
This decline isn’t random — it’s a structural reset.
The market is rebalancing after months of overextended bullish sentiment.
Watch how price reacts between 3,920–3,880 — this zone could define the next shift in gold’s short-term direction.
📊 MMFLOW TRADING Insight:
“Smart money doesn’t chase candles — it waits for liquidity to shift.”

XAU/USD (Gold) chart Pattern..XAU/USD (Gold) chart carefully 👇
🧭 Timeframe:
Im using 1-hour (1H) chart.
📊 Current Setup:
I have a descending triangle or symmetrical triangle pattern forming.
Price is around $4,000–$4,005.
The support trendline (bottom) has been tested multiple times, showing potential weakness.
Ichimoku Cloud is flat and price is below the mid-zone — a slightly bearish bias.
📉 Breakout Direction:
The chart shows blue arrows pointing downward, meaning a bearish breakout is expected.
🎯 Target Levels (based on my chart’s marking):
1. First Target Point: around $3,975 – $3,980
(Short-term target after triangle breakdown.)
2. Second Target Point: around $3,920 – $3,925
(Extended bearish target if momentum continues.)
⚠ Key Levels to Watch:
Resistance: $4,020 – $4,030
Break Zone (confirmation of sell): below $3,995 candle close (1H).
Support/Buy Zone: $3,920 – $3,925
---
Summary:
Action Target Comment
Sell below $3,995 🎯 $3,975 First take-profit
Hold/sell continuation 🎯 $3,920 Final target zone
Stop loss 🔺 $4,030 Above upper trendline

Gold Buying every local Low'sAs discussed throughout my Friday's session commentary: 'My position: I have been monitoring Gold from sidelines as mentioned throughout yesterday's session Highly satisfied with my Profit, as I spotted that #3,988.80 is showcasing strong durability, I have started Buying Gold with aggressive Scalps from #3,988.80 - #3,992.80 many times with at least #15ish orders delivering excellent Profits. I do believe Gold will continue soaring as long as Support zone is intact with #4,052.80 mark as my next Short-term Target.'
Technical analysis: The current Hourly 4 candle is already too Neutral to deliver continuation of Intra-day Buying sentiment and with Hourly 1 chart’s switch from Neutral to Bullish regarding the Short-term, Price-action limited the uptrend (even though Gold should be Higher, relative to circumstances and debacle on U.S. announcements), as Investors started taking Profits on their Buying orders and finding value within the #3,988.80 - #4,027.80 belt again (confirms U.S. sessions decline on unprecedented Volatility on Gold’s Price-action). The key is the Hourly 4 chart’s Resistance zone priced at #4,027.80 - #4,033.80 which rejected the Price-action twice (current Month) and has already done so throughout last week on multiple occasions. This is the key and if that configuration breaks, Short-term Buyers should take it to #4,052.80 impulse in extension. Otherwise, the #3,975.80 - #3,988.80 Support zone should be re-tested for a potential Double or Triple Bottom as in late September. The DX though got rejected on it’s Hourly 4 chart’s Resistance and it is due to the weak Bond Yields market that Gold isn't near #4,052.80 mark already, and it became obvious that market speculators were manually preventing the meltdown I have been mentioning, knowing that U.S. announcement will revive Buyers as in late June.
My position: I am taking advantage of Buying every local Low's since Friday's session last week, Buying either #3,988.80 Support with set of aggressive orders, or #3,992.80 Support in extension. I have Bought #4,001.80 as well towards #4,012.80 or above and will continue to do so until Gold is presented with a break-out to the upside. I do expect #5,100.80 benchmark on Medium-term.

GOLD: Short Trade Explained
GOLD
- Classic bearish formation
- Our team expects fall
SUGGESTED TRADE:
Swing Trade
Sell GOLD
Entry Level - 3972.9
Sl - 3987.4
Tp - 3944.7
Our Risk - 1%
Start protection of your profits from lower levels
Disclosure: I am part of Trade Nation's Influencer program and receive a monthly fee for using their TradingView charts in my analysis.
❤️ Please, support our work with like & comment! ❤️

GOLDPreferably suitable for scalping and accurate as long as you watch carefully the price action with the drawn areas.
With your likes and comments, you give me enough energy to provide the best analysis on an ongoing basis.
And if you needed any analysis that was not on the page, you can ask me with a comment or a personal message.
Enjoy Trading ;)

GOLD Free Signal! Sell!
Hello,Traders!
GOLD reacted precisely from the horizontal supply area, showing displacement and lower-timeframe structure breaks. A bearish move is expected as liquidity above the previous high was swept.
-------------------
Stop Loss: 3,993$
Take Profit: 3,882$
Entry: 3,938$
Time Frame: 3H
-------------------
Sell!
Comment and subscribe to help us grow!
Check out other forecasts below too!
Disclosure: I am part of Trade Nation's Influencer program and receive a monthly fee for using their TradingView charts in my analysis.

November Gold Paradox: Expected Strength Meets Blurred Direction
🍂 November typically brings seasonal bullish moves for Gold; demands from India and China, central bank interest, and safe-haven flows as the year winds down.
⭐But November 2025 opens with hesitation, not momentum.
October closed with fresh all-time highs, followed by a sharp end-month correction that broke short-term structure. Now, Gold begins November range-bound, lacking both clarity and fundamental conviction.
Contributing to this indecision is the U.S. government shutdown, which has delayed critical economic data. Without jobs reports or inflation metrics, the Fed has no updated visibility and traders are left without macro confirmation to support directional conviction. While shutdowns often support Gold as a safe haven, the current blackout has instead amplified uncertainty.
🔹 This first week already carries weight: ISM Manufacturing PMI on Monday (negative for Dollar as of recent release) and ADP Employment on Wednesday; two of the few confirmed releases still standing despite the shutdown. They could offer short-term directional clues if volatility aligns with structure, but just as easily trigger reactive spikes that fade within hours. Either way, the message is the same let structure confirm before conviction takes over.
Until that changes, structure not sentiment is the only valid guide.
📚 November’s Setups in Disguise
Gold is trading November more in anticipation.
Because the market isn’t lost, but simply waiting for structure to confirm direction.
Our metal is moving between defined zones, reacting level to level, not to headlines or speculation.
For now, price is holding inside a decision area, no breakout yet and that telling us to be patient.
Here’s the paradox:
→ If Gold begins to rally this month, the whispers of an early Fed pivot will return. Risk appetite expands, and momentum traders chase continuation.
→ If it sells off, those same expectations get priced out. The safe-haven flows unwind, and bearish narratives resurface.
→ But if Gold simply stays trapped in a wide, reactive range both buyers and sellers become liquidity for one another if they do not pay attention.
And that’s the part most traders miss. November is a preparation month.
Volatility without confirmation is dangerous.
→ Read the structure, not the headlines.
→ Trade the reaction, not the assumption.
→ Focus on your system, not the noise.
Clarity will come, but maybe not in the first week.
⚖️ The Mindset Shift This Market Demands
Beware this not the Gold environment we were trading even two months ago.
We’ve entered a phase where volatility has changed: one-minute candles can travel 200+ pips, and price can sweep both sides of structure in minutes. Volumes in a day can exceed 2000+ pips.
🔹 Think in wider zones, not narrow scalps.
High timeframe levels — like H1/30M and H4 — are providing more stability in these volatile conditions. Entries defined there, confirmed on M15 or M5, are showing better follow-through.
🔹 Consider reducing your lot sizes.
Not as a rule, but as a response to the increased range and unpredictability. What worked with older volatility may now lead to outsized losses in the blink of an eye.
🔹 Let go of urgency.
This isn’t about catching every move. In fact, the best setups in this market come from not chasing, but letting structure unfold first. 1 good setup/day is more than enough.
🔹 Trade with the trend first — countertrend only with caution.
The current volatility makes every retracement look like opportunity, but most reversals are just liquidity sweeps. Until structure confirms a real shift, fading moves is riskier than riding them.
XAUUSD has changed pace again. And the traders who are adapting ,without needing to predict ,are the ones who’ll stay in profit in this cycle.
This November isn’t a month for bold predictions, so let’s trade what’s real, adjust often, and survive cleanly into December, with capital and clarity intact.
If this article gave you clarity for the weeks ahead, drop a 🚀 and follow us ✅for Trading Psychology articles and daily ideas.

Gold Trade Plan 29/10/2025Dear Traders,
The market remains within a descending channel ahead of the Federal Reserve meeting.
The 4050–4060 zone is an important area — if the price gets rejected from this zone, it is likely to return to 3930; otherwise, the correction to the upside will continue.
Regards,
Alireza!

ANFIBO | XAUUSD - Bullish Head & Shoulder [10.29.2025]Hi traders, Anfibo's back!
XAUUSD Analysis – Daily Trading Plan
Overall Picture:
OANDA:XAUUSD recently reached a new ATH near $4,400/oz, before undergoing a healthy correction back to the $3,890 support level following an exceptionally strong rally fueled by geopolitical tensions. After this retracement, gold is now consolidating around the $4,000 zone, showing signs of breaking above the descending trendline on the H1 timeframe — a signal that short-term bullish momentum may be reemerging.
From a structural standpoint, this pullback appears to be part of a technical correction within an ongoing uptrend, not a trend reversal. Currently, the market is stabilizing and setting up for a potential new wave upward. I’m personally watching for a Head & Shoulders (H&S) formation to develop — this could offer optimal Buy and Sell opportunities depending on which neckline breaks first.
I still believe gold is likely to revisit the $4,200 area soon , as long as the $3,890 support holds firm and global risk sentiment continues to favor safe-haven assets.
Trading Plan for Today:
>>> SELL ZONE:
ENTRY: 4135 - 4150
SL: 4165
TP: 4045 - 4010 - 4000
>>> BUY ZONE:
ENTRY: 4000 - 4010
SL: 3990
TP: 4135 - 4150 - 4200
Risk Management:
- Prioritize Buy setups following the higher-timeframe trend; Sell only for intraday scalps.
- Maintain a minimum Risk:Reward ratio of 1:2.
- Avoid entries during major geopolitical or economic announcements.
- Monitor the Head & Shoulders pattern closely — confirmation will guide the next major move.
Conclusion:
Gold has completed a healthy correction after its parabolic surge to $4,400, and the market is now regrouping around the $4,000 zone, with early signs of renewed bullish momentum. As long as $3,890 remains intact, the broader trend remains bullish, and I expect a potential rebound toward $4,200 in the near term.
Patience and precision are key here — waiting for the Head & Shoulders formation to confirm will provide the best entry signals for both sides of the market. Until then, the bias remains bullish with a short-term recovery underway.
GOODLUCK, LOVE U GUYS!

XAUUSD📊 GOLD (XAUUSD) – Multi-Timeframe Technical Outlook
Monthly:
Gold closed the last monthly candle bullish, even with a long upper wick.
✅ Buyers are still in control
⚠️ But the wick shows loss of momentum at the top
✅ Weekly Timeframe
Price broke out of a symmetric triangle, and for 9 consecutive weeks, gold pushed aggressively to the upside.
However, the last two weekly candles show:
smaller bodies
longer wicks
loss of momentum
📉 If this correction continues, price may come back down to retest the broken triangle around the 3,500 zone.
This retest would collect liquidity and give the market structure needed to build a new leg toward the 5,000 long-term target.
✅ Daily Timeframe
Recent high near 4,400
Price dropped to 4,000 → new low
Pullback to 4,150 → Lower High
Deeper drop to 3,886 → new lower low
Bounce up to 4,046 → another Lower High
🔻 Conclusion on D1:
The daily structure is bearish with a clear sequence of Lower Highs, showing loss of bullish strength.
✅ H4 Timeframe
On H4, price is currently forming a bearish flag pattern — slow, corrective movement after the drop.
If price breaks below the flag, that would open the door for another leg down, targeting:
3,900
3,750
and possibly the 3,500 weekly retest zone
📌 Summary
Monthly → bullish but losing steam
Weekly → breakout confirmed, but correction likely before continuation
Daily → bearish market structure
H4 → bearish flag building momentum for another drop
If the flag breaks down, the next major liquidity zone sits around 3,500 — the same zone as the symmetric triangle retest.
🔥 Bias: Bearish short-term
🚀 Long-term: Bullish continuation toward 5,000 after deeper correction

XAUUSD | GOLD LONG SETUP🎅✨ Santa’s Got a New Sleigh ✨🎅
- Forget reindeer — this year he’s hitching his ride to gold bars.
- The chart looks like Santa’s sack: heavy, bulging, and ready to burst open at resistance.
- RSI? More like “Really Santa’s Incoming.”
- Fib levels lining up like elves in formation, handing out bullish candles instead of candy canes.
- If this breaks north, it’s not just a rally — it’s a jingle‑bell breakout.

Gold going bullish?After Fed rate cuts gold fell below 4000 but seems to be gaining. We currently have double bottom and trend line break. One last confirmation could be the break of the neckline and retest after which we could push further upwards to all time high or fill the gap at 4112.

GOLD BIG SELLthe news are not good around gold , and big institutions like china will be trapped in trump's manipulation of the market , follow the market maker and invest intelligently , the next movement for gold is bearish
