Gold breaks through $4,000, has the bulls returned?You might be surprised if I said gold could continue to decline? But the truth is, I'm not surprised. I see this round of trend very clearly: the break below the 4000 mark was just a brief "acceleration" rather than a true reversal of direction. After the price broke through, it quickly rose to around 4017. This performance is more like an emotional release than a trend reversal. After all, the 4000 level has been breached or recovered many times before. There have been too many short-term fluctuations, and the real significance has already been digested by the market's inertia. I maintain a bearish outlook because the chart structure has reached the testing area of the channel's low point, a key position I have repeatedly emphasized. There are only two possibilities for the trend: either the market will soar upwards and return to the upward channel, or it will begin a new round of decline. What I want to seize is the volatility opportunity in the latter. Looking at the key levels: the highs this week are 4050, 4040, and 4030. If the rebound stops in the 4020-4030 area, then a short-term top has likely appeared. At this point, entering a short position would be extremely cost-effective. As long as the market cannot regain a foothold above 4030, I remain firmly bearish, with targets to watch for a break below 4000 and further down to the 3980-3960 area. I don't strive for perfect predictions, but every move I make must be logical, structured, and valuable. When opportunities arise, do not hesitate or waver; execution is key. Seek victory through stability and do not blindly follow the noise of the market.
Trade ideas

XAUUSD Double Top Breakdown and Bearish Flag in PlayGold has completed a double top reversal, hitting its measured target before forming a bearish flag under the key supply zone.
As price remains capped below $4,050–$4,200, bearish momentum could continue toward the $3,700 region, aligning with the flag target.
We should watch the $4,020 POI zone closely any retest and rejection from that area could confirm continuation to the downside.
💬 Share your thoughts below and don’t forget to like & share if this analysis adds value!

Gold Technical Update | Correction Expected Below 4100New Gold Analysis (4H & Daily Timeframes):
After gold reached the previous technical target at 4300 🎯 we now expect a potential correction toward 3850 and 3750 as long as price remains below 4100.
Check the chart !

Gold price analysis June 11✏️ XAUUSD Analysis — 06/11
Today's gold trading range is being established within 100 prices, limited by the resistance zone of 4031 and the support zone of 3931.
The main trend is still up, so the strategy of prioritizing BUY following the market momentum will be more suitable in this period.
The Keylevel zone of 4031 continues to play an important role — if the buying force is strong enough to break this zone, the next target will be 4150.
On the other hand, it is necessary to observe the price reaction around the trendline and the support zone of yesterday's Asian session to determine whether the buying force is still maintained or not.
📈 Trading Plan
BUY around 3984
BUY when there is a price rejection signal at support 3931
BUY DCA when price breaks 4031
🎯 Target: 4150
⚠️ Risk: when price breaks the trendline and closes the candle below 3930

XAUUSD wave structure analysis on H1, M15 timeframesH1 swing is bullish => current is pullback down
M15 swing is bearish => currently is pullback up
We can look for selling opportunities when the price goes up to the supply zone of M15

XAUUSD is on Rangebound currently market is bullish biased and Rangebound from 3995-4040 -zone.
Although it's upside at 3998 was to quick.
What are my conditions For This setup?
- I'm waiting for buy from 3990-3980 area & expecting the reversal move towards 4028- 4047 target although currently I took bu6 from 3995-3990 area and holding till my Targets
- Second if H1-H4 candle closes above 4045 area I will straight Buy and target 4070-4090 .
✳️Secondly if H4-H1 candle closes below 3975-3970 our buying will be compromised

GOLDGOLD is still upside for us, next reaction will be above 4100.
Disclosure: We are part of Trade Nation's Influencer program and receive a monthly fee for using their TradingView charts in our analysis.

Gold OutlookDemand and Supply areas in action. Am looking at the two zones for bullish buildup. Extreme Discount zone has more probability

GOLD XAUUSD Gold's reclassification as a Basel III Tier 1 asset marks a significant upgrade in how regulators and banks view gold within global financial systems.
Why Gold is Reclassified as Basel III Tier 1
Tier 1 Status Definition: Under Basel III, Tier 1 assets are the highest quality capital assets that banks can use to meet their core capital requirements. These assets carry a 0% risk weight, reflecting their safety, liquidity, and reliability as capital.
Gold’s Historical Status: Gold has already been recognized as a Tier 1 asset for capital adequacy since the Basel I Accords in 1988, due to its status as a safe store of value with very low default risk.
New Recognition (2025): Starting July 1, 2025, physical gold held by banks can be counted at 100% of its market value in regulatory capital calculations, instead of being subject to significant haircuts or lower classifications (e.g., previously it was treated as a Tier 3 asset with a 50% deduction).
High-Quality Liquid Asset (HQLA) Label: This reclassification means gold is now officially recognized as a High-Quality Liquid Asset under Basel III, allowing it to qualify as part of banks’ liquidity coverage ratios (LCR), an important step for liquidity and capital management.
Regulatory Shift: This reflects changing perceptions that gold is not just a commodity but a true monetary asset. It is increasingly accepted as a reliable reserve asset by central banks and financial institutions worldwide.
Central Bank Adoption: This move aligns with continued aggressive gold buying by central banks, recognizing gold’s importance for capital reserves, systemic stability, and as an inflation hedge.
Significance
Banks can fully count gold toward core capital reserves.
Reduces capital burden, improving bank balance sheets and financial resilience.
Endorses gold as a strategic, monetary asset, not just a commodity investment.
Encourages institutional demand for physical gold and gold-related financial products.
Summary
Gold was reclassified as a Basel III Tier 1 asset starting July 1, 2025, reflecting its highest quality capital standing with 0% risk weighting and full market value recognition. This elevates gold’s status to a High-Quality Liquid Asset (HQLA) for regulatory purposes, facilitating banks’ liquidity coverage and capital adequacy. The change signals a major regulatory and market shift, acknowledging gold as a core reserve and strategic financial asset in modern banking systems.
#GOLD #XAUUSD

XAUUSD XAU/USD – Gold Analysis
Gold is approaching the upper boundary of the descending channel after a strong bounce from the midline support earlier today.
As it nears this zone, price faces a confluence of resistance factors: the descending trendline, the 0.5 Fibonacci retracement, and the upper Bollinger Band.
From this area, I’ll be looking for a short setup, targeting a move back toward the midline of the channel to capture the liquidity left by today’s upward move.
Fundamental Outlook:
The U.S. dollar remains firm as investors continue to favor USD as a safe-haven amid ongoing geopolitical tensions and uncertainty around global growth.
The Federal Reserve’s cautious stance and limited expectations for rate cuts are supporting higher Treasury yields, which typically weigh on gold prices.
However, gold’s safe-haven demand could re-emerge if geopolitical risks intensify or U.S. economic data begins to soften.
For now, the short-term bias remains bearish, with gold under pressure from strong USD fundamentals and technical resistance zones above.
Summary:
📈 Testing major resistance (trendline + 0.5 Fibo + Bollinger top).
📉 Looking for short setups near 4024.
🎯 Target: Mid-channel around 3962.
⚙️ Fundamentals: Strong USD and yields keep gold capped short-term.
💡 Bias: Bearish near resistance, bullish only if price breaks above the channel.

SELL XAUUSDXAUUSD (4H Analysis)
After the recent drop on the 4-hour timeframe, the price has formed a rectangle (range) pattern.
If the support of the pattern breaks, we could see a continuation of the bearish move toward lower levels.
However, if the resistance breaks, a short-term bullish correction might occur.

Gold. Found temporary bottom. 2/Nov/25Xauus possible found its temporary bottom with price moving up to 4260 +/-

Gold faces key resistance at 4030; continue shorting on rallies.Gold is currently in a consolidation phase, moving back and forth, constantly pulling and tugging. This has been the typical gold price action for a considerable period after major price movements, so it's important to get used to this rhythm. Don't assume a significant surge is imminent just because the price rises; this is currently just a corrective rebound. The overnight short position at 4020 yielded the expected profit. The article explicitly advised shorting, and gold ultimately fell as predicted. Continue to short on any rebounds during the Asian session.
Gold is still consolidating on the 1-hour chart, without a clear directional breakout. Current rebounds present opportunities to short. Multiple attempts to break through resistance levels haven't resulted in a significant upward breakout, indicating insufficient bullish momentum and a generally bearish bias. The 4030 level is a key resistance point. Until a strong, one-sided trend emerges, shorting at the trendline resistance is advisable. Only a break above 4050 could bring a bullish resurgence.
Gold's consolidation without breaking below 3960 suggests a possible trap for long positions. If this continues, a further collapse in gold prices is quite possible. Traders need to be adaptable to these situations. In terms of trading strategy, it is recommended to open a short position at 4000. If there is a strong upward movement, pay further attention to 4020-4030 to continue shorting. On the downside, focus on the 3930-3900 range.
Bullish GoldBased on the analysis of supply and demand points and fundamental conditions, it seems that gold will be in demand next week and will grow by about 10%.
This analysis is valid as long as the global price of an ounce does not fall below $3,970.

GOLD XAUUSD GOLD XAUUSD ,GOLD ,AS earlier predicted on retest to 4030 zone, price is reacting but 4hr close shows a technical break of structure and if we take correction i will be watching 4000-4006 demand floor which is a descent 270pips drop from the close of the newyork high.
the next demand floor should 4000-4006 fails will be 3956-3954 zone ,a strong 1hr cross and a break and retest descending trendline .
if 4000-4006 holds and we break freely away from 4030 ,then we will target 4100 zone you can stop at 4068 another 300pips break of 4030 resistance zone and watch for correction .
am confident that 4100 is possible tomorrow.
technical failure of both zone will retest 3885-3889 current low which i think wont happen based on the current FEDERAL FUND RATE 3.75%-4.0%.
#GOLD #XAUUSD

We firmly go long when the market is blindly shorting.#XAUUSD OANDA:XAUUSD TVC:GOLD
From the hourly chart, the short-term gold price has broken through the resistance of the triangle pattern boundary. The market has made its choice, and it is clear that we bulls have won. Therefore, we can continue to execute our trading strategy for the next step. Wait for a pullback to 3995-3985 to buy again, with an initial target of 4020-4030.

Gold to 3700Gold price currently forming a right angle triangle prepping for a drop as it rise to retest 4040 area.
Short entry: 4040
TP: 3705
SL: 4070
set your TP and Sl according to your Margin size

WE ARE SELLING A sell at 3999-4004 any moment after 12am UTC, with sl at 4020 and tp 3900 or 3860 or not less than 500 pips, i will update you along the way

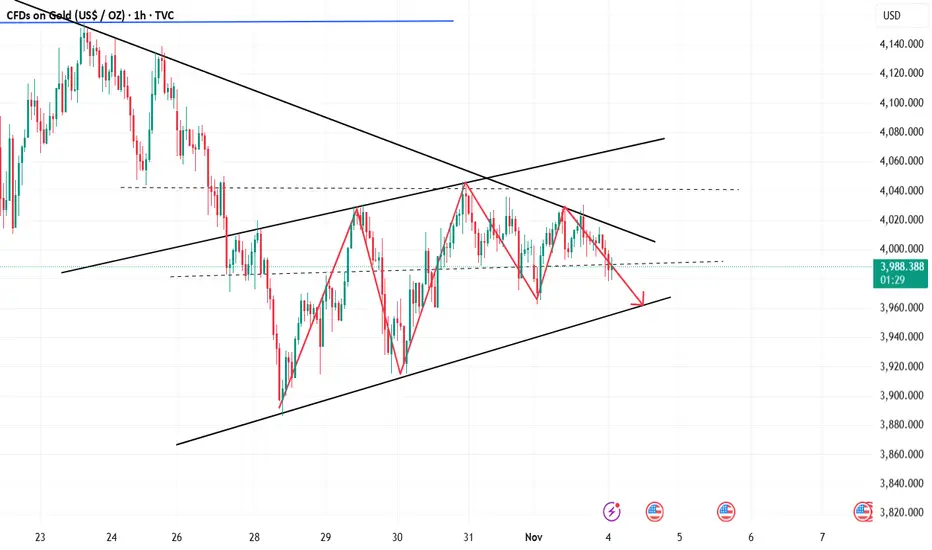
XAU/USD – Gold Accumulates Before Breakout, Target 4,096 USD🔍 Market Context
Gold is trading within a symmetrical triangle pattern , reflecting short-term accumulation before forming a new breakout wave.
After a sharp decline from the peak of 4,096 USD, the market has shown two instances of Change of Character (ChoCH) – an early sign indicating the return of buying pressure.
As long as the price holds above the 3,959 – 3,917 USD range, the short-term bullish structure remains intact. This support zone serves as a crucial “discount zone” in the current accumulation cycle.
💎 Key Technical Zones
• Support Zone 1: 3,959 USD → main structure holding area, coinciding with the lower trendline.
• Support Zone 2: 3,917 USD → final liquidity reaction zone.
• Resistance Zone: 4,040 USD → potential break & retest area.
• Liquidity Zone: 4,096 USD → expansion target if the peak is broken.
🎯 Trading Scenarios
1️⃣ BUY Setup – Favoring the bullish structure
• Entry: 3,959 – 3,917 USD
• Stop Loss: 3,905 USD
• Take Profit:
– TP1: 3,985
– TP2: 4,040
– TP3: 4,072
– TP4: 4,096
✳️ “Buy the discount” – prioritize buying orders at the confluence support zone of trendline + FVG to follow the SMC flow.
2️⃣ SELL Scalp – Secondary strategy when price reacts at the peak
• Entry: 4,096 USD
• Stop Loss: 4,108 USD
• Take Profit:
– TP1: 4,072
– TP2: 4,040
– TP3: 3,985
✳️ “Sell the premium” – only activate if there is a strong price rejection signal at the liquidity peak.
💬 Conclusion
The short-term trend of gold remains bullish as the price stays above the trendline and continuously forms higher lows.
The main strategy is buy the dip – sell reaction around the 3,959 → 4,096 USD range.
The confirmation point for a strong bullish trend will be when the price closes steadily above 4,040 USD .
“Smart money accumulates in silence before the market makes noise.”
⏰ Timeframe: 1H
📅 Update: 03/11/2025
✍️ Analysis by: Captain Vincent

XAU / USD 1 Hour ChartHello traders. Taking a look at the hourly chart, gold has broken out a bit for a push up. I am waiting to see if we can drop back towards the $4k area, to be sure it holds as support. Many times gold doesn't retest, it just moves, but for now I am waiting to see if we can come down to my area marked on the chart. This is just speculation and a trade idea. Let's see how things play out over the next hour or so. Big G gets a shout out. I am just looking for a potential scalp trade, but it is Monday, so I am in no hurry to force or rush a trade. Be well and trade the trend.

Gold Technical Outlook: From Reaction Zone to RallyStructure and Trendline Break
Gold on the H1 timeframe shows a clear breakout from the descending trendline, signaling a structural shift from bearish to potential bullish continuation. The breakout is supported by the formation of a higher low, suggesting growing buying pressure.
ABC Pattern and Key Retracement Zone
After the first bullish impulse from 3887 to 4045, price is now in a corrective phase (wave B), pulling back into the Fibonacci retracement zone:
0.618 (3993) to 0.786 (3978) marks the PRIMARY REACTION ZONE, where buyers are likely to step back in.
A strong bullish reaction from this zone would confirm the start of wave C.
Fibonacci Extension Targets
If the bullish continuation (wave C) unfolds as projected:
1.618 extension at 4117 → short-term bullish target.
2.618 extension at 4259 → main bullish projection, mirroring the prior impulsive move.
As long as price holds above the 3950–3980 support range, the bullish structure remains intact.
Trading Bias & Summary
Bias: Bullish (while above 3980)
Ideal Entry: Buy limit around 3980–3995 (Primary Reaction Zone)
Invalidation: Break below 3950 (signals potential deeper correction)
Targets: 4117 and 4259

XAUUSD – Ascending Diagonal Structure Forming a Bullish BreakoutXAUUSD – Ascending Diagonal Structure Forming a Bullish Breakout Setup
Price action is currently developing an Ascending Diagonal (a contracting rising wedge structure), typically seen as a wave 1 or wave 5 pattern in Elliott Wave terms. In this case, the internal wave count (A)-(B)-(C)-(D)-(E) suggests the diagonal is completing, and we may now be transitioning into the impulsive breakout phase.
Key Technical Notes:
Each swing leg is overlapping, fitting the characteristics of a diagonal
Wave (D) respected the 0.618 retracement and bounced cleanly
Price is holding above the lower boundary trendline
Momentum on RSI is recovering from a bullish divergence
This combination indicates that the correction within the diagonal is likely complete, and the market is preparing to resolve upward.
Breakout Confirmation Levels:
Break above 3,997–4,010 → triggers bullish continuation
Holding above 3,963 keeps the diagonal valid
A close below 3,948 invalidates the bullish wave structure
Upside Targets After Breakout:
4,035
4,060
4,090+ (diagonal measured projection)
Bias: Bullish while price stays above 3,963
Structure Type: Ascending Ending/Leading Diagonal
Expectation: Impulse wave breakout to the upside

GOLDGold price faced rejection near the 4,000 resistance zone and is now showing bearish pressure. Price broke below the short-term channel and is heading toward the first support around 3,960. If this level fails to hold, the next key support lies near 3,925, where buyers may look to re-enter. Overall sentiment: short-term bearish below 4,000
"Thank you for your support! If you found this idea valuable or learned something new, please consider liking and leaving a comment. I’d really appreciate hearing your feedback and thoughts."
