Going Long On Gold (XAUUSD)Gold Analysis 🟡 | Potential Reversal Setup
For some days now, gold has been quite bearish. But at the moment, we can clearly see a new higher high forming on the 1H timeframe, and multiple higher highs showing up on the 15M chart as well.
Price has already swept all the liquidity that was built up from last night into today, and it is now sitting around the area where it almost created a new low compared to yesterday.
However, I believe this move was mainly to grab liquidity, meaning price could be preparing for a bullish reversal. I am looking to take a long position from here. Let us see how it plays out. ✨📈
Trade ideas

GOLD XAUUSD THE YELLOW METAL SELLOFF CONTINUES ON FOMC FEDERAL FUND RATE OUTLOOK.
All eyes are now on the Fed’s monetary policy verdict , as the US government shows no signs of reopening.
Market are almost fully pricing in two interest rate cuts this year, with a 25 basis points (bps) cut .
the key technicality surrounding gold trading is as follows
the 4hr EMA10,EMA20,EMA50,EMA100 are all above price supporting bearish take profit only the 4HR EMA200 IS below price acting as dynamic support on 4hr at 3945-3940 + ema 200 support for buy.
THIS WILL BE LAYER BY LAYER.
THE DOLLAR INDEX BROKEN OF 98.757 SUPPORT FLOOR INDICATING A POSSIBL EFFECT ON RATE CUT ,HOW EVER THIS PRICE ACTION PUT GOLD LONG POSITION ON CAUTIOUS MODE.
THE UNITED STATE 10 YEAR TREASURY BOND YIELD CLOSE IN MASSIVE SELLOFF TO CLOSE BELOW 4.0% MARK AT EXACTLY 3.987%
GOLD CORECTION IS PLAYING ON CAUTION AND the next demand floor will around 3767.90-3764-3760
finally the last layer by layer will be 3700-3706 my pay day zone ....at this level expect to see the hand of GOD.
NOTE;gold trading is very volatile but comes with liquidity ,pls manage your risk and i wish you good luck.
#GOLD #XAUUSD #DXY #US10Y

GOLD Bull Market Over?Gold has fallen yet again today. Busting through some major technical support.
Gold is falling for 3 main reasons;
1. Trump / XI (USA vs China) meeting is expecting positive negotiations.
2. Mega Cap Tech Earnings: markets love to chase tech higher.
3. FOMC rate cut expectations.
We believe gold had a strong chance at retesting the daily 200 MA.
Picked up some GLD calls today.

Today's gold trading strategyThe contradiction between supply and demand has set the price floor.
The gold market is currently facing a dual situation of "tight supply and strong demand". On the supply side, the global underground reserves of gold are only 20%, and the output of mined gold in 2025 can only maintain a slow growth of 3,000 tons. Moreover, new mines need 5-7 years to come into production, and there is simply no possibility of a significant increase in supply in the short term. The marginal production cost has risen to $1,500 per ounce, providing a strong support for the gold price. On the demand side, not only are global central banks buying gold in a frenzy, but the gold purchase volume is expected to exceed 10,000 tons in 2025. The private investment demand in Asian markets such as China and India is also surging. In 2024, the consumption of gold bars and coins in China increased by 46.02%. This supply-demand gap is difficult to fill in the short term and will inevitably push the gold price to rise.
Today's gold trading strategy
xauusd @ buy4050-4060
TP:4080-4100-4150
SL:4030

XAUUSD LongTravelled down to what I believe to be an area of interest before another rise run, could be wrong, could have jumped the gun with durable goods orders coming out later, just have to wait and see.

GOLD | Awaits CPI Data for Next Direction GOLD | Awaits CPI Data for Next Direction
Gold prices are set for a strong move ahead of the U.S. CPI release.
Key Levels
Pivot: 4,053
Resistance: 4,101 · 4,124 · 4,163
Support: 4,011 · 3,985 · 3,945
Trading Plan
🔼 Buy Setup: Longs valid above 4,053, targeting 4,101 / 4,124 / 4,163 — supported if CPI prints below 3.1%.
🔽 Sell Setup: Shorts valid below 4,053, targeting 4,011 / 3,985 / 3,945 — favored if CPI comes above expectations.
📌 Premium Takeaway
Gold is poised for a strong reaction to inflation data.
A softer CPI favors bullish continuation toward 4,124–4,163,
while a hotter CPI could trigger a bearish correction toward 4,011–3,945.

How to trade gold stably as the weekly and monthly charts close?#XAUUSD TVC:GOLD OANDA:XAUUSD
As we expected, gold broke through the previous strong resistance at 4030 and continued its bullish trend, reaching a high of 4046, very close to our target of 4050. Although the price of gold retreated somewhat after the brief surge, from the daily chart, the short-term price of gold is still above the MA5 moving average, while from the 4-hour chart, the middle band coincides with the MA20. Therefore, I don't think this means the bulls have given up; on the contrary, it's more like a way to better accumulate momentum at the bottom. This strategy remains effective, and we can still consider going long on gold when the price retraces to the 3985-3975 range.


Gold Trade Set Up Oct 31 2025Price is bullish on the 1h and 15m making HH/HL and just broke structure to the upside on the 15m so i want to see a pullback into 15m FVG or sweep internal 5m SSl before looking for a continuation back up

GOLD LONDON TIME GOLD LONDON TIME layer by layer on 15 min is a sniper strategy developed by shavyfxhub .
we combine EMA+SMA+TIME + STRUCTURE
on intraday hourly candle dont give sniper entry,our aim is sniper or nothing.
3990-3985 will be watched
#gold

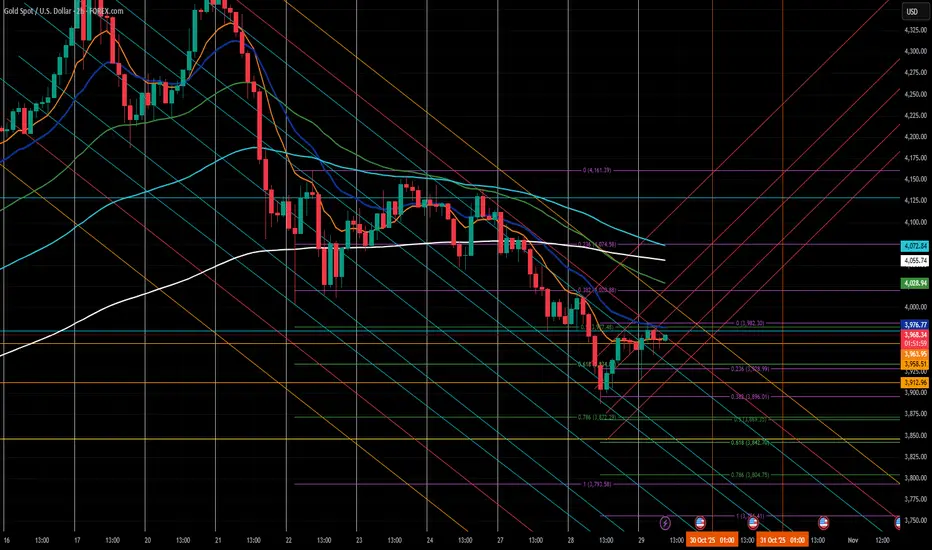
When Fundamentals Mislead — Only the Chart Tells the TruthGold Analysis – Special Weekly & Monthly Closing Edition
This report combines daily, weekly, and monthly charts to look beyond short-term noise — connecting technical, economic, and geopolitical factors for a broader perspective.
Economic & Geopolitical Highlights
1. Fed Rate Cut (-25 bps) — Neutral
The move was fully priced in; gold showed no bullish response.
2. Jerome Powell’s Press Conference — Bearish
He noted that a December rate cut is “no longer guaranteed,” cutting odds from 90% to 60%, weighing on gold.
3. Trump–Xi Meeting — Bearish
Talks were commercially positive, signaling tariff relief — reducing safe-haven demand.
4. Trump’s Comments on Nuclear Tests — Mildly Bullish
Even verbal tension keeps geopolitical uncertainty alive in the background.
Hot Topics Still on the Table:
Trump–Putin meeting in Hungary
Sanctions on Russian oil firms
New U.S. tariffs
U.S. government shutdown updates
In short — fundamentals remain highly unstable and reactive.
As I posted earlier on X:
“When Fundamentals Mislead — Only the Chart Tells the Truth.”
So, let’s see what the truthful chart has to say
Technical Analysis – Daily Chart
Current price: $4012
Gold trades below the 10-EMA ($4042) and 20-EMA ($4023) — both acting as near-term resistance.
The metal has stayed under the 10-EMA since Tuesday, Oct 21, repeatedly failing to reclaim it despite several intraday attempts.
Even the brief contact with the 20-EMA on Monday was rejected quickly, sending price lower again.
For now, gold is trying to retest the 20-EMA (4023).
The key question:
Will it manage to reclaim it, or is it preparing to visit the 50-EMA near $3852 instead?
Using Fibonacci retracements, potential correction zones appear between 3831–3701,
while Fibonacci expansions suggest 3785–3728 — roughly the same area.
These aren’t distant targets for gold, which has recently dropped nearly $400 in a single day — reminding us that “what flies too high often falls faster.”
Weekly Chart
10-EMA Support: $3870
20-EMA Support: $3670
The broader trend shows a retest of major support after a long bullish stretch.
Monthly Chart
High: $4381
Low: $3819
Range: $562
Midpoint (Key Pivot): $4100
October’s close will define the year-end bias:
Above 4100 → bullish continuation possible
Below 4100 → opens room for a deeper correction toward 3830–3700
As of now, gold is trying to hold above $4000, after hitting a weekly low at $3886 on Tuesday.
Support & Resistance Levels
Resistance:
4023 – 4030 – 4042 – 4100 – 4121 – 4144 – 4161 – 4381
Support:
3990 – 3961 – 3914 – 3886 – 3843 – 3831 – 3785 – 3728 – 3701 – 3670 – 3645
Trader’s Note – Before the Weekly & Monthly Close
Avoid emotional trades before the weekend or a major monthly close.
Long positions: watch 4040–4100 as a heavy resistance cluster.
Short positions: trail profits near 3870–3830.
Print these levels and keep them beside your screen — risk management matters more than prediction.
Disclaimer:
This analysis is for educational and informational purposes only and does not constitute trading advice.
Market conditions can change rapidly with new data or headlines.

Beyond the Chart - GOLD Market Technicals & FundamentalsOANDA:XAUUSD Long Bias & Smart Money Flow
Price tapped right into my mid-FVG zone and bounced clean textbook demand reaction.
Buyers stepped in heavy, volatility’s still alive but controlled just how we like it before the next leg.
Lower FVGs acted as accumulation, and now price is pushing toward the 4,045–4,060 zone where liquidity’s sitting pretty.
As long as we stay above the 4,015 support base, gold’s got room to keep running.
🎯 Targets: 4,045 → 4,080
❌ Invalidation: Break below 3,985 and close under the reclaimed FVG
No luck, just precision⚡

Gold holds gains but faces strong resistance at $3975📊 Market Overview:
Gold prices remain steady around $3960–$3965, sustaining upside momentum after breaking above the key $3950 resistance. The market is supported by expectations that the Fed may cut rates sooner, while a weaker USD continues to bolster gold. However, profit-taking pressure around $3970–$3975 is slowing the rally ahead of the U.S. session.
📉 Technical Analysis:
• Key Resistance: $3975 – $3985 – $4000
• Nearest Support: $3955 – $3948 – $3935
• EMA: Price is above EMA 09 & EMA 20 (H1) → short-term trend remains bullish.
• Candlestick & Momentum: H1 candles are holding above the $3950 breakout zone, confirming ongoing buying strength, though RSI nearing overbought may trigger a minor correction.
📌 Outlook:
Gold remains in a short-term uptrend above $3955. A clear break above $3975 could open the door to $3985–$4000, while a drop below $3955 may trigger a pullback toward $3948–$3935 before any rebound.
💡 Trading Strategy Suggestion:
🔺 BUY XAU/USD at: $3935 – $3932
🎯 TP: 40 / 80 / 200 pips
❌ SL: $3929
🔻 SELL XAU/USD at: $3975 – $3978
🎯 TP: 40 / 80 / 200 pips
❌ SL: $3981

It’s Not Just a Chart, It’s a Mind Game — Stay Calm, GoldRiders.First of all — congratulations to everyone who followed yesterday’s setups!
We sold in the morning and made profits, then bought during the U.S. session — and won again.
Even though the technical analysis was pointing opposite to the news direction, price movement proved once more that the chart often leads before headlines.
Some followers were confused when I mentioned the news was positive for the dollar — which normally means gold should fall — yet buyers secured safe profits above 3938. That was a wise move reflecting good risk control.
Despite the positive Richmond Manufacturing Index and Consumer Confidence data (both supportive for USD), gold respected the technical levels more than fundamentals.
This is normal, as low to medium-impact data rarely outweigh technical setups, unlike major events such as interest rate decisions, which can override technical signals completely.
From the chart:
After dropping from 4019 early yesterday to 3886 around noon, gold reversed and started forming a higher high.
Currently, any dip below 3945 signals minor weakness, below 3928 indicates stronger bearish pressure,
and a confirmed breakdown happens only under 3898–3883.
On the upside, strong resistance persists between 3970–3983, tested since last evening.
A breakout above it could open the way to 4017–4020.
Important Warning:
Today is high-risk.
Expect volatility not only during the FOMC rate decision at 9:00 PM and Jerome Powell’s speech at 9:30 PM,
but possibly much earlier — the “volatility show” can start anytime.
So please trade cautiously.
If you’re new, still learning, or your emotions or account size can’t handle sharp swings —
sit out today and observe.
For learners, use a demo account as if it’s real — that’s one of the best lessons you’ll ever get.
Also note: Meta, Microsoft, and Alphabet (Google) will release earnings today — adding even more volatility.
Bullish Scenario (Buy)
Entry: Safe entry above 3983 (aggressive from 3967)
Targets: (3972–3976) – 3982 – 3994 – 4000 – (4007–4012) – 4021 – 4031 – 4046 – 4055 – 4064 – (4072–4077) – 4084 – 4097 – 4103 – 4117
Don’t feel safe with any buy before breaking 3983. The next key resistance is 4020.
Bearish Scenario (Sell)
Entry: Safe entry below 3928 (aggressive from 3938)
Targets: (3932–3930) – 3922 – 3913 – 3906 – 3901 – 3895 – 3887 – 3873 – (3860–3856) – 3842 – 3821 – 3813 – (3804–3800) – 3793
Notes:
1- This page doesn’t engage with sarcastic or disrespectful comments — if you don’t like the post, just scroll.
Professional discussions are always welcome.
2- If you found this analysis useful, share it — your support makes a real difference!
✍️ We appreciate it, if you drop a comment if you received the analysis clearly.
Disclaimer:
This analysis reflects my personal opinion and market observation only.
It is not investment advice or a buy/sell recommendation.
Trading in financial markets involves high risk, and all decisions remain the trader’s responsibility.
Gold Consolidates Weakly Around $3925 – Sellers Still in Control📊 1. Market Overview
Gold prices rebounded slightly from the $3900 level, reaching $3931 before losing momentum. The market is now moving sideways around $3925 in a weak consolidation phase. The U.S. dollar remains firm as Treasury yields stay elevated, while traders await the upcoming PCE inflation data, limiting gold’s recovery potential.
🔍 2. Technical Analysis
• Main Trend: Bearish, with weak corrective rebounds.
• Immediate Resistance: $3930 – $3935
• Higher Resistance: $3948 – $3960
• Near-term Support: $3900 – $3890
• EMA50 & EMA200 (H1): EMA50 remains below EMA200, confirming the ongoing bearish bias.
• Candlestick Pattern: Small lower-tail candles around 3925 indicate mild buying but no clear reversal signal.
• RSI (H1): 45 – neutral, suggesting potential range-bound movement before breaking above 3930 or below 3900.
💡 3. Outlook
Gold is currently in a short-term accumulation phase after a steep drop, but the broader trend remains bearish. A rejection from the $3930–$3935 resistance zone could trigger another decline toward $3900 or even $3880. Conversely, a decisive breakout above $3935 with strong volume may extend the rebound toward $3960.
🎯 4. Trading Strategy
🔻 SELL XAU/USD: $3928 – $3932
🎯 TP: 40 / 80 / 200 pips
🛑 SL: $3938

Gold Elliott Wave Analysis – Potential Wave (4) Completion ZoneGold (XAU/USD) on the daily chart appears to be completing a classic Elliott Wave 5-wave impulse structure. After a strong rally into the wave (3) high, price is currently retracing toward the projected wave (4) correction zone.
The highlighted support area aligns with key Fibonacci retracement levels:
0.5 retracement: around $3,845
0.618 retracement: around $3,718
This region also coincides with the lower boundary of the ascending channel, adding confluence for potential bullish reversal.
If wave (4) finds support within this zone and maintains structure, a new impulsive rally toward wave (5) could begin — targeting the upper trendline resistance near $4,500–$4,600.

Gold (XAUUSD) - Trump-Induced Dip to BUY Zone
Trump's comments have sparked a corrective move in Gold, pushing it into a key demand zone. This presents a high-risk, high-reward buying opportunity for a rebound towards . The fundamental shock is seen as temporary against the broader bullish structure. #Gold #Trading #XAUUSD #BuyTheDip

GOLD short4286-4311 are key levels that I'll be expecting gold to retrace to before going short again, respecting the double top...

Gold rebounds from lows – key levels to watch: 4100 & 40081. Market Overview
Gold (XAU/USD) recovered from an early drop to $4054, now trading around $4069–$4070 as technical buying emerges near support. The market is consolidating after last week’s decline, with short-term momentum turning neutral.
2. Technical Analysis
• Resistance 1: $4100 – short-term top with EMA50 (H4) confluence.
• Resistance 2: $4135 – strong medium-term barrier.
• Support 1: $4045 – key intraday base.
• Support 2: $4008 – major medium-term floor.
• EMA20 (H1): $4078 acting as dynamic resistance.
• RSI (H1): recovering to 50 → neutral zone.
The overall structure remains slightly bearish, but candles show buyers defending the $4050 area effectively.
3.Outlook
Gold is in a technical recovery within a broader downtrend. A confirmed breakout above $4085–$4100 could target $4118–$4135.
Failure to hold above $4045 may reopen a path toward $4022–$4008.
4.Trading Plan
🔻 SELL XAU/USD : $4102–$4105
🎯 TP: 40 / 80 / 200 pips
🛑 SL: $4109
🔺 BUY XAU/USD: $4045–$4048
🎯 TP: 40 / 80 / 200 pips
🛑 SL: $4041

WE ARE SELLING Unfortunately the buy wasn't a long term one, it was a buy to create a lower high then the sells begin again which is just like how a long term buy start, so we are selling now ,
sell at 4100-4105 with sl at 4120 and allow it to run .

Gold Trade Plan 26/10/2025Dear Traders,
ased on Trump's initial comments regarding a trade war agreement with China, we will likely see selling pressure at resistance levels. The first area where the price is likely to react well is the 4200–4220 range. Considering the high liquidation above this level, I expect a 300–500 pip drop in the first reaction to this range. Also, the FOMC meeting on Wednesday is very important.
Regards,
Aireza!

FED cuts interest rates - gold prices rise next week ✍️ NOVA hello everyone, Let's comment on gold price next week from 10/27/2025 - 10/31/2025
⭐️GOLDEN INFORMATION:
Gold (XAU/USD) rebounds over 0.10% on Friday, trading near $4,127 after recovering from $4,043 lows, as softer-than-expected US inflation data reinforced expectations of a Fed rate cut next week. The CPI report broadly met forecasts but offered little support for hawkish policymakers.
⭐️Personal comments NOVA:
Gold price recovers, positive next week when FED almost continues to reduce interest rate by 0.25%. Opportunity for gold to return above 4200, 4300
🔥 Technically:
Based on the resistance and support areas of the gold price according to the H4 frame, NOVA identifies the important key areas as follows:
Resistance: $4153, $4237, $4380
Support: $4045, $3944
🔥 NOTE:
Note: Nova wishes traders to manage their capital well
- take the number of lots that match your capital
- Takeprofit equal to 4-6% of capital account
- Stoplose equal to 2-3% of capital account
- The winner is the one who sticks with the market the longest

Gold will likely rocket to over $10,000...Gold will likely rocket to over $10,000...
Once it can breakout versus the US stock markets.
