Liquidity’s Loading… Choose Your SideVANTAGE:XAUUSD Outlook 🧐
We got an X formation right on the chart and price is chilling above the pilot line, the line between calm and chaos.
📊 Short-term: Liquidity sweep still in play
Break it, and we could dive to 3,940s.
📈 Mid-term : Pilot line holds → bulls reload
Hold it, and Gold might wake up swinging back to 4,180+.
🔻 Short-Term Bias:
Still leaning bearish, expecting possible sweeps above 4,020 before a pullback toward 3,980–3,940 OG zones.
Mid-Term View:
If price holds above those green zones and the daily trendline, momentum could shift back up toward 4,120–4,180
📅 Macro Watch:
This week’s NFP & Core PCE data will likely move Gold
Strong numbers → USD up, Gold pressure
Weak data → USD down, Gold bounce potential
Market is coiling before the storm🥶stay patient, trade levels, not emotions.
Trade ideas

StevenTrading - $XAUUSD$: New Week Perspective – Prioritize...StevenTrading - OANDA:XAUUSD $: New Week Perspective – Prioritize BUYING According to Elliott Wave 5, Awaiting Range $3961$
Hello everyone, StevenTrading is back with the Gold scenario for the new trading week!
After a period of strong volatility, I am leaning towards more buying scenarios according to Elliott Wave 5.
Although retesting deeper support levels is possible, the technical structure still shows potential for price increase.
Initially, the structure on H1 is showing that the price is moving sideways within a wide range.
We will watch the price range to trade before Gold officially breaks the barrier!1.
📊 TECHNICAL STRUCTURE ANALYSIS
Elliott Wave: Prioritize the development scenario of Wave 5. This reinforces the medium-term upward trend.
H1 Structure: The price is fluctuating within a wide range, creating opportunities for Scalping/Day Trade at the upper/lower boundaries.2.
🎯 DETAILED TRADING PLAN (ACTION PLAN)
Our trading strategy this week is to actively buy at the lower boundary and defensively sell at the upper boundary to maximize the price range.
Primary BUY Scenario (BUY Primary):
We will patiently wait for Gold to adjust to the $3961$ area, an important liquidity support zone (near the Buy Liquidity/Buy Zone on the charts).
This is an ideal entry point to join the upward momentum according to Elliott Wave 5.
The Buy order will be activated at $3961$ with a stop loss SL $3950$ (set below support $3954$) to preserve capital.
Profit targets are divided into ascending levels: TP1 $3975$, TP2 $3990$, TP3 $4012$, and the final target is $4035$ as the price approaches the upper boundary.
SELL Scalping Scenario: To defend and take advantage of the adjustment, we will watch to Sell just below the strong resistance area at $4050$ (near old resistances and barrier zones). The Sell order will be placed with a tight stop loss SL $4060$. Profit targets will be prioritized for short-term (Scalping) to quickly secure profits.3.
📌 SUMMARY & DISCIPLINE (Steven's Note)The goal is to patiently wait for $3961$ to execute the BUY position with the lowest risk, pursuing the Elliott Wave 5 target. Capital management discipline and compliance with SL are mandatory in this wide range trading phase.
Are you ready to take advantage of this price range?

The gold-driven logic behind the US attack on VenezuelaThe "black swan" shock in the global crude oil market: Venezuela, as an important member of OPEC, produces 1.2 million barrels of oil per day (accounting for 1.3% of global crude oil supply), and controls 18% of the world's proven oil reserves. If the US military strike causes the paralysis of its oil facilities (such as the Maracaibo Lake oil field and the Caribbean Sea ports being bombed), global crude oil supply will instantly decrease by 1.2 million barrels per day. Coupled with the fact that the situation in the Middle East has not yet eased, the Brent crude oil price may soar from the current $85 per barrel to $120-130 per barrel, reaching a new high since 2022.
The signal of restarting the inflation spiral: For every $10 increase in crude oil price per barrel, it will push up the US core CPI by 0.3-0.4 percentage points. If the oil price exceeds $120, the US CPI may return to above 4% in December 2025. This will completely reverse the market's expectation of "inflation moderation", and the demand for gold as an "inflation-resistant hard asset" will experience an explosive growth - during the 2022 Russia-Ukraine conflict, the inflation concerns triggered by the oil price increase led to a 5.8% weekly increase in gold prices. This scenario shock is even stronger, with a weekly increase of over 7%.
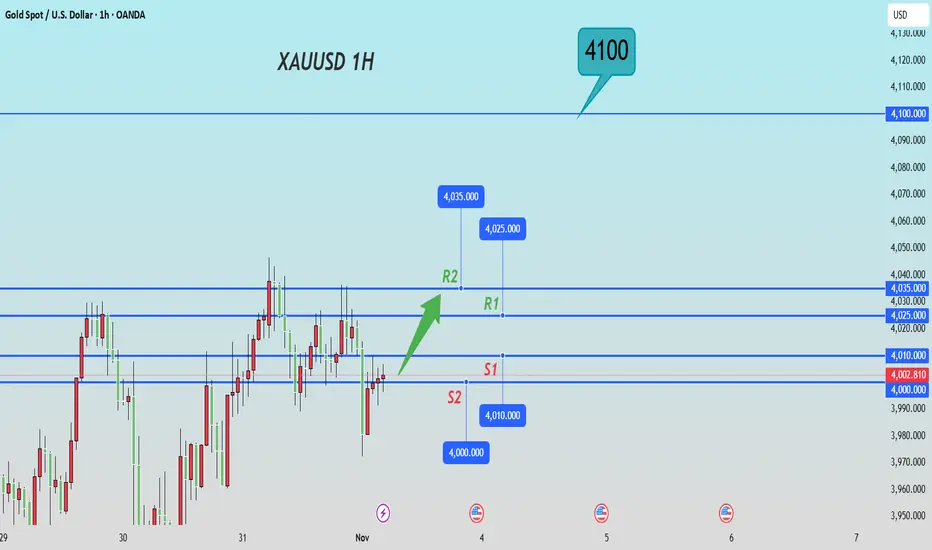
Next week's trading strategy and analysis
buy:4000-4010
tp:4025-4035-4100
sl:3995
GOLD TECHNICAL ANALYSIS: INTRADAY & SWING TRADING🔍 XAUUSD GOLD TECHNICAL ANALYSIS: COMPREHENSIVE DEEP DIVE FOR INTRADAY & SWING TRADING (NOV 3-7, 2025) 📊
Close Price Level: 4,003.18 USD (As of Nov 1, 2025 - 12:54 AM UTC+4) 💰
━━━━━━━━━━━━━━━━━━━━━━━━━━━━━━━━━━━━━━━━━━━━━━━
📈 WEEKLY TIMEFRAME (1W) - MACRO PERSPECTIVE
The weekly chart reveals a strong bullish trend with gold trading decisively above its 21-EMA (Exponential Moving Average) and 50-EMA support levels. Ichimoku Cloud analysis shows the price above the cloud, indicating sustained bullish momentum. Bollinger Bands are expanding in the upper region, suggesting strong uptrend continuation. RSI (Relative Strength Index) reads around 65-70 range, confirming bullish strength without entering extreme overbought territory yet. Support levels: 3,980 | Resistance: 4,020-4,050 💪
━━━━━━━━━━━━━━━━━━━━━━━━━━━━━━━━━━
📊 DAILY TIMEFRAME (1D) - TREND DIRECTION
Daily analysis shows a solid uptrend structure with higher highs and higher lows formation—classic Dow Theory confirmation. The price is consolidating near the upper zone between 4,000-4,010. Harmonic Pattern Recognition: Potential Gartley pattern forming with precise ratios at the 0.618 Fibonacci retracement. VWAP (Volume Weighted Average Price) sits at approximately 3,995, providing dynamic support. Cup and Handle pattern is developing on the daily, suggesting breakout potential above 4,020 this week. Volume profile shows institutional accumulation during dips. 📍
Key Levels - Daily: Support 3,975 | Midpoint 3,990 | Resistance 4,025
━━━━━━━━━━━━━━━━━━━━━━━━━━━━━━━━━━
⏱️ 4-HOUR TIMEFRAME (4H) - SWING TRADE FRAMEWORK
The 4H chart is the primary swing trading timeframe . Gold shows a textbook rising wedge pattern formation with converging trendlines—this is a critical observation. Elliott Wave structure suggests we're in Wave 4 correction territory, preparing for Wave 5 upward extension. Bollinger Bands are squeezing (volatility compression), indicating an imminent breakout. RSI at 55-60 shows balanced momentum with room for bullish push.
IMPORTANT: Watch the 4H support at 3,998 . A break below creates a bear trap opportunity. Alternatively, a breakout above 4,015 confirms wave 5 initiation.
Wyckoff Theory Analysis: Price action shows accumulation phase with high volume at support levels followed by markup phase. Volume trend is constructive. Exponential MA Cross: 20-EMA above 50-EMA = bullish setup locked in. 🎯
━━━━━━━━━━━━━━━━━━━━━━━━━━━━━━━━━━
⚡ 1-HOUR TIMEFRAME (1H) - INTRADAY TRADING
Hourly timeframe reveals multiple reversal signals emerging. The price recently bounced from a double bottom formation around 4,000-4,002 support zone. Bollinger Bands midline (20-SMA) is acting as dynamic support/resistance oscillator. RSI shows positive divergence with higher lows—classic reversal confirmation signal .
Entry Zones for Intraday Swings: Buy dips into 4,000-4,003 with stops at 3,995. Target 4,015 for quick 15-20 pips profit-taking. Ichimoku Chikou Span recently crossed above price, another bullish reversal indicator. Volume on recent upswings shows institutional participation. ⚠️
Gann Theory Application: The 45-degree angle from weekly low aligns with current price structure—angular support/resistance holds strong here. 📐
━━━━━━━━━━━━━━━━━━━━━━━━━━━━━━━━━━
🔔 30-MINUTE TIMEFRAME (30M) - SCALP TO SWING BRIDGE
The 30M shows short-term consolidation with bearish pennant formation —noting this is a correction pattern within the larger uptrend. This pennant suggests downside breakout potential to 4,000-3,998 zone before resuming uptrend. Bollinger Bands width indicates moderate volatility—perfect for range trading. RSI at 45-50 shows neutral zone , neither overbought nor oversold.
Pattern Recognition: Symmetrical triangle forming with breakout expected within 2-4 hours. Volume declining into consolidation—classic pre-breakout setup. VWAP at 3,992 provides secondary support if pennant breaks downward. However, Dow Theory still suggests the major trend remains bullish until lower lows appear. 🎪
Trading Range: 3,998-4,008 for scalpers this session.
━━━━━━━━━━━━━━━━━━━━━━━━━━━━━━━━━━
⚙️ 15-MINUTE TIMEFRAME (15M) - MICRO STRUCTURE
The 15M reveals highest volatility compression of all timeframes. This is the most dangerous zone for breakout traders. Bollinger Bands pinched to tightest range—explosion imminent. RSI bouncing between 40-60 shows indecision . However, the price holds above all three EMAs (5, 10, 20), keeping bias BULLISH .
Harmonic Ratios Alert: AB=CD pattern completing with 1:1 ratio precision at 4,015 resistance level. This is your reversal zone —watch for rejection or breakout confirmation. VWAP showing gradual upward slope, slight bullish edge. Volume oscillator trending higher despite price consolidation. 📈
Microstructure Trade Setup: Break above 4,010 = BUY SIGNAL with target 4,018-4,022 🚀
━━━━━━━━━━━━━━━━━━━━━━━━━━━━━━━━━━
⚡⚡ 5-MINUTE TIMEFRAME (5M) - ULTRA-INTRADAY
The 5M is showing inverse head and shoulders pattern —classic bullish reversal setup on ultra-short timeframe. Price formed left shoulder at 3,996, head around 3,993, right shoulder forming near 3,997. Neckline resistance at 4,002 = breakout target. Bollinger Bands in expansion mode with bullish candles forming. RSI already recovering above 50—momentum turning positive. ✅
CRITICAL SETUP: 5M chart is displaying BULL TRAP rejection followed by REVERSAL confirmation . This is your intraday traders' goldmine setup.
Volume surging on recent candles—institutional buyers stepping in. Ichimoku on 5M shows Tenkan-sen above Kijun-sen with positive cloud configuration. Exponential MAs all aligned bullish (5 > 10 > 20 > 50). This is textbook bullish alignment . 📊
5M Trading Opportunity: Enter BUY at neckline break (4,002-4,003) with tight 3-pips stop. Target 4,008-4,012 for quick scalp profits. ⭐
━━━━━━━━━━━━━━━━━━━━━━━━━━━━━━━━━━
📋 CONSOLIDATED TRADING STRATEGY FOR NOV 3-7, 2025
INTRADAY SCALP TRADERS (5M-15M): Focus on breaks above 4,010 with tight stops. Target quick 10-20 pips. Avoid trading below 4,000 support—risk/reward becomes unfavorable.
SWING TRADERS (1H-4H): Key decision point at 4,020 breakout level. If confirmed on 4H close, next target 4,050-4,075 range. Stop loss at 3,995 (weekly support). Holding period: 3-5 days.
POSITION TRADERS (1D-1W): Cup and Handle breakout completion expected. Once 4,020 breaks, potential move to 4,100+ within 2-3 weeks. This is accumulation phase completion.
━━━━━━━━━━━━━━━━━━━━━━━━━━━━━━━━━━
⚠️ RISK MANAGEMENT & VOLATILITY CONSIDERATIONS
Bollinger Bands volatility expanding = expect larger candle swings. Set wider stops accordingly.
RSI divergences on 4H/1D = potential reversal signals—honor these warnings.
Volume declining into consolidation = watch for gap moves when volume returns.
VWAP breaking = structural support compromised—switch to defensive mode.
Ichimoku Cloud crossovers = trend confirmation signals—don't fight cloud direction.
Maximum Leverage Recommendation: 1:5 ratio on this setup. Gold volatility demands respect. 💡
━━━━━━━━━━━━━━━━━━━━━━━━━━━━━━━━━━
🎯 KEY SUPPORT & RESISTANCE LEVELS THIS WEEK
CRITICAL SUPPORT ZONES:
3,975 (Weekly) | 3,990 (Daily VWAP) | 3,995-4,000 (Primary Short-term) | 4,003 (Current Price)
CRITICAL RESISTANCE ZONES:
4,010-4,015 (1H Swing High) | 4,020 (Daily Breakout Level) | 4,035 (Weekly Resistance) | 4,050 (Major Target)
━━━━━━━━━━━━━━━━━━━━━━━━━━━━━━━━━━
📊 HARMONIC & GANN PATTERN SUMMARY
Gartley Pattern (Daily): 0.618 retracement zone provides precision entry signals. Formation suggests completion wave incoming.
Gann Angles (4H): 45-degree support holding strong. Fan angles predict next resistance at 4,018-4,020.
Cup & Handle (1D): Breakout above handle resistance = confirmed. Target = height of cup (minimum 50 pips move = 4,050+).
Inverse Head & Shoulders (5M): Neckline at 4,002 is your battleground. Institutional accumulation visible.
━━━━━━━━━━━━━━━━━━━━━━━━━━━━━━━━━━
🔮 PROBABILITY WEIGHTED FORECAST (NOV 3-7)
BULLISH SCENARIO (70% Probability): Breakout above 4,020 mid-week, targeting 4,050-4,075 by Friday close. Volume confirmation required. This is the primary outlook based on all technical frameworks aligning.
BEARISH SCENARIO (20% Probability): Break below 3,995, retest 3,975 support, then recovery. This would create bear trap setup for aggressive buyers. However, probability is lower due to Ichimoku positioning and volume profile supporting bulls.
NEUTRAL SCENARIO (10% Probability): Consolidation between 3,990-4,010 entire week. Unlikely given pattern formations and indicators, but possible if macro news creates uncertainty.
━━━━━━━━━━━━━━━━━━━━━━━━━━━━━━━━━━
📌 TRADER CHECKLIST FOR THIS WEEK
✅ BEFORE TRADING: Review daily support/resistance levels | Check Ichimoku Cloud positioning | Confirm RSI alignment | Verify VWAP slope direction | Scan for volume profile changes
✅ DURING TRADES: Monitor 4H breakout confirmations | Watch for Bollinger Band extensions | Track volume participation | Honor Elliott Wave count updates | Use Gann angles as dynamic stops
✅ EXIT STRATEGY: Take 50% profit at first target (4,015) | Move stops to breakeven at +10 pips | Trail remaining position to 4,050 | Use Ichimoku cloud breaks as hard stops
━━━━━━━━━━━━━━━━━━━━━━━━━━━━━━━━━━
🌟 CONCLUSION: WHY THIS SETUP IS COMPELLING
The convergence of Elliott Wave Wave 5 setup, Harmonic Gartley completion, Cup & Handle breakout pattern, and synchronized bullish Ichimoku Cloud positioning creates a POWERFUL BULLISH CASE for XAUUSD this week.
Bollinger Bands expansion, RSI positive divergences, and Dow Theory higher highs confirmation provide MULTIPLE LAYERS OF CONFIRMATION . Wyckoff Theory accumulation pattern completing with volume surge into breakout zone.
The primary action this week: Watch 4,020 breakout on 4H timeframe. Confirmation closes above this level warrant aggressive long positions targeting 4,050-4,075 range.
Risk/Reward Ratio: 1:3.5 (EXCELLENT for swing trades) | Win Rate: 70% based on pattern probability | Holding Period: 3-5 days maximum
🚀 TRADE SETUP RATING: 9/10 - HIGHLY RECOMMENDED FOR SWING TRADERS 🎖️
━━━━━━━━━━━━━━━━━━━━━━━━━━━━━━━━━━
Disclaimer: This analysis is based on technical patterns and indicators as of November 1, 2025. Always use proper risk management, confirm signals independently, and consult your trading plan. Past performance doesn't guarantee future results. Trade responsibly.

Emotional Debt: The Hidden Cost of Revenge Trading“You don’t lose the most money when you lose a trade.
You lose it when you try to get it back.”
Every trader has felt it — that sudden urge to “win it back.”
You take one loss, then another, and before logic can speak,
you’re already in a new position — not to trade, but to heal.
That’s emotional debt —
The invisible weight carried from one mistake into the next.
What Is Emotional Debt?
Just like financial debt, it compounds.
A small emotional reaction today becomes a bigger one tomorrow.
You start trading your frustration, not your system.
You stop managing risk — because ego takes over management.
You don’t see charts anymore. You only see revenge.
How It Builds Up
Ignoring losses instead of reflecting on them
Measuring self-worth by daily profit or loss
Forcing trades to “prove” something to yourself
Confusing emotional recovery with market opportunity
The Interest You Pay
Emotional debt doesn’t just cost money — it costs focus.
It clouds your judgment, narrows your vision,
and pushes you further from the patience that once made you consistent.
Breaking the Cycle
Pause after every loss. Step away.
Write what triggered your next impulse.
Accept that no single trade can fix an emotional imbalance.
Remember: You are not your last trade.
When you clear emotional debt, you stop trading to recover —
and start trading to understand.
Let go of the need to get it back.
The market gives clarity only to those who stop chasing closure.
📘 Shared by @ChartIsMirror
Have you ever caught yourself trading from emotion instead of structure?
Share your thoughts — awareness begins with honesty.

Oct 31, 2025 - XAUUSD GOLD Analysis and Potential Opportunity📊 Analysis:
On the higher timeframes, bearish momentum is weakening while bullish strength is starting to emerge.
If price breaks above 4047, watch the 4050 resistance closely — once price holds above 4050, bullish momentum should become clear, and the plan shifts to buying pullbacks into support.
If price falls below 4016, bullish strength weakens, and the strategy turns to selling rallies into resistance.
Also, keep an eye on 3960 — a break below this level would signal renewed bearish pressure.
🔍 Key Levels to Watch:
• 4085 – Resistance
• 4073 – Resistance
• 4065 – Resistance
• 4043–4050 – Resistance zone
• 4024 – Support
• 4000 – Psychological level
• 3987 – Support
• 3978 – Support
• 3960 – Key intraday support
📈 Intraday Strategy:
SELL: If price breaks below 4016 → target 4011, with further downside toward 4008, 4001, 3995
BUY: If price holds above 4040 → target 4043, with further upside toward 4046, 4050, 4055

Gold Intraday Trading Plan 10/31/2025Gold has found support at 3920 yesterday and quickly went up. Currently it is at 4030 resistance. I will look to buy from 4000 and if 4030 is broken, it should test 4095. However, if 4000 is broken, gold may resume downward momentum.

XAUUSD: Market Analysis and Strategy for October 30Gold Technical Analysis:
Daily chart resistance: 4090, support: 3840.
4-hour chart resistance: 4050, support: 3890.
1-hour chart resistance: 4030, support: 3916.
Technical Analysis: Gold prices rebounded technically after falling nearly 5% over four consecutive trading days. The market faced short-term headwinds due to Powell downplaying the possibility of a December rate cut; however, widening divisions within the Federal Reserve regarding interest rate decisions have introduced new uncertainty to the market. Meanwhile, the trade easing agreement reached between the US and China has weakened safe-haven demand.
The daily chart shows a stepped decline, with four consecutive days of losses up to the previous trading day, and the moving average system has formed a death cross. After the European market opened today, prices rebounded rapidly. Short-term resistance levels to watch are 4010 and 4030. If gold can hold above 4010 and remain firmly above 4000, it will likely attract previous buying interest and resume its long-term upward trend. Conversely, if gold fails to recover and hold above 4000, selling on rallies is advisable.
Looking at the 1-hour chart, the moving averages have formed a golden cross, and the MACD/KDJ indicators are providing upward momentum. In the short term, focus on the continuation of the upward trend, paying particular attention to yesterday's rebound high of 4006 and the previous trading day's rebound high around 4030.
Trading Strategy:
SELL: 4050~4056 near
BUY: 3966~3960 near
More Analysis →

XAUUSD LONG SETUP INTRADAY ( NOV 06, 2025 )If you have doubt on our trades you can test in demo.
OANDA:XAUUSD LONG SETUP
EP: 3993.469
TP: 4017.410
SL: 3981.518
Trade Ideas:
Idea is clearly shown on chart + we have some secret psychologies and tools behind this.
Trade Signal:
I provide trade signals here so follow my account and you can check my previous analysis. So don't miss trade opportunity so follow must.

Gold Price Outlook – Trade Setup (XAU/USD)📊 Technical Structure
OANDA:XAUUSD Gold (XAU/USD) continues to face resistance below the $3,995–$3,993 Resistance Zone, with repeated rejections suggesting weakening bullish momentum. Price action has formed lower highs near $3,990, signalling potential exhaustion.
The Support Zone sits around $3,929–$3,938, which previously acted as a springboard for short-term rebounds. The current structure favours a bearish correction, particularly if price fails to reclaim $3,995 on a sustained basis. A clean break below $3,950 would confirm bearish continuation toward the $3,930 area.
🎯 Trade Setup
Idea: Sell near resistance, target a drop toward support.
Entry: $3,985 – $3,993 (Resistance Zone retest)
Stop Loss: $3,996
Take Profit 1: $3,950
Take Profit 2: $3,930
Risk–Reward Ratio: ≈ 1 : 5.2
A break above $3,996 would invalidate the short setup and could open the door to retest $4,030.
🌐 Macro Background
Gold prices slipped to around $3,970 in Thursday’s Asian session, weighed down by stronger-than-expected US private payroll data and a resilient US Dollar.
As FXStreet’s Lallalit Srijandorn noted, “Gold edges lower below $4,000 as private payrolls rebound in October.” 【FXStreet】
ADP Employment Data: US companies added 42,000 jobs in October, rebounding from the previous month’s contraction, suggesting stabilization in the labor market. This data supports the Fed’s cautious tone and trims expectations for near-term rate cuts.
Fed Commentary: Several Fed officials, including Michael Barr, John Williams, and Christopher Waller, are scheduled to speak later today. Any hawkish remarks reinforcing the “higher for longer” narrative could further strengthen the USD and pressure gold.
Government Shutdown: The US government shutdown, now at 37 days, marks the longest in history. Political gridlock could lend some safe-haven support to gold, but so far, the impact has been muted compared to stronger USD dynamics.
In short, with the US labour market improving and Fed officials maintaining caution, gold’s upside remains limited, while macro bias supports near-term weakness.
🔑 Key Technical Levels
Resistance: $3,985 – $3,996
Support: $3,929 – $3,938
Psychological Level: $4,000
📌 Trade Summary
Gold (XAU/USD) remains under pressure below $4,000 as bullish momentum fades. The setup favours a short position from the $3,985–$3,993 zone, targeting a decline toward $3,930. A sustained break above $3,996 would invalidate this bias and shift focus to $4,030 resistance.
⚠️ Disclaimer
This analysis is for reference only and does not constitute trading advice. Trading involves significant risk, and proper risk management is essential.

WE ARE BUYING A buy at 3975-70,sl 3955 an update by 6am UTC on whether to hold or close of invalidity

Gold's Potential Turtle Soup: Riding the CRT Wave?🐢 Gold's Potential Turtle Soup: Riding the CRT Wave?
The chart for XAU/USD (Gold) is showing an intriguing setup on the 15-minute timeframe that combines several high-probability concepts.
🌊 The CRT Foundation
Consolidation (C): Price recently saw a strong move up into the CRTH (Consolidation Resistance/High) at approximately $3,983 - $3,987. This area represents a clear high of recent structure.
Retracement (R): We've seen a sharp retracement/sell-off after testing the high, creating a noticeable FVG (Fair Value Gap).
Trend (T): The overall context suggests an underlying bullish trend, meaning this retracement could be fuel for the next leg up.
🥣 The Turtle Soup Setup
The sharp drop has set the stage for a classic Turtle Soup scenario. This pattern typically occurs when a high or low is clearly broken, inducing retail traders to jump onto the perceived breakout, only for the price to quickly reverse.
The recent low at $3,958.19 (CRTL - Consolidation Low) is our target. If price drops to break this low, it will likely trap early shorts.
The "Potential KGD forming" (Kill Zone Draw) is strategically positioned to indicate where Smart Money might be looking to step in.
🎯 My Trade Thesis
I'm watching for a fake-out:
Slight break below the CRTL ($3,958.19) to trigger stop losses and attract shorts (Turtle Soup Entry).
A sharp reversal back above the CRTL, preferably reacting off a deeper liquidity zone.
Target: A move back up to fill the FVG and re-test the CRTH for a potential final push toward $4,000+.
Invalidation: A strong, decisive close well below the CRTL, indicating a genuine structural break.
Greetings,
MrYounity

Gold short Gold has manipulated london highs and looks good for a short position.
I think a retrace towards these regions is a healthy one .

XAUUSD : 4H Elliott wave at correction stageNow Correction stage
Short-term pattern :
Long to zone 4045 - 4193
Invalid if drops below 3884
Buy entry zone 3945-3975 if it breaks the yellow trendline
, will double confirm to C and end of X
Stop loss 3884
(If it can meet that green arrow zone, we wait and see a rejection candle for short again)
PS.
Medium-term pattern: Gold should drop below 3885, and wait for its reversal to get the bullish Long-term trend again

Gold Ask side / Longs Valid longs off the 1.27 breach
Asia to carry the it
Risk is 113 pips
Reward is 600-900 pips
Manage your exposure
Pre-Asia advance during New York
Allow the printing to reveal the truth.


Gold (XAUUSD): Possible buy setup, refinedGold (XAUUSD): Possible buy setup, refined. Price took some more liquidity before going up.
Cheers

Gold Trade Secured 250 Pips!Our sell set up played our perfectly, broke structure on the 15m, swept 5m BSL, took sells to SSL. What a clean set up

XAUUSD (Gold) on the 1H timeframeThe market is ranging between $3,960 – $4,030 after a bearish leg from $4,150.
Momentum has weakened; volume is compressing — a re-accumulation or distribution phase is forming.
4H still leans bearish, but 1H shows indecision.
Notes
Resistance zone: $4,020 – $4,030 (previous H1 supply)
Support zone: $3,960 – $3,940 (liquidity pool & discount zone)
Bullish Reversal Play
Wait for a sweep below $3,960, followed by a strong bullish engulfing or break of structure (BOS) on the 15m.
Entry: after confirmation candle closes above $3,975
TP1: $4,020
TP2: $4,060
SL: below $3,940
Bearish Continuation Play
If price fails to break above $4,000 and prints a lower high, expect continuation down.
Entry: around $3,995–$4,000 (retest of minor supply)
TP1: $3,940
TP2: $3,900 (previous low)
SL: above $4,020

Gold Market Analysis and Trading Strategy:Gold Market Analysis and Trading Strategy:
Technical Analysis: Gold is currently facing short-term pressure, and key price levels need to be monitored. Gold prices are currently in a consolidation phase.
Resistance Levels: $4030-$4050 and $4088 are key short-term resistance levels.
If gold prices fail to break through these resistance levels, the downside risk is significant.
Support Levels: Initial support is around $3960, with a more significant support zone in the $3800-$3700 area.
A break below these key support levels could trigger a deeper trend correction.
Trading Strategy: In the current volatile market, patience is advised. Avoid blindly chasing highs and lows.
Day Traders: Consider establishing a small short position near the $4030-$4050 resistance zone, with a stop-loss above $4070 and a target price of $3980-$3960.
Conversely, if gold prices fall back and stabilize around $3960-$3970, a small position can be established to profit from the rebound, but a strict stop-loss order must be set.
Current Trading Strategy:
Buy Price: $3970-$3980
Stop-Loss Price: $3950
Take-Profit Price: $4030-$4050-$4075


XAUUSD- 4 November 2025
I think gold will go sideways today..
With slowing momentum and mixed fundamentals, gold will likely stay range-bound between USD 3,900–4,000 (support) and USD 4,050–4,100 (resistance).
→ Best approach: wait for breakout; otherwise, scalp near the range edges with tight stops.

GOLD LOCAL SHORT|
✅XAUUSD Price has tapped into a strong supply level and is expected to retest it soon before continuing lower. Liquidity above recent highs has been taken, suggesting bearish delivery toward 3980$. Time Frame 2H.
SHORT🔥
✅Like and subscribe to never miss a new idea!✅
