GOLD H1 – Awaiting CPI Data for Next Big Move🟡 XAUUSD – Intraday Smart Money Plan | by Ryan_TitanTrader (12/11)
📈 Market Context
Gold remains in a controlled retracement phase after a strong impulsive leg last week. The market is now consolidating within a defined 1H range, showing clear reactions near short-term EMAs as traders await today’s U.S. CPI release, a key driver of intraday volatility.
• A higher-than-expected CPI could reignite USD strength and push gold toward the discount zone.
• A softer CPI print may trigger a renewed push into the premium zone, inviting liquidity grabs above 4200.
Institutional flows remain balanced between short-term profit-taking and position building ahead of the inflation print, suggesting engineered liquidity sweeps before the real move unfolds.
🔎 Technical Analysis (1H / SMC Style)
• Structure: Market structure is still bullish but showing distribution signs at the top of the range.
• Premium Zone: 4201–4199 aligns with unmitigated supply — a prime area for potential sell-side reaction if CPI sparks a bullish liquidity sweep.
• Discount Zone: 4083–4081 overlaps with the 0.618 Fibonacci retracement and sits just above EMA100 — an ideal re-accumulation area for institutional buys.
• Liquidity: Equal lows near 4080 and equal highs near 4200 make both sides vulnerable to engineered stop-hunts before direction is confirmed.
🔴 Sell Setup (Premium Reaction Zone)
• Entry: 4,201 – 4,199
• Stop-Loss: 4,210
• Take-Profit Targets:
→ 4,140 (first liquidity pocket)
→ 4,102 (mid-range equilibrium)
→ 4,083 (discount zone confluence)
📌 Only valid if CPI causes a liquidity sweep into premium, followed by M5–M15 bearish BOS confirmation.
🟢 Buy Setup (Discount Reaction Zone)
• Entry: 4,081 – 4,083
• Stop-Loss: 4,074
• Take-Profit Targets:
→ 4,102
→ 4,140
→ 4,199
📌 Only valid if price sweeps 4080 liquidity and reclaims structure with bullish BOS on M15 timeframe.
⚠️ Risk Management Notes
• Wait for CPI-induced volatility before executing any setup.
• Avoid mid-range trades between 4100–4140 — this is equilibrium noise.
• Reduce size pre-news; volatility spikes can trigger premature stops.
• Scale partials at each liquidity pocket and trail stop-losses accordingly.
✅ Summary
Gold is consolidating ahead of CPI, with dual liquidity zones clearly defined:
• Sell zone: 4201–4199 (premium reaction area)
• Buy zone: 4083–4081 (discount re-entry area)
The market is likely to hunt one side of liquidity before revealing true intent. Traders should remain patient, trade from extremes, and align entries with confirmed structure shifts.
FOLLOW @Ryan_TitanTrader for real-time SMC updates ⚡
Trade ideas

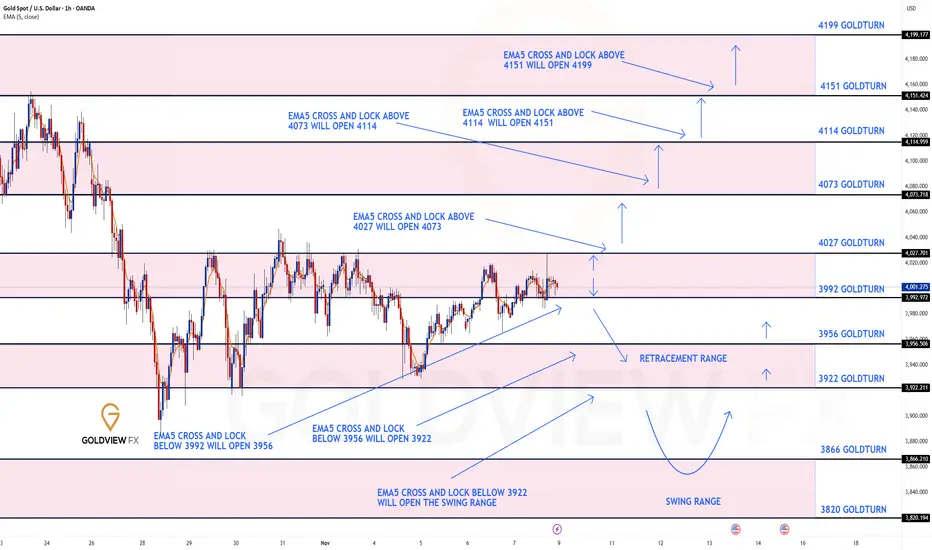
GOLD 1H CHART ROUTE MAP UPDATE & TRADING PLAN FOR THE WEEKHey Everyone,
Please see our updated 1h chart levels and targets for the coming week.
We are seeing price play between two weighted levels with a gap above at 4027 and a gap below at 3992. We will need to see ema5 cross and lock on either weighted level to determine the next range.
We will see levels tested side by side until one of the weighted levels break and lock to confirm direction for the next range.
We will keep the above in mind when taking buys from dips. Our updated levels and weighted levels will allow us to track the movement down and then catch bounces up.
We will continue to buy dips using our support levels taking 20 to 40 pips. As stated before each of our level structures give 20 to 40 pip bounces, which is enough for a nice entry and exit. If you back test the levels we shared every week for the past 24 months, you can see how effectively they were used to trade with or against short/mid term swings and trends.
The swing range give bigger bounces then our weighted levels that's the difference between weighted levels and swing ranges.
BULLISH TARGET
4027
EMA5 CROSS AND LOCK ABOVE 4027 WILL OPEN THE FOLLOWING BULLISH TARGETS
4073
EMA5 CROSS AND LOCK ABOVE 4073 WILL OPEN THE FOLLOWING BULLISH TARGET
4114
EMA5 CROSS AND LOCK ABOVE 4114 WILL OPEN THE FOLLOWING BULLISH TARGET
4151
EMA5 CROSS AND LOCK ABOVE 4151 WILL OPEN THE FOLLOWING BULLISH TARGET
4199
BEARISH TARGETS
3992
EMA5 CROSS AND LOCK BELOW 3992 WILL OPEN THE FOLLOWING BEARISH TARGET
3956
EMA5 CROSS AND LOCK BELOW 3956 WILL OPEN THE FOLLOWING BEARISH TARGET
3922
EMA5 CROSS AND LOCK BELOW 3922 WILL OPEN THE SWING RANGE
3866
3820
As always, we will keep you all updated with regular updates throughout the week and how we manage the active ideas and setups. Thank you all for your likes, comments and follows, we really appreciate it!
Mr Gold
GoldViewFX
Gold: Healthy Correction Before a Fresh High?Hey Traders, in today's trading session we are monitoring XAUUSD for a buying opportunity around 4,135 zone, Gold is trading in an uptrend and currently is in a correction phase in which it is approaching the trend at 4,135 support and resistance area.
Trade safe, Joe.

XAUUSD Buyers Step In — Market Aiming for $4,140 RetestHello traders! Let’s take a look at XAUUSD (Gold). XAUUSD maintains a bullish structure after bouncing from the key $4,050–$4,060 support zone, where price also retested the ascending trendline. After breaking out of the descending channel, Gold formed a new accumulation zone and moved higher, approaching the strong $4,140 resistance level. The price is now trading between the ascending support and the local supply zone near $4,140, forming a tightening structure. A breakout above this level could open the way for further upside, while a rejection may trigger a correction back toward $4,060. As long as XAUUSD holds above $4,060 and the ascending trendline, a renewed move toward $4,140 remains likely, with potential for a breakout. Please share this idea with your friends and click Boost 🚀

GOLD 4H CHART ROUTE MAP UPDATE & TRADING PLAN FOR THE WEEKHey Everyone,
Please see our updated 4h chart levels and targets for the coming week.
We are seeing price play between two weighted levels with a gap above at 4124 and a gap below at 4042. We will need to see ema5 cross and lock on either weighted level to determine the next range.
We will see levels tested side by side until one of the weighted levels break and lock to confirm direction for the next range.
We will keep the above in mind when taking buys from dips. Our updated levels and weighted levels will allow us to track the movement down and then catch bounces up.
We will continue to buy dips using our support levels taking 20 to 40 pips. As stated before each of our level structures give 20 to 40 pip bounces, which is enough for a nice entry and exit. If you back test the levels we shared every week for the past 24 months, you can see how effectively they were used to trade with or against short/mid term swings and trends.
The swing range give bigger bounces then our weighted levels that's the difference between weighted levels and swing ranges.
BULLISH TARGET
4124
EMA5 CROSS AND LOCK ABOVE 4124 WILL OPEN THE FOLLOWING BULLISH TARGETS
4212
EMA5 CROSS AND LOCK ABOVE 4212 WILL OPEN THE FOLLOWING BULLISH TARGET
4328
EMA5 CROSS AND LOCK ABOVE 4328 WILL OPEN THE FOLLOWING BULLISH TARGET
4422
EMA5 CROSS AND LOCK ABOVE 4422 WILL OPEN THE FOLLOWING BULLISH TARGET
4422
EMA5 CROSS AND LOCK ABOVE 4422 WILL OPEN THE FOLLOWING BULLISH TARGET
4494
BEARISH TARGETS
4042
EMA5 CROSS AND LOCK BELOW 4042WILL OPEN THE FOLLOWING BEARISH TARGET
3964
EMA5 CROSS AND LOCK BELOW 3964 WILL OPEN THE FOLLOWING BEARISH TARGET
3873
EMA5 CROSS AND LOCK BELOW 3873 WILL OPEN THE SWING RANGE
3767
3646
As always, we will keep you all updated with regular updates throughout the week and how we manage the active ideas and setups. Thank you all for your likes, comments and follows, we really appreciate it!
Mr Gold
GoldViewFX

Gold 1H – Is This Pump Temporary or the Start of a Bigger Move?🟡 XAUUSD – Intraday Smart Money Plan | by Ryan_TitanTrader
📈 Market Context
Gold extended its bullish leg overnight, driven by a sharp upside displacement following a clean ChoCH on the H1 structure.
However, the impulsive rally is now pushing deep into premium territory, where higher-timeframe supply begins to re-enter the picture.
Market sentiment remains cautious ahead of U.S. consumer confidence data and upcoming comments from several Fed officials.
• A hawkish tone could strengthen the dollar intraday, making the current rally vulnerable to a pullback.
• A neutral or dovish signal may allow gold to sweep higher liquidity before forming its next decisive move.
Price is currently tapping into resting buy-side liquidity above 4060–4070, with the next pool sitting just beneath the 4090 supply zone, making this an ideal location for short-term reversals.
🔎 Technical Analysis (1H / SMC Style)
• Structure: H1 bias remains bullish after the major ChoCH, but price is now entering an exhaustion phase as it reaches unmitigated supply.
• Premium Zone: 4090–4088 aligns with the freshest H1 supply, formed right before the displacement — a prime location for a short-term reversal.
• Liquidity Sweep: The candles show aggressive wicks into higher liquidity, suggesting the market may engineer one final sweep into 4090 before rotating downward.
• Discount Zone: 3974–3976 lines up with unmitigated demand and sits directly below the previous accumulation range — an ideal discount level for continuation buys if price retraces.
🔴 Sell Setup (High-Probability Reversal)
• Entry: 4090 – 4088
• Stop-Loss: 4100
• Take-Profit Targets: → 4040 (first liquidity pocket) → 4005 (return to structure) → 3976 (discount zone & demand confluence)
🟢 Buy Setup (Demand Reaction Setup)
• Entry: 3974 – 3976
• Stop-Loss: 3967
• Take-Profit Targets: → 4005 → 4040 → 4080
(Only valid if price performs a liquidity sweep into 3976 and prints a clean M15 ChoCH.)
⚠️ Risk Management Notes
• Avoid entering early inside the premium zone — wait for bearish confirmation (M5–M15 BOS).
• The demand at 3974–3976 is strong but only valid once liquidity beneath the range has been fully taken.
• Do not chase buys near current levels; price is overextended and has no discount alignment.
• Partial profits should be secured at each liquidity point, with stops trailed using structural highs/lows.
• Intraday bias remains bullish-to-neutral, but current price is at an extreme, making shorts more favorable short-term.
✅ Summary
Gold is reaching into a major premium zone near 4090, where a short-term reversal becomes highly probable.
The 4090–4088 supply provides a clean, high-quality SMC continuation-short setup, while the 3974–3976 demand zone remains the strongest location for reactive long positions.
Stay patient — today’s movement will likely determine whether the recent pump is temporary or the beginning of a broader structural shift.
FOLLOW RYAN_TITANTRADER for daily SMC setups ⚡

Is Gold Attempting to go back to Previous ATH?Hey Traders, in today's trading session we are monitoring XAUUSD for a buying opportunity around 4,220 zone, Gold is trading in an uptrend and currently is in a correction phase in which it is approaching the trend at 4,220 support and resistance area.
Trade safe, Joe.

Gold 30-Min — Volume Buy Reversal Triggered⚡Base : Hanzo Trading Alpha Algorithm
The algorithm calculates volatility displacement vs liquidity recovery, identifying where probability meets imbalance.
It trades only where precision, volume, and manipulation intersect —only logic.
✈️ Technical Reasons
/ Direction — LONG / Reversal 4113
☄️Bullish momentum confirmed through strong candle body.
☄️Structure shifted with higher-low near key demand base.
☄️Volume expanding confirms order-flow alignment upward.
☄️Buyers reclaimed imbalance with sustained clean break.
☄️Algorithm detects rising momentum under low liquidity.
⚙️ Hanzo Alpha Trading Protocol
The Alpha Candle defines the day’s real control zone — the first battle of momentum.
From this origin, the Volume Window reveals where the next precision strike begins.
⚙️ Hanzo Volume Window / Map
Window tracked from 10:30 — mapping true market behavior.
POC alignment exposes institutional bias and breakout potential zones.
⚙️ Hanzo Delta Window / Pulse
Delta window monitors real buying vs. selling power behind each move.
Tracks volume aggression to expose who controls the candle — buyers or sellers.
When Delta aligns with Volume Map, momentum becomes undeniable.

XAUUSD-GOLD-4H / at a Crossroads: Symmetrical Triangle AnalysisDear Traders,
I’ve prepared a special XAUUSD–gold analysis for you. Gold is currently moving within a symmetrical triangle formation. If gold breaks upward within this triangle and closes a candle, the first target will be the 4160 level. If it breaks downward, the first target will be the 3800 level.
I share these insights because I truly value you. Each follower is precious to me, and together we are like a family here. Every like and show of support motivates me to continue providing these analyses. Thank you sincerely to everyone who stands by me.
With respect and affection.
-TraderTilki

Gold Near Channel Support – Bulls Preparing for Another Leg Up?Gold ( OANDA:XAUUSD ) is approaching the Support zone($4,193 – $4,137) and the lower line of the ascending channel .
In terms of Elliott Wave theory , it looks like Gold is completing the main wave 4 .
I expect Gold increase from the Support zone($4,193 – $4,137) to Potential Reversal Zone(PRZ) and Resistance zone($4,316 – $4,270) .
First Target: $4,253
Second Target: $4,297
Stop Loss(SL): $4,133
Please respect each other's ideas and express them politely if you agree or disagree.
Gold Analyze (XAUUSD), 1-hour time frame.
Be sure to follow the updated ideas.
Do not forget to put a Stop loss for your positions (For every position you want to open).
Please follow your strategy; this is just my idea, and I will gladly see your ideas in this post.
Please do not forget the ✅ ' like ' ✅ button 🙏😊 & Share it with your friends; thanks, and Trade safe.

XAUUSD Retests Resistance — Pullback Toward $4,060 SupportHello traders! Let’s take a look at XAUUSD (Gold). After a prolonged bullish movement within a well-defined ascending channel, price reached a significant Resistance Level near $4,200, where sellers stepped in to regain control. This resistance coincides with the upper boundary of a descending resistance line, confirming its importance as a reaction area. Following this rejection, Gold experienced a sharp correction, forming a Range structure near the top before breaking below it — marking a shift in short-term sentiment. The breakout from this range confirmed the beginning of a downward phase, where price continued to move inside a new descending pattern. Currently, XAUUSD is testing the resistance line once again after a breakout retest from below. This area aligns with a former pivot zone where several reversals occurred in the past. The overall structure suggests that buyers are losing momentum, while sellers are preparing to defend this key zone. As long as price remains below the $4,160–$4,200 resistance, a corrective pullback toward the $4,060 Support Level (TP1) looks likely. This area also aligns with the ascending support line, which may act as the next major decision point. A clean break below $4,060 could extend the decline toward the $3,950–$3,970 zone, while a confirmed breakout above $4,200 would invalidate the short scenario and potentially trigger another bullish continuation phase. Please share this idea with your friends and click Boost 🚀

XAU/USD | Gold Faces Pullback After Breaking $4200, What’s Next?By analyzing the #Gold chart on the 4-hour timeframe, we can see that after breaking above the $4200 resistance, the price continued to rise and reached $4244 before reacting negatively from the OTE zone, correcting down to $4184.
Gold is currently trading around $4195, with an FVG zone between $4141–$4181 that might get filled soon. There’s also a key demand area between $4098–$4125 to watch closely.
If gold manages to hold above $4181 without breaking below, we could see another strong bullish move toward $4269. Monitor price reactions carefully at all mentioned levels!
Please support me with your likes and comments to motivate me to share more analysis with you and share your opinion about the possible trend of this chart with me !
Best Regards , Arman Shaban

XAUUSD: Bounce from Support Zone Targets $4,280 ResistanceHello everyone, here is my breakdown of the current Gold setup.
Market Analysis
Gold (XAUUSD) continues to maintain a bullish market structure after successfully recovering from the Support Zone near $4,090–$4,100, where buyers stepped in to defend a key demand area. Following a fake breakout to the downside in late October, price regained momentum and established a new Upward Channel, characterized by higher highs and higher lows — a strong sign of renewed buying pressure.
Currently, gold has already completed two major breakout phases, first reclaiming the support range and then extending toward the mid-channel zone. The current consolidation suggests a temporary pause before another impulsive leg upward. Price is now trading between the $4,190 support and the $4,350 resistance area, where previous reactions indicate strong liquidity. This resistance has acted as a cap for prior rallies, making it a crucial target zone for bulls. As long as the metal holds above the channel’s lower boundary, the short-term trend remains bullish. A minor pullback toward the support area could serve as a healthy correction before another rally unfolds. However, a confirmed break below $4,190 could temporarily weaken the bullish momentum and lead to a deeper retracement.
My Scenario & Strategy
I expect XAUUSD to maintain its bullish trajectory while respecting the ascending channel structure. Buyers may look for potential long setups near the $4,190–$4,200 support zone, targeting the $4,320–$4,350 resistance area (TP1). A breakout and close above $4,350 would open the path toward $4,400+ levels, confirming further continuation of the bullish cycle.
Conversely, a strong bearish break below the channel and support zone could signal a short-term correction toward $4,100 before buyers attempt to regain control. For now, sentiment remains optimistic, and gold continues to look poised for another bullish leg higher within its well-defined upward channel.
That's the setup I'm tracking. Thank you for your attention, and always manage your risk.

THE KOG REPORT - UpdateEnd of day update from us here at KOG:
We managed to hit the hot spot as intended after which our indicators were suggesting caution on going long and we broke below the bias level completing most of our bearish targets for the day, not bad!
Now, we have support below 4010 which if held should take us up into the 4035 region which is the level that needs to be monitored. Rejection there will again lead to a RIP and we are likely to get a move into the lower levels before we bounce. A frustrating range to say the least, not clean but we'll play it how we see it for now. Hot spot active!
As always, trade safe.
KOG

Gold 30-Min — Volume Buy & Sell Reversals Triggered⚡Base : Hanzo Trading Alpha Algorithm
The algorithm calculates volatility displacement vs liquidity recovery, identifying where probability meets imbalance.
It trades only where precision, volume, and manipulation intersect —only logic.
✈️ Technical Reasons
/ Direction — LONG / Reversal 4110 Area
☄️Bullish momentum confirmed through strong candle body.
☄️Structure shifted with higher-low near key demand base.
☄️Volume expanding confirms order-flow alignment upward.
☄️Buyers reclaimed imbalance with sustained clean break.
☄️Algorithm detects rising momentum under low liquidity.
✈️ Technical Reasons
/ Direction — SHORT / Reversal 4170 Area
☄️Bearish rejection confirmed through sharp candle body.
☄️Lower-high forming beneath resistance supply region.
☄️Volume decreasing confirms exhaustion in price rally.
☄️Sellers regained imbalance with heavy top rejection.
☄️Algorithm detects fading demand and shift to control.
⚙️ Hanzo Alpha Trading Protocol
The Alpha Candle defines the day’s real control zone — the first battle of momentum.
From this origin, the Volume Window reveals where the next precision strike begins.
⚙️ Hanzo Volume Window / Map
Window tracked from 10:30 — mapping true market behavior.
POC alignment exposes institutional bias and breakout potential zones.
⚙️ Hanzo Delta Window / Pulse
Delta window monitors real buying vs. selling power behind each move.
Tracks volume aggression to expose who controls the candle — buyers or sellers.
When Delta aligns with Volume Map, momentum becomes undeniable.

Gold Price Setup: The Pullback Signal Is Getting Stronger!OANDA:XAUUSD is currently trading within a well-defined ascending channel, with price action now testing the upper boundary. This level may act as a dynamic resistance, and a rejection here could trigger a correction toward 4,030.
Such a pullback aligns with expectations for a healthy retracement after a strong rally. I anticipate this move will serve as an important launchpad for buyers, defined by the confluence of horizontal support and the 0.618 Fibonacci retracement of the latest bullish impulse.
This zone will be critical in determining whether the broader bullish structure remains intact. If price holds and shows signs of reversal, it could offer a solid re-entry opportunity for buyers. However, a decisive break below this region would invalidate the current bullish outlook, opening the door for a deeper correction.
Always confirm your setups and manage risk wisely. Stay sharp, and trade smart.

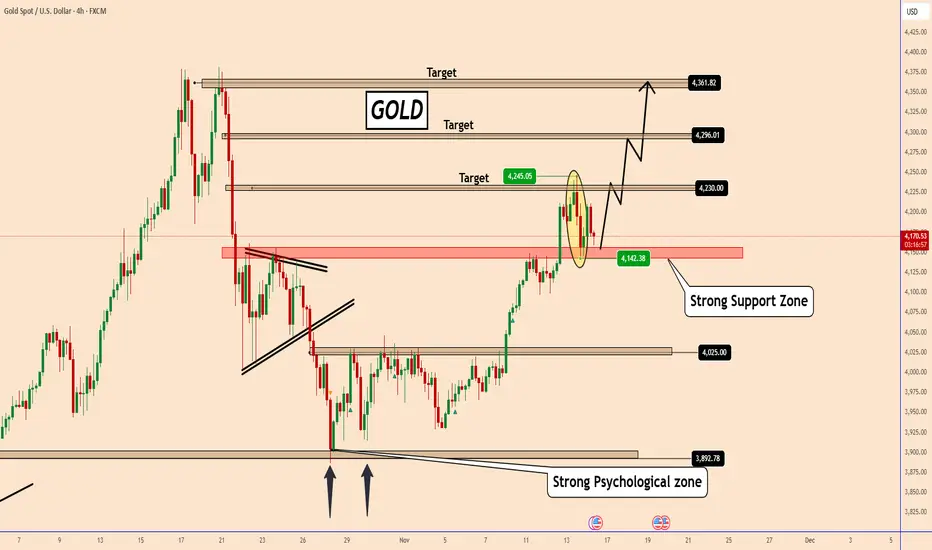
Gold: Bullish Structure Still Intact Despite Price VolatilityGold: Bullish Structure Still Intact Despite Price Volatility
Yesterday, Gold dropped nearly 2.5% in just one hour with no clear fundamental catalyst behind the move. The entire market reacted in an unusual, chaotic way.
Almost every chart showed extreme volatility at the same time.
During the spike, Gold fell from 4245 to 4142, tapping into a major structural support zone visible on the left side of the chart. So far, that area is holding, and if the market avoids another abnormal volatility event today, Gold may attempt to resume its broader bullish trend.
Interestingly, Gold had been climbing since Monday on expectations that the U.S. government would reopen. But the moment it actually did, Gold sharply reversed — a reaction that makes little sense from a fundamental perspective.
If the support zone continues to hold and normal price behavior returns, the bullish scenario remains valid.
Key Targets:
🎯 4230
🎯 4296
🎯 4360 (maximum extension)
You may find more details in the chart!
Thank you and Good Luck!
❤️PS: Please support with a like or comment if you find this analysis useful for your trading day❤️
GOLD 4H CHART ROUTE MAP UPDATE & TRADING PLAN FOR THE WEEKHey Everyone,
Please see our updated 4h chart levels and targets for the coming week.
We are seeing price play between two weighted levels with a gap above at 4042 and a gap below at 3964. We will need to see ema5 cross and lock on either weighted level to determine the next range.
We will see levels tested side by side until one of the weighted levels break and lock to confirm direction for the next range.
We will keep the above in mind when taking buys from dips. Our updated levels and weighted levels will allow us to track the movement down and then catch bounces up.
We will continue to buy dips using our support levels taking 20 to 40 pips. As stated before each of our level structures give 20 to 40 pip bounces, which is enough for a nice entry and exit. If you back test the levels we shared every week for the past 24 months, you can see how effectively they were used to trade with or against short/mid term swings and trends.
The swing range give bigger bounces then our weighted levels that's the difference between weighted levels and swing ranges.
BULLISH TARGET
4042
EMA5 CROSS AND LOCK ABOVE 4042 WILL OPEN THE FOLLOWING BULLISH TARGETS
4147
EMA5 CROSS AND LOCK ABOVE 4147 WILL OPEN THE FOLLOWING BULLISH TARGET
4264
EMA5 CROSS AND LOCK ABOVE 4264 WILL OPEN THE FOLLOWING BULLISH TARGET
4340
EMA5 CROSS AND LOCK ABOVE 4340 WILL OPEN THE FOLLOWING BULLISH TARGET
4422
EMA5 CROSS AND LOCK ABOVE 4422 WILL OPEN THE FOLLOWING BULLISH TARGET
4494
BEARISH TARGETS
3964
EMA5 CROSS AND LOCK BELOW 3964 WILL OPEN THE FOLLOWING BEARISH TARGET
3873
EMA5 CROSS AND LOCK BELOW 3873 WILL OPEN THE SWING RANGE
3741
3632
As always, we will keep you all updated with regular updates throughout the week and how we manage the active ideas and setups. Thank you all for your likes, comments and follows, we really appreciate it!
Mr Gold
GoldViewFX

Gold 30-Min — Volume Buy & Sell Reversals Triggered⚡Base : Hanzo Trading Alpha Algorithm
The algorithm calculates volatility displacement vs liquidity recovery, identifying where probability meets imbalance.
It trades only where precision, volume, and manipulation intersect —only logic.
✈️ Technical Reasons
/ Direction — LONG / Reversal 4004
☄️Bullish momentum confirmed through strong candle body.
☄️Structure shifted with higher-low near key demand base.
☄️Volume expanding confirms order-flow alignment upward.
☄️Buyers reclaimed imbalance with sustained clean break.
☄️Algorithm detects rising momentum under low liquidity.
✈️ Technical Reasons
/ Direction — SHORT / Reversal 4093
☄️Bearish rejection confirmed through sharp candle body.
☄️Lower-high forming beneath resistance supply region.
☄️Volume decreasing confirms exhaustion in price rally.
☄️Sellers regained imbalance with heavy top rejection.
☄️Algorithm detects fading demand and shift to control.
⚙️ Hanzo Alpha Trading Protocol
The Alpha Candle defines the day’s real control zone — the first battle of momentum.
From this origin, the Volume Window reveals where the next precision strike begins.
⚙️ Hanzo Volume Window / Map
Window tracked from 10:30 — mapping true market behavior.
POC alignment exposes institutional bias and breakout potential zones.
⚙️ Hanzo Delta Window / Pulse
Delta window monitors real buying vs. selling power behind each move.
Tracks volume aggression to expose who controls the candle — buyers or sellers.
When Delta aligns with Volume Map, momentum becomes undeniable.

GOLD 1H CHART ROUTE MAP UPDATE & TRADING PLAN FOR THE WEEKHey Everyone,
Please see our updated 1h chart levels and targets for the coming week.
We are seeing price play between two weighted levels with a gap above at 4114 and a gap below at 4057. We will need to see ema5 cross and lock on either weighted level to determine the next range.
We will see levels tested side by side until one of the weighted levels break and lock to confirm direction for the next range.
We will keep the above in mind when taking buys from dips. Our updated levels and weighted levels will allow us to track the movement down and then catch bounces up.
We will continue to buy dips using our support levels taking 20 to 40 pips. As stated before each of our level structures give 20 to 40 pip bounces, which is enough for a nice entry and exit. If you back test the levels we shared every week for the past 24 months, you can see how effectively they were used to trade with or against short/mid term swings and trends.
The swing range give bigger bounces then our weighted levels that's the difference between weighted levels and swing ranges.
BULLISH TARGET
4114
EMA5 CROSS AND LOCK ABOVE 4114 WILL OPEN THE FOLLOWING BULLISH TARGETS
4175
EMA5 CROSS AND LOCK ABOVE 4175 WILL OPEN THE FOLLOWING BULLISH TARGET
4232
EMA5 CROSS AND LOCK ABOVE 4232 WILL OPEN THE FOLLOWING BULLISH TARGET
4289
EMA5 CROSS AND LOCK ABOVE 4289 WILL OPEN THE FOLLOWING BULLISH TARGET
4361
BEARISH TARGETS
4057
EMA5 CROSS AND LOCK BELOW 4057 WILL OPEN THE FOLLOWING BEARISH TARGET
4006
EMA5 CROSS AND LOCK BELOW 4006 WILL OPEN THE FOLLOWING BEARISH TARGET
3965
EMA5 CROSS AND LOCK BELOW 3965 WILL OPEN THE SWING RANGE
3923
3861
As always, we will keep you all updated with regular updates throughout the week and how we manage the active ideas and setups. Thank you all for your likes, comments and follows, we really appreciate it!
Mr Gold
GoldViewFX

XAUUSD: Bulls Are Ready to Break Out!Gold is showing a powerful comeback as both fundamentals and price action are shifting in favor of the bulls. Global investors are betting that the reopening of the U.S. government and the full release of economic data will pave the way for the Fed to cut interest rates next month. In an environment of economic uncertainty and rising expectations of monetary easing, gold naturally becomes a highly attractive safe haven.
On the chart, the uptrend remains clear as XAUUSD continues to trade steadily within its ascending channel. Recent pullbacks have been purely technical, not signs of a reversal. The nearby support around 4,090 is acting as a crucial launching zone. As long as price stays above this area, the bulls remain firmly in control.
In the short term, the next key target is 4,240, where the market will likely test the true strength of bullish momentum before deciding the next leg.
If you're waiting for a clear trend signal, gold is showing exactly that: the bullish pressure hasn’t stopped—every dip is simply creating another opportunity for buyers to step in.

Gold - This bullrun is now over!🚨Gold ( TVC:GOLD ) won't create new highs:
🔎Analysis summary:
All the way back in 2019, Gold confirmed its rounding bottom formation. This breakout was then followed by a major rally of about +200% over the past couple of years. But at this moment, Gold is retesting a major resistance trendline and will therefore end its bullrun.
📝Levels to watch:
$4,200
SwingTraderPhil
SwingTrading.Simplified. | Investing.Simplified. | #LONGTERMVISION

GOLD WEEKLY CHART MID/LONG TERM ROUTE MAPHey everyone,
Please see our weekly chart timeframe Routemap and Trading plans for the week ahead.
After securing 4059 last week, we now have a long range candle body close gap above at 4294, with 4059 acting as support. We can expect price action to play between these two levels. A further EMA5 cross and lock above 4059 will strengthen the gap toward 4294. Conversely, a candle body close back below 4059 would reopen the broader retracement range.
We’ll keep these long timeframe structures in mind as we continue with our plan to buy dips.
We will keep you all updated as this chart idea unfolds.
Mr Gold
