Gold still sitting in the roller coaster!In our previous analysis of WXY pattern, it would make wave-Y so much bigger than wave-W that it went against the guideline of the Right-Look. So here we have a better labelling. Note that Wave-Equality among W and Y stands at $3761.
Trade ideas

Gold heading towards my Targets / #5,100.80 mark aheadTechnical analysis: As I announced that correction is over on Gold (Fed or not), Price-action has recovered half of the post Fed losses on the E.U. session opening as DX was taking big Daily candle hit. However the rise is still not proportional as DX and global futures are still on Higher levels. This leads me to believe that on the Short-term, there is a stronger connection of Gold to DX, rather than Bond Yields, so I will keep an eye for pressure zones on DX as I did for past few fractals. Technically the Hourly 4 chart was isolated within invalidated / former Descending Channel on it’s Higher Low’s, as Resistance currently has to give away since last couple occasions it provided rejection twice (#4,027.80). I am expecting strong Bullish move to take place throughout next week. Despite the Bearish Fundamental outcome on announcements this week (Fed Rate cut was Bullish however hawkish stance from Powell had much more after-effect on Gold), Gold continues to Trade near the #2-Week High’s. This indicates that this and last week's aggressive Buy-off on DX was largely a pre-pricing of those Fed Rate numbers. What's obvious, as the current week is coming to a close, is that the consolidation since yesterday’s session is just above the Daily chart’s Support Zone (#3,975.80 - #3,988.80) which lifts the probabilities for an aggressive Buying sequence ahead, especially all lesser charts turning Bullish now. Interestingly, the Weekly candle percentage will be flat almost on zero percent if Gold continues to soar. I remain fully Bullish on the Short and Medium-term, in addition my Technicals are showcasing Bullish signs as I expect Gold to continue rising (Buying every dip) on Buying pressure from DX on expected spiral downtrend, Bond Yields as well struggling to make Bullish comeback).
My position: I have been monitoring Gold from sidelines as mentioned throughout yesterday's session Highly satisfied with my Profit, as I spotted that #3,988.80 is showcasing strong durability, I have started Buying Gold with aggressive Scalps from #3,988.80 - #3,992.80 many times with at least #15ish orders delivering excellent Profits. I do believe Gold will continue soaring as long as Support zone is intact with #4,052.80 mark as my next Short-term Target.

CONFIRMATION CANDLE Bullish confirmation candle , more buys expected, and it will definitely buy more especially if h1 also closes bullish by 5am

Oct 31, 2025 - XAUUSD GOLD Analysis and Potential Opportunity📊 Analysis:
On the higher timeframes, bearish momentum is weakening while bullish strength is starting to emerge.
If price breaks above 4047, watch the 4050 resistance closely — once price holds above 4050, bullish momentum should become clear, and the plan shifts to buying pullbacks into support.
If price falls below 4016, bullish strength weakens, and the strategy turns to selling rallies into resistance.
Also, keep an eye on 3960 — a break below this level would signal renewed bearish pressure.
🔍 Key Levels to Watch:
• 4085 – Resistance
• 4073 – Resistance
• 4065 – Resistance
• 4043–4050 – Resistance zone
• 4024 – Support
• 4000 – Psychological level
• 3987 – Support
• 3978 – Support
• 3960 – Key intraday support
📈 Intraday Strategy:
SELL: If price breaks below 4016 → target 4011, with further downside toward 4008, 4001, 3995
BUY: If price holds above 4040 → target 4043, with further upside toward 4046, 4050, 4055

GOLD Buy and Sell Zones for the next few weeksLong term bullish gold, short term bearish.
If we break the sell zone then we might see a new bullish momentum short term.

Markets Dynamics Every Pro Trader Should KnowMarkets move based on fundamental forces that shape pro traders behavior, capital flows, and asset valuations. I will cover the most important concepts that drive market behavior across all asset classes and are fundamental to professional traders.
RISK-ON / RISK-OFF DYNAMICS
The most important concept is the oscillation between risk-on and risk-off sentiment—investor willingness to take on risk in pursuit of returns.
Risk-On: Equities, commodities, high-yield bonds, and risk-sensitive currencies like AUD, NZD rise.
Typical triggers are: positive economic data, easy central bank policies, geopolitical stability.
Risk-Off: Safe-haven assets : USD, JPY, CHF, U.S. Treasuries, gold strengthen. This happens as money managers and investors prioritize capital preservation.
Typical triggers: negative economic data, geopolitical tensions, financial crises.
Why USD strengthens during risk-off:
USD has a global reserve currency status, and that structurally creates demand; deepest treasury market for holding capital; trillions in global debt denominated in USD.
Why JPY strengthens during risk-off:
Carry trade unwinding (investors close positions by buying back yen); Japanese institutions bring back home trillions in foreign assets during crises.
INTEREST RATE DIFFERENTIALS
Capital moves toward countries offering higher real interest rates (real rates = nominal rates minus inflation). This creates currency trends over weeks, months, and years.
Higher interest rates leads to higher bond yields, increasing capital inflows, resulting in currency appreciates
The Carry Trade: Borrow in low-yield currencies (JPY, CHF), invest in high-yield currencies (AUD, NZD), profit from interest rate differential. Carry trades unwind strongly during risk-off times due to leverage and crowded positioning.
INFLATION EXPECTATIONS
Markets trade based on where they expect inflation to be in the future, not current readings. Rising inflation expectations means central banks are likely to tighten policy, hence Bond yields rise and that may lead to currency strengthening initially.
Key metrics: CPI (Consumer Price Index), PCE, core vs. headline inflation, break-even inflation from TIPS spreads.
MONETARY POLICY CYCLES
Central banks are the most powerful players in financial markets. They control interest rates and balance sheet operations.
Tightening Cycle (hiking rates, quantitative tightening): Strengthens currency, negative for equities, bond prices fall, slows economic activity.
Easing Cycle (cutting rates, QE): Weakens currency, positive for equities, bond prices rise, stimulates economic activity.
GLOBAL GROWTH AND COMMODITY CYCLES
Strong global growth means higher demand for energy/metals = Commodity prices rise = Strengthens commodity currencies (AUD, CAD, NOK, BRL).
Key indicators to watch: Global PMIs, global trade data, commodity indices, China growth indicators.
TERMS OF TRADE
When a country's export prices rise more than its import prices, local income increases and currency typically strengthens. Example: Australia's AUD strengthens when iron ore and coal prices rise.
BALANCE OF PAYMENTS
Current account measures trade balance, income flows, and transfers.
Surplus (exports > imports): This accumulates foreign reserves, and generally supports currency.
Deficit (imports > exports): This requires capital inflows to fund deficit, and can pressure currency lower.
FISCAL POLICY AND DEBT DYNAMICS
Government spending and taxation are another dynamic that can influence economic growth and inflation.
Expansionary Policy: Higher spending or lower taxes = short-term growth boost = can increase inflation = increases deficit.
Contractionary Policy: Lower spending or higher taxes (this is know as “austerity”) = slows growth =reduces inflation = improves budget balance.
YIELD CURVE
One of the most important dynamics: it plots interest rates of government bonds across different maturities (2-year, 10-year, 30-year).
Normal/Steep Curve: Growth and inflation optimism, typically supports risk-on sentiment.
Flat Curve: Uncertainty about future growth, usually in late-cycle economies.
Inverted Curve (short rates > long rates): Recession warning. markets expect the central bank to cut rates due to the slowing economy. The inverted curve has preceded almost every U.S. recession in the past half decade.
LIQUIDITY CONDITIONS
Liquidity means availability of credit in the financial system.
High Liquidity: Credit is easy and cheap, supports asset prices, enhances risk appetite. Sources of ample liquidity are central bank QE, low interest rates.
Tight liquidity: Credit becomes scarce and expensive, forces deleveraging, triggers risk-off sentiment. Reasons that can lead to low liquidity are central bank QT, rising rates, banking stress.
BEHAVIORAL & POSITIONING DYNAMICS
When too many investors are positioned the same way (crowded trade), small sentiment changes can trigger strong reversals. Extreme bullishness can signal sell opportunities when everyone is fully invested. Extreme bearishness can signal buy opportunities when selling pressure is exhausted.
Key indicators to measure market positioning are: CFTC positioning data, VIX (volatility index), put/call ratios, fund flow data.
REAL YIELDS
Real Yield = Nominal Yield - Expected Inflation
Rising Real Yields: Stronger currency (attracts foreign capital), weaker gold (higher opportunity cost), pressure on growth stocks.
Falling Real Yields: Weaker currency, stronger gold, support for growth/tech equities.
Real yields drive cross-asset flows through opportunity cost (risk-free alternative return), discount rate changes (affects stock valuations), and dollar funding (global capital flows).
BOTTOM-LINE AND DYNAMICS INTERACTIONS
Markets are driven by multiple forces simultaneously. The strongest moves occur when multiple dynamics align in the same direction. Identify the dominant theme (inflation? growth? central bank policy?), understand asset class implications, look for alignment, and monitor for shifts.
Example Scenario - Fed Aggressive Tightening: Fed raises rates and begins QT → U.S. yields rise → Rising real yields → Tighter liquidity → Risk-off sentiment → USD strengthens, AUD/NZD/EM weaken, gold falls, growth stocks underperform.
Success comes from identifying the dominant market theme, understanding implications across asset classes, looking for alignment when multiple dynamics point in the same direction, and monitoring for theme shifts that can reverse the entire market structure quickly.
If you have questions or need any explanation don't hesitate to drop a comment.
Today's gold trading strategyPolicy Shift Foundation: Transition from "Passive Defense" to "Proactive Easing"
1.Reinterpretation of the Nature of Rate Cuts: Defining this rate cut as a "defensive operation", its essence is Powell's rhetoric strategy to balance the hawkish and dovish differences. The U.S. non-farm payrolls increased by only 120,000 and 105,000 in August and September respectively, continuously below the "employment stability threshold" of 150,000. The unemployment rate has risen from 3.8% to 4.2%, and the inflection point of the employment market is clear. Under such circumstances, this rate cut is by no means a "one-off hedge", but rather a confirmation of the downward pressure on the economy. Historical data shows that after the first "defensive rate cut", the probability of subsequent rate cuts by the Federal Reserve within three months is 82%, and the average increase in gold is over 6%.
2.Substantial Weakening of Inflation Constraints: Although Powell mentioned inflation risks, the core PCE has been below 3% for three consecutive months, and was recorded at 2.7% in September, just one step away from the 2% target. More importantly, the year-on-year service inflation has dropped from 4.5% to 3.8%, indicating that inflation stickiness is dissipating. This opens up space for subsequent easing - when the dual goals of inflation and employment form a "loose resonance", the interest rate sensitive rise in gold will be triggered.
Today's gold trading strategy
buy:3910-3920
tp:3940-3950
sl:3895

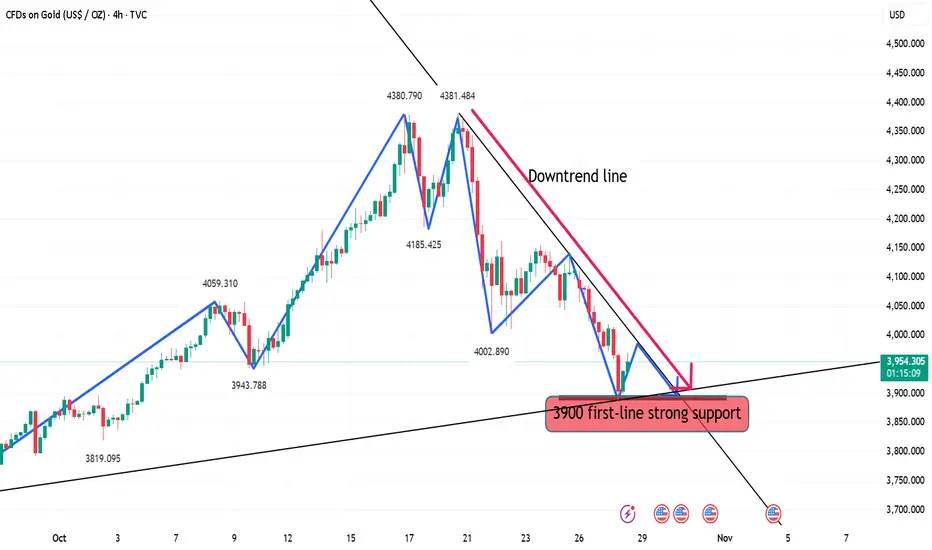
GOLD ; How far down?Hello friends
Well, after the good rise we had, the price needed a correction, which happened with a double top pattern.
Now the main question is, how far will the fall go?
Well, in the short term, the price can fall to the specified limits, and if the support areas are broken, the fall will continue, and on the other hand, an important resistance has been created, which the price needs to break for the new ATH.
With this decline, it is unlikely that the price will suffer for a while and correct because it has grown a lot and everything will end one day...
Support levels can be good points for buying, of course with capital and risk management.
*Trade safely with us*

GOLD (XAUUSD) is ready to drop again! Gold has broken below a very strong support trendline which held the price for many weeks. It then also tried to test a powerful resistance level (the red trendline) but it failed to break through. It is now very likely to head all the way down to the next major support zone (which is the while line drawn below)

Gold on side Swings on Fed aftermathAs discussed throughout yesterday's session: 'My position: I am Buying Gold aggressively throughout yesterday's session all along especially when #3,952.80 benchmark got invalidated to the upside. Gap to the downside on Asian market opening delivered excellent chances to Buy more as I closed all orders with #4,000.80 Take Profit. Keep in mind that I might Sell #4,024.80 now (aggressive Scalp to the downside) only to Buy more. #4,052.80 benchmark and #4,100.80 extension are my Targets.'
If you followed Trading plan I announced above, you would be in excellent Intra-day Profits. I have Sold Gold from #4,027.80 High's multiple times and re-Bought Gold from #4,004.80 especially delivering excellent results and altered all my Trading activity (no need to gamble on Fed Rate decision aftermath). My Profit is excellent and will sit out today's session as it will be full of side-Swings where I will continue comfortable Trading throughout tomorrow's session.

This is just a rebound, not a reversal. Continue to short gold.The Fed's interest rate decision is highly anticipated, and the question remains whether gold bulls can stage a comeback. Gold is currently in a rebound and correction phase after an oversold condition. It's premature to declare a complete reversal of the bullish trend. Gold's rebound from its lows suggests a period of consolidation in the short term, awaiting the Fed's decision to determine its direction.
The 1-hour moving averages for gold continue their downward crossover, indicating that the bullish momentum hasn't fully materialized. However, there is gradually building support at lower levels. If a strong upward surge occurs before the Fed's decision, the bullish momentum may wane afterward. A break above 4020 would confirm a true V-shaped reversal for gold. Failure to break through 4020 suggests continued range-bound trading, with support around 3890. A hold above 3890 would likely lead to a rebound.
With the Fed's interest rate decision looming, let's wait patiently. Whether gold has finished its correction and whether the bulls have begun their counterattack remains to be seen. We'll observe the strength of the bulls after the Fed's decision. If gold breaks through and holds above 4020, the short-term upward momentum will increase.
Trading Strategy: Sell gold at 4010-4020, with a target of 3950-3930.

AT ENTRY Price is at our sell entry, let see how it goes because if it fails then we will likely see more buys during FOMC, but I strongly believe it will sell

Gold Rebounds Strong – Next Stop 4230!Gold (XAUUSD) showed a sharp decline in last two days, marking a strong correction phase after making new highs. However, today’s price action indicates that buyers are stepping back in around the 4000 psychological Major support Area.
Currently, gold is trading near 4113, and now there are high possibilities that gold will go for long till the Target level 4160 and Target level 4230..
KEY POINTS
Current price 4113
Target level 4160
Target level 4230
Major support 4130/4100

Gold Consolidates Weakly Around $3925 – Sellers Still in Control📊 1. Market Overview
Gold prices rebounded slightly from the $3900 level, reaching $3931 before losing momentum. The market is now moving sideways around $3925 in a weak consolidation phase. The U.S. dollar remains firm as Treasury yields stay elevated, while traders await the upcoming PCE inflation data, limiting gold’s recovery potential.
🔍 2. Technical Analysis
• Main Trend: Bearish, with weak corrective rebounds.
• Immediate Resistance: $3930 – $3935
• Higher Resistance: $3948 – $3960
• Near-term Support: $3900 – $3890
• EMA50 & EMA200 (H1): EMA50 remains below EMA200, confirming the ongoing bearish bias.
• Candlestick Pattern: Small lower-tail candles around 3925 indicate mild buying but no clear reversal signal.
• RSI (H1): 45 – neutral, suggesting potential range-bound movement before breaking above 3930 or below 3900.
💡 3. Outlook
Gold is currently in a short-term accumulation phase after a steep drop, but the broader trend remains bearish. A rejection from the $3930–$3935 resistance zone could trigger another decline toward $3900 or even $3880. Conversely, a decisive breakout above $3935 with strong volume may extend the rebound toward $3960.
🎯 4. Trading Strategy
🔻 SELL XAU/USD: $3928 – $3932
🎯 TP: 40 / 80 / 200 pips
🛑 SL: $3938

‘10.29 Buy first below 3900 and then sell!Technical Analysis:
The first resistance area above is 3960-70. Maintain a short position below this level. If the market unexpectedly breaks higher, focus on the 3995-4005 area, which remains bearish. If the market weakens, the 3945-50 area, previously the starting point for the rally, has become a source of pressure after breaking below it today.
Key support areas below are the 20-day moving average (SMA) at 3865-70 and the 50% level at 3840-45.
Trading strategy: Maintain a short position on rebounds.
Participate in the 3960-70 area, targeting a new low. After a new low, consider entering long positions based on the 20-day moving average and the 50% level.
28/10/68 : XAUUSD ( US Session )Using it from US Session until 11.00AM , I'll new analysis and update at 12.00PM
Resistance
3947-3953
3936-3942
3930
Support
3918
3907-3912
3896-3901

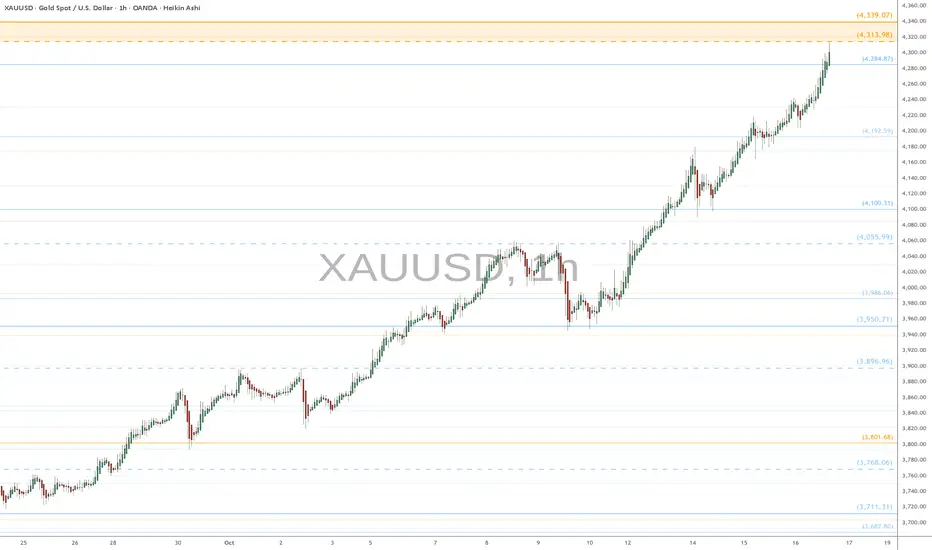
XAU.usd watch $4313-39: Gold about to hit Double Golden fibsGold continues its relentless climb into new highs.
Nearing Double Golden fibs at $4313.98 - 4339.07
Looking for a Dip-to-Fib or Break-n-Retest entries.
IF there is a top anywhere near here,
then THIS will be the ideal spot for it.
.
See "Related Pubications" for previous plots such as this PERFECT DIP:
Hit BOOST and FOLLOW for more such PRECISE and TIMELY charts.
=========================================================
.
Gold Market Analysis and Trading Strategy:Gold Market Analysis and Trading Strategy:
Technical Analysis: Gold is currently facing short-term pressure, and key price levels need to be monitored. Gold prices are currently in a consolidation phase.
Resistance Levels: $4030-$4050 and $4088 are key short-term resistance levels.
If gold prices fail to break through these resistance levels, the downside risk is significant.
Support Levels: Initial support is around $3960, with a more significant support zone in the $3800-$3700 area.
A break below these key support levels could trigger a deeper trend correction.
Trading Strategy: In the current volatile market, patience is advised. Avoid blindly chasing highs and lows.
Day Traders: Consider establishing a small short position near the $4030-$4050 resistance zone, with a stop-loss above $4070 and a target price of $3980-$3960.
Conversely, if gold prices fall back and stabilize around $3960-$3970, a small position can be established to profit from the rebound, but a strict stop-loss order must be set.
Current Trading Strategy:
Buy Price: $3970-$3980
Stop-Loss Price: $3950
Take-Profit Price: $4030-$4050-$4075


Gold Accumulates on Support, 3,952 USD is the Gateway for a New🔍 Market Context
Gold is oscillating within a symmetrical triangle pattern , reflecting price compression and waiting for a breakout signal.
Buyers still maintain a short-term bullish structure, but the series of lower highs indicates increasing selling pressure.
The 3,959–3,964 USD zone is currently the “balance point” — if this area is breached, the downtrend could extend to the lower liquidity zone around 3,929–3,921 USD .
💎 Key Technical Zones
• Resistance Zone: 4,020 – 4,040 USD → the main resistance area of the triangle, where strong reactions are likely.
• Support Zone: 3,959 – 3,964 USD → the support area maintaining the bullish structure.
• Liquidity Zone: 3,929 – 3,921 USD → low liquidity area, potential to attract price stop sweeps before reversing.
🎯 Trading Scenarios
1️⃣ BUY Setup – Prioritize when price holds above support
• Entry: 3,959 – 3,964 USD
• Stop Loss: 3,940 USD
• Take Profit:
– TP1: 3,985
– TP2: 4,020
– TP3: 4,040
– TP4: 4,096
✳️ “Buy the discount” – Buy at the trendline convergence support area when confirmation signals appear (rejection or bullish ChoCH).
2️⃣ SELL Setup – Scenario if support breaks
• Entry: 3,950 – 3,955 USD (after candle closes below support zone)
• Stop Loss: 3,970 USD
• Take Profit:
– TP1: 3,935
– TP2: 3,925
– TP3: 3,912
✳️ “Sell the breakdown” – Sell when support is clearly breached, targeting the lowest liquidity zone (3,921 USD).
💬 Summary
Gold is in a phase of accumulation before major volatility .
If it holds above the 3,952 USD zone → prioritize BUY following the bullish structure .
If it breaks below 3,952 USD → SELL following the breakout towards the Liquidity Zone.
The scenario will be clearly confirmed when the current symmetrical triangle is broken.
💡 Today's Tagline:
“Liquidity defines direction — follow where the money hides.”
⏰ Timeframe: 1H
📅 Updated: 11/04/2025
✍️ Analysis by: Captain Vincent

Gold price analysis April 11XAUUSD — Gold retains bullish structure within the price channel
Gold is currently moving in the lower half of the rising price channel, showing that buying power is quietly accumulating. The main trendline continues to play an important support role, maintaining the current uptrend.
The key level 4033 is still an important confirmation level for buyers — when the price closes stably above, the uptrend can be more clearly consolidated.
Trading strategy in this period still prioritizes BUY:
BUY around the trendline: around 3980
BUY when the price breaks through the resistance of 4033 (confirms breakout)
🎯 Target: 4100
⚠️ Risk: If the trendline is broken, the scenario of a deep drop to the support zone of 3800 needs to be considered.
Overall, the price structure is still inclined to the uptrend, only when the price channel is completely broken will the trend reverse.

XAUUSD- 4 November 2025
I think gold will go sideways today..
With slowing momentum and mixed fundamentals, gold will likely stay range-bound between USD 3,900–4,000 (support) and USD 4,050–4,100 (resistance).
→ Best approach: wait for breakout; otherwise, scalp near the range edges with tight stops.

XAU/USD BULLISH CONTINUATION SETUPAnalysis:
On the XAU/USD (Gold vs USD) chart, price action shows a strong bullish structure forming after multiple Change of Character (CHoCH) and Break of Structure (BOS) confirmations. The market recently created an equal low (EQL) around the 3990–3995 zone, indicating potential liquidity build-up below.
Price has since rebounded from this demand area and is currently trading near the entry zone (around 4007–4008), suggesting a possible bullish continuation if structure holds.
Key observations:
Demand Zone: 3990–3995 region — a high-probability area where buyers previously stepped in.
Entry Level: Around 4007 — ideal for a long setup upon bullish confirmation.
Target Zone: 4060–4066 — aligning with the previous weekly high, acting as a strong liquidity target.
Stop Loss (Implied): Below 3988 zone, under equal lows for risk management.
Bias:
Bullish — as long as price holds above 3990 and maintains structure, the next push toward 4060–4066 remains likely.
