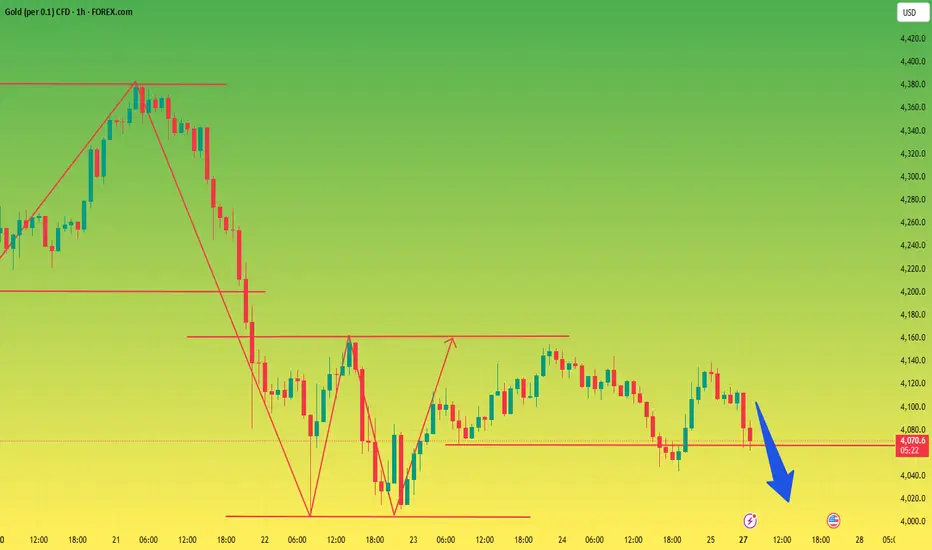
GOLD → Fundamental background boosts interest FX:XAUUSD is recovering after a correction, trading in the range of 4060-4120 amid geopolitical tensions and risks of an escalating trade war.
Key supporting factors: New threats from the US against China, which is responding with additional measures. Trump imposed sanctions against Russian oil companies, accusing Moscow of lack of progress on Ukraine. US inflation data (CPI) on Friday may cause volatility, although the Fed's rate cut next week is likely already priced in.
The meeting between Trump and Xi Jinping next week remains uncertain.
Gold remains a safe haven, but near-term dynamics depend on the balance between dollar strength and geopolitical risks.
Resistance levels: 4116, 4163, 4200
Support levels: 4082, 4060, 4002
A retest of support at 4082-4060, as well as a breakout of resistance at 4116, could trigger a bullish reaction—a rise to the resistance level or imbalance zones. Against the backdrop of the escalating trade war, gold is becoming attractive again.
Best regards, R. Linda!
Trade ideas

StevenTrading – XAUUSD: Mid-Term Buy Bias StrategyStevenTrading – XAUUSD: Mid-Term Buy Bias Strategy | Anticipating Wave 5 and Trendline Retest at $3935
Hello everyone,
StevenTrading is back with a detailed analysis on Gold (XAUUSD).
Gold is currently consolidating above the $3,950 level, awaiting fresh momentum from the upcoming FOMC interest rate decision.
Structurally, the metal appears to be following the Elliott Wave 5-leg formation at this stage. The mid-term bias remains bullish, with a focus on entering around the trendline retest zone.
📰 1. MACRO CONTEXT & FUNDAMENTAL OVERVIEW
The Gold market remains largely driven by anticipation:
Current Status:
Gold is trading sideways above $3,950 as traders await clearer guidance on the Fed’s path towards potential rate cuts.
Psychological Barrier:
A decisive break above the $4,000 psychological threshold is required to confirm a sustainable bullish continuation.
This outcome will depend entirely on the tone and decision from the FOMC meeting.
📊 2. TECHNICAL ANALYSIS – ELLIOTT WAVE SCENARIO
Based on the H1 timeframe (see chart reference image_fa2a75.png):
Wave Structure:
Gold appears to be consolidating after completing Waves 3 and 4. The next move could see the formation of Wave 5, potentially completing the current cycle or confirming a new uptrend.
Ideal Buy Zone (High-Probability Area):
The $3,935–3,937 range represents a key confluence area. It aligns with the trendline retest zone and provides solid structural support for initiating long positions.
Short-Term Sell Zone:
The nearest resistance lies at $4,058–4,060, where short-term scalping or hedge positions could be considered.
🎯 3. TRADING PLAN (ACTION STRATEGY)
The primary focus remains on the Buy Continuation setup, aligned with the medium-term bullish correction.
🟢 Primary BUY Scenario
Entry Zone: $3,935 – $3,937
Stop Loss: $3,929 (tight SL recommended)
Take Profit:
TP1: $3,955 | TP2: $3,978 | TP3: $3,995 | TP4: $4,022 | TP5: $4,055
🔴 SELL Scalping / Hedge Scenario
Entry Zone: $4,058 – $4,060
Stop Loss: $4,066
Take Profit:
TP1: $4,045 | TP2: $4,022 | TP3: $4,005 | TP4: $3,968
🧠 4. SUMMARY & DISCIPLINE (Steven’s Note)
Gold stands at a critical juncture ahead of the FOMC announcement.
The buy-side scenario remains dominant, but maintaining discipline and risk control is essential.

GOLD RETRACE + CONTINUATIONAfter 60D 32% run for all time highs, price changed character on D/4H strucutre, but Weekly has still valid Bullish Strucutre. After strong push to 32%, I assume, that price will pullback to PDA or consolidate towards PDA.
Confluences:
Gold is safe heaven and Ukraine war and another fundamental factors are with us...
US lockdown fears people and disbelieve for currency rises.
Latest COT data are bullish.
There are Daily and Weekly demands where price can retrace to.
If you want, let's talk about it

XAUUSD Delivered Excellent profits [ 1500 pips in single Day ]
Today I gave 2 Buy setups on mine in Early EU session and 2nd on N.y session.
As I mentioned in today’s commentary session:
• I took buy trades around 3930 & 3940 area
My Tp was 3990 & 4010 , Both Targets went successfull.
Secondly I gave another setup As always ,My strategy was to buy the dips, I took buy trades from 3967-3972 area and hold it 4010 - 4020.
I’m very happy with the profits so far – .
My medium-term target 4120 is achieved, Alhamdulillah. And I'm looking for new setup now towards ATH.
Thanks to those who followed, trusted me, and made profits.

GOLD london update what am seeing from the current London market is a supply roof in the zone of 4022-4025-4030
the next supply will be 4045-4055-4058...
the trade reason for the key supply
(1) they are all break and retest level on 2hr time frame.
they will come with gain or loss depending on your risk appetite and management.

Latest Gold Trend Analysis and Trading Strategy :
I. Fundamental and News Analysis
This week is a "super week" for the gold market, with multiple risk events overlapping, expected to trigger significant market volatility:
Political and Economic Events:
The 2025 APEC Leaders' Informal Meeting is being held, and U.S. President Trump has begun his Asia tour, drawing attention to geopolitical dynamics.
The fifth round of Sino-U.S. trade consultations has made progress, with the U.S. explicitly stating it will "no longer consider" imposing 100% tariffs on China. The easing of trade tensions has weakened gold's safe-haven demand.
Central Bank and Data Focus:
The Federal Reserve, Bank of Japan, European Central Bank, and other central banks will announce interest rate decisions, with the market closely monitoring signals on monetary policy.
The U.S. will release the September Core PCE Price Index (a key inflation indicator for the Fed) and the Q3 GDP data, which will directly impact interest rate expectations.
II. In-Depth Technical Analysis
Overall Trend Positioning:
Gold is currently in a wide-range consolidation phase and has not yet formed a unilateral trend.
Last Friday's CPI data, which was bullish, failed to push gold prices higher, indicating weak bullish momentum. The adjustment period may extend until the Fed's interest rate decision (early Thursday morning).
Key Levels and Patterns:
Resistance Zone: 4020–4050 (short-term)
If the rebound breaks above 4050 and fills the 4100 gap, the short-term trend will need to be reassessed.
Support Zone: 3950–3920 (key defensive area for declines)
If the 4000 level is effectively broken, a decline toward the 3800 target may begin (based on the previous upward triangle pattern calculation).
Pattern Signals:
The 1-hour chart shows a triangle convergence consolidation, with a slightly bearish structure.
A double top formed at 4380 last week, indicating short-term bearish dominance.
III. Core Trading Strategy
Primary Approach: Focus on selling on rallies, with buying on dips as a secondary strategy. Strict risk control is essential.
Key Resistance: 4020–4050
Key Support: 3950–3920
Specific Action Plan:
Short Strategy (Primary):
Entry: Sell in batches in the 4020–4050 zone (position ≤ 30%)
Stop Loss: 4060
Target: 3980–3950, with a break below targeting 3920
Long Strategy (Secondary):
Entry: Lightly test buying in the 3950–3920 zone (position ≤ 20%)
Stop Loss: 3900
Target: 3980–4000
IV. Risks and Contingency Tips
Data Risks:
Ahead of the Fed's interest rate decision on Thursday, the market may remain volatile. Be cautious of sudden news triggering breakouts.
If Core PCE and GDP data exceed expectations, the current technical pattern may be broken.
Trading Discipline:
Total position size should be controlled within 50%, with a single stop loss not exceeding 3% of capital.
If the price breaks above 4050 and holds, pause short positions and observe the performance at the 4100 resistance level.
If the 3920 support is broken, abandon long positions and look toward the 3880–3850 zone.
Note: The current market is event-driven and volatile. Technical signals need to be flexibly adjusted based on real-time news. It is recommended to closely monitor the effects of U.S. Treasury yields and the U.S. Dollar Index during the European and U.S. trading sessions.

Gold (XAUUSD): Please wait for the correction to completeGold (XAUUSD): Please wait for the correction to complete. Market in HTF is bullish. Any sell opportunity is risky, although I missed a good one yesterday. Wait for the correction to complete. A good reaction to the highlighted area a good sign that gold will turn to bullish in MTF and LTF soon. Be patient.
Cheers

GOLD XAUUSD LONDON OPEN TO THE MOON AGAIN SCALPING TO THE BANK
THE YELLOW METAL SELLOFF CONTINUES ON FOMC FEDERAL FUND RATE OUTLOOK.
All eyes are now on the Fed’s monetary policy verdict , as the US government shows no signs of reopening.
Market are almost fully pricing in two interest rate cuts this year, with a 25 basis points (bps) cut .
the key technicality surrounding gold trading is as follows
the 4hr EMA10,EMA20,EMA50,EMA100 are all above price supporting bearish take profit only the 4HR EMA200 IS below price acting as dynamic support on 4hr at 3945-3940 + ema 200 support for buy.
THIS WILL BE LAYER BY LAYER.
THE DOLLAR INDEX BROKEN OFF 98.757 SUPPORT FLOOR INDICATING A POSSIBLE EFFECT ON RATE CUT COMING ,HOWEVER THIS PRICE ACTION PUT GOLD LONG POSITION ON CAUTIOUS MODE.
THE UNITED STATE 10 YEAR TREASURY BOND YIELD CLOSE IN MASSIVE SELLOFF TO CLOSE BELOW 4.0% MARK AT EXACTLY 3.987%
GOLD CORRECTION IS PLAYING ON CAUTION AND the next demand floor will around 3767.90-3764-3760
finally the last layer by layer will be 3700-3706 my pay day zone ....at this level expect to see the hand of GOD.
NOTE;gold trading is very volatile but comes with liquidity ,pls manage your risk and i wish you good luck.
#GOLD #XAUUSD #DXY #US10Y

Gold may fall below 4,000 points this week, short sell!The following only represents my personal thoughts. If you find it helpful, please like and follow to show your support! Please note that any strategy is time-sensitive. As market conditions change, the strategy will also change. I will notify you in the channel based on the actual market conditions!
Gold's nine-week weekly rise officially ended last week, marking the beginning of a phased adjustment for the previously strong bull market. The U.S. CPI data released last Friday was weak, and inflationary pressure was lower than expected, which was bullish for the precious metals market. Based on this, I issued a long order signal, and the gold price did rebound slightly, once reaching the $4,100 mark. However, the upward momentum did not continue to expand, and the price ultimately failed to break through the key resistance level of $4,160, indicating strong upward selling pressure in this area. This technical pattern indicates that it will be more difficult for gold to continue to rise at a high level in the short term. If the price rises back to the 4150-4160 range in the future, you can consider adopting a high-altitude strategy to seize the opportunity of a pullback.
Judging from the opening of this week, market sentiment has clearly cooled, with gold prices opening significantly lower and falling rapidly. The single-day drop has exceeded tens of dollars, reaching a low of around $4,060. It is worth noting that 4060 is the key support area that we emphasized last week, and it is also the bottom position in the previous oscillation structure. The current price is approaching or even testing this area, which means that the game between bulls and bears has entered a white-hot stage. If this support level is effectively broken, gold prices could retest back below $4,000, further confirming a shift from a strong short-term trend to a weak one. Absent unexpected geopolitical or financial risk events, the likelihood of gold continuing its downward trend significantly increases, and the risk of falling below the $4,000 mark is rising.
Looking back at the evolution of this round of trends, after nine consecutive weeks of positive closings on the weekly level, a negative line appeared, releasing an obvious signal of weakening bullish momentum. Meanwhile, technical indicators on the daily chart are beginning to show signs of fatigue: the MACD is showing shrinking red bars, the KDJ is forming a downward death cross at a high level, and prices are gradually moving away from the short-term moving average system. Currently, the price is facing a dual test of the 20-day moving average and the middle Bollinger Band. These two technical reference lines intersect in the 4060-4070 range, forming an extremely important bull-bear watershed at present. If the gold price can stabilize and rebound in this area, there is still a basis for maintaining range fluctuations; but once it falls, it will most likely start a new round of downward trend.
It is worth emphasizing that the inertial thinking of "rising as soon as the market opens" in the past period of time is no longer applicable to the current market environment. With the adjustment of macro expectations, the hawkish policy path of the Federal Reserve and the slowdown in gold purchases by some central banks, the unilateral upward logic of gold is weakening. Therefore, trading strategies must keep pace with the times and adjust directions in a timely manner.
Based on the current technical structure and market sentiment, this week's strategy should primarily focus on shorting rallies. It is recommended to arrange short orders in batches within the range of $4090 to $4110, and strictly set stop-loss to prevent unexpected reversals. At the same time, closely monitor the support level of $4060-4070. If a significant break occurs, the next target could be $3950 or even $3900. Barring any major risk events, gold prices are expected to remain under pressure, and a break below the psychologically important $4000 level is not out of the question.
October 31st Gold Intraday Short-Term Trading Guide!!!Gold prices retreated from around 4044-46 during the day, hitting a low of 3988 in the morning. Currently, it's oscillating within the 4000-4126 range. Today is the weekly and monthly close, potentially triggering a significant price movement. From a trend perspective, short-term gains remain limited. A further dip to 4000 is possible amidst the consolidation. A break below 3986/3960 could lead to a move towards 3920-3900. The recommended strategy is to sell on rallies, but be aware of the risks.
US Session Trading Strategy:
Sell near 40120-25, stop loss at 4035, target 4000-3990, continue to look for further downside if the price breaks through.
Gold Price Analysis October 31🟡 XAUUSD Update
After a correction period, gold has formed a double bottom pattern, showing a clear reversal signal. The price has just broken out of the important resistance zone of 4026, reaffirming the main uptrend. Currently, the bullish momentum is still being consolidated, with the next target around the 4141 area.
Technically, if the buying force is strong enough to push the price above 4141 – 4126, the uptrend will continue to expand, heading towards higher peaks in the coming time. The fundamental data is also supporting this bullish momentum.
📈 Trading Strategy:
Prioritize BUYing with the trend
BUY Trigger: When the price breaks the resistance zone of 4141–4126
BUY Now
🎯 Target: 4141 and above

xauusdThe main trend is still bearish, but this is not an ideal moment to enter, as the price is currently touching a demand zone (3940–3920).
The next short re-entry zone will be between 3975–3990 if the price pulls back to that area.
Entry: 3980
Stop Loss: 4005
Take Profit 1: 3945
Take Profit 2: 3920

OUR BUY ACTIVATED Our buy zone got respected nicely so let see how it goes but we are closing before 5:30 and listen to Jay Powell

XAUUSD Trading forex based on strong fundamentals is beneficial because it allows investors to make informed decisions grounded in real economic data rather than speculation. By analyzing key indicators like interest rates, inflation, GDP growth, employment, and geopolitical stability, a trader can anticipate currency movements driven by macroeconomic forces. This approach helps identify long-term trends and reduces emotional or impulsive trading, offering more consistent and sustainable profits. In essence, good fundamentals turn forex trading from a gamble into a strategic investment rooted in economic reality.

XAUUSD Buy SetupHey Guyx,
Lets dive in with good RR again. If this works then we'll get good profit.

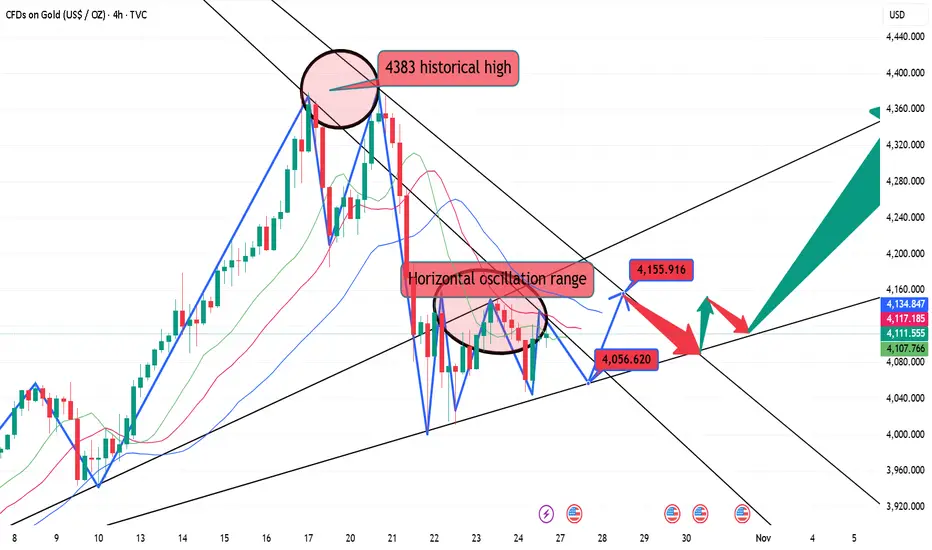
Gold daily K-line stopped falling, and the slow bull correction On Friday, the market corrected for 2 hours, finding support near 4045 on the lower 2-hour band, before retracing upwards. Next week, tomorrow, the 3-hour correction will gradually begin. Currently, the 3-hour BOLL is moving sideways, further oscillating within the range. Once the 3-hour correction concludes, the 4-, 6-, 8-, and 12-hour bands will begin to correct. Ultimately, the next bullish and bearish trend will unfold during this 4- to 12-hour correction.
On Monday, we'll initially focus on the 3-hour BOLL band range. Currently, the range is between 4155 and 4050. Within this range, the market will continue to fluctuate, with buy low and sell high being the primary strategy. Therefore, a buy low, sell high strategy within the 4155-=4050 range should be sufficient.
Technical Analysis:
1: The 3-hour correction is evident, with the BOLL range moving sideways, within the 4050-4155 range. Buy low, sell high is a viable strategy within this range.
2: The 4-hour Stochastic and MACD lines are both blunting, indicating a temporary sideways trend. The central axis of pressure is near 4145 .
3: In the daily K-line chart, the Stochastic is blunting and moving downward, signaling a bearish bias. The MACD is initially forming a death cross and moving downward, signaling a bearish bias. However, the central axis of the daily K-line is holding support, currently moving up to around 4085, followed by support around 4000.
Overall, the technical outlook suggests a range-bound trend within the 3-hour chart, followed by a gradual upward trend within the 4-hour chart, followed by a volatile upward trend within the daily K-line. This is the corresponding signal of the current market; but the specific approach is mainly to wait and see and respond as needed!

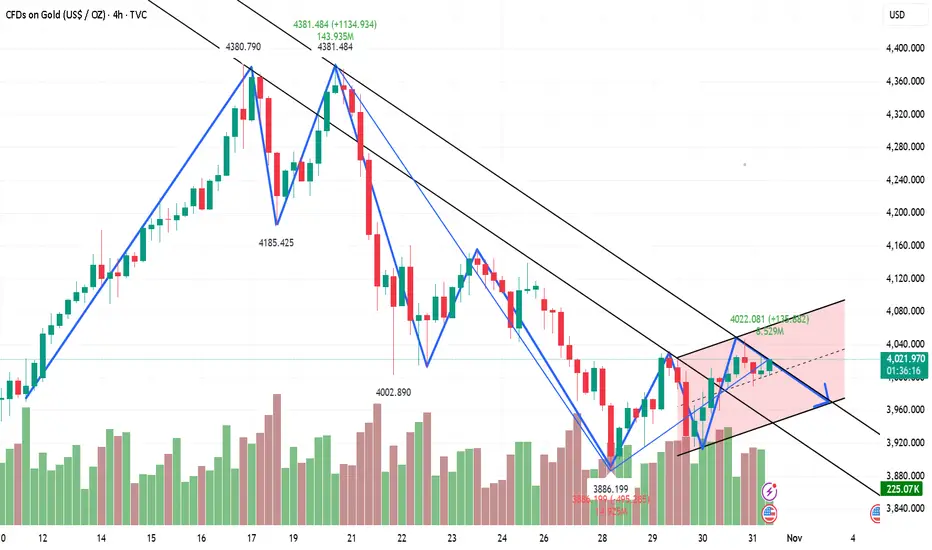
Gold Retracement ideaXAUUSD after a huge 3500 B/O, is it finally time for a pull back? Short positions can be taken targeting lower fib levels with proper risk management. Break of ATH invalidates any further pull backs. This is only market speculation and should not be considered as financial advise

XAU/USD 30 October 2025 Intraday AnalysisH4 Analysis:
-> Swing: Bullish.
-> Internal: Bullish.
Analysis and bias remains the same as analysis dated 20 October 2025.
Price has printed as per previous intraday expectation by printing a bearish CHoCH which indicates, but not confirms, bullish pullback phase initiation.
Price is currently trading within an established internal range, however, I will continue to monitor price with regards to depth of pullback.
Intraday expectation:
Price to continue bearish, react at either discount of 50% internal EQ, or H4 supply zone before targeting weak internal high priced at 4,380. 990.
Note:
The Federal Reserve’s sustained dovish stance, coupled with ongoing geopolitical uncertainties, is likely to prolong heightened volatility in the gold market. Given this elevated risk environment, traders should exercise caution and recalibrate risk management strategies to navigate potential price fluctuations effectively.
Additionally, gold pricing remains sensitive to broader macroeconomic developments, including policy decisions under President Trump. Shifts in geopolitical strategy and economic directives could further amplify uncertainty, contributing to market repricing dynamics.
H4 Chart:
M15 Analysis:
-> Swing: Bullish.
-> Internal: Bearish.
Analysis and bias to remain the same as yesterday's bias date 29 October 2025.
As expected, price has printed a bullish CHoCH to indicate bullish pullback phase initiation.
Price is now trading within an established internal range.
Intraday expectation:
Price to continue bullish, react at either premium of internal 50% EQ or M15 demand zone before targeting weak internal low, priced at 3,886.456.
Note:
Gold remains highly volatile amid the Federal Reserve's continued dovish stance, persistent and escalating geopolitical uncertainties. Traders should implement robust risk management strategies and remain vigilant, as price swings may become more pronounced in this elevated volatility environment.
Additionally, President Trump’s tariff announcements, particularly against China, are expected to further amplify market turbulence, potentially triggering sharp price fluctuations and whipsaws.
M15 Chart:

GOLD XAUUSD LONDON MARKET PERSPECTIVE GOLD ON 2HR CONSOLIDATING BETWEEN 3951.21 AS DEMAND FLOOR AND 3974-3978 AS SUPPLY ROOF.A BREAK IN ANY DIRECTION WILL CALL FOR A NEW CHART.
CASE1 A BREAK OUT FROM 3974-3978 WILL LEAD TO RETEST OF 4030 AND EXTENTED.
CASE 2 A BREAK BELOW 3951 WILL CHALLENGE 3885-3889 AND MIGHT AIM THE DESCENDING TRENDLINE AROUND 3804 AS SUPPORT.
KEY FUNDAMENTAL REPORT TODAY FROM UNITED STATES .
The Federal Reserve announced a 25 basis point cut to its benchmark federal funds rate on October 29, 2025, lowering the target range to 3.75% - 4.00%. This marks the second consecutive rate reduction this year. The decision was made amid moderate economic expansion, a slowing job market, slightly elevated inflation, and uncertainty caused by limited economic data due to a government shutdown.
The Fed also stated it will end the reduction of its balance sheet assets (quantitative tightening) on December 1, 2025. The committee emphasized attentiveness to the evolving economic outlook, risks to employment and inflation, and readiness to adjust policy accordingly. The vote was 10-2, with some dissent for either deeper cuts or no cuts at all.
This rate cut supports easing financial conditions to aid maximum employment and returning inflation to the 2% long-run goal.
Federal Reserve Chair Jerome Powell delivered speech.
Key points from his speech:
The Fed remains focused on achieving maximum employment and stable prices.
Despite some disruption from a partial government shutdown delaying some economic data, available information indicates little change in employment and inflation outlooks since the September meeting.
Labor market conditions appear to be gradually cooling, with inflation still somewhat elevated.
The rate cut was aimed at supporting these goals given the balance of risks to employment and inflation.
The Fed will end the reduction of its asset holdings (quantitative tightening) on December 1.
Powell emphasized a balanced approach between supporting growth and controlling inflation, noting the policy is not on a preset course.
Future rate moves remain data-dependent; a December rate cut is not guaranteed.
He acknowledged the challenges and trade-offs in monetary policy decision-making, especially under uncertainty from recent disruptions.
Overall, Powell’s speech conveyed cautious optimism combined with a pragmatic acknowledgement of incoming risks and uncertainty, signaling readiness to adjust policy to evolving economic conditions.
NOTE ;TRADING IS 100% PROBABILITY.
RISK MANAGEMENT IS KEY
ANY KEY LEVEL CAN FAIL.
#GOLD #US10Y #DOLLAR

Gold at Crossroads: Supply Pressure vs Demand Rejection1. Market Structure
Overall, gold is currently in a corrective phase following a strong bullish rally. The latest move formed a Higher High (HH) around 4,350–4,360, followed by a sharp rejection — signaling that supply pressure has started to take control.
2. Supply Zone & SELL Potential
Strong Supply Zone (4,336–4,350): This is a key resistance area where price previously faced heavy rejection. If price retests this level, it could provide a potential SELL setup, especially if a clear reversal candle such as a bearish engulfing or shooting star appears.
However, if this zone is broken with a solid bullish candle, the market could likely print a new All-Time High (ATH) in line with the medium-term bullish momentum.
3. Golden Ratio Supply Area (around 4,246–4,264)
This area acts as both a Take Profit zone for prior long positions and a directional confirmation zone. A failure to break above could trigger another rejection and deeper pullback, strengthening short-term bearish pressure.
4. Secondary Reaction Area (around 4,150)
This zone has been tested three times, confirming a strong short-term supply presence.
Plan: wait for a strong bullish breakout candle above this area to validate a continuation move. If another rejection forms, price could head back toward the Demand Area (4,065–4,043).
5. Demand Area (4,065–4,043)
A key level for potential BUY setups. Look for a clear bullish reversal candle before entering. If this zone holds, the market could rebound higher.
But if it breaks down, price may extend lower toward the Major Demand zone (3,974–3,986).
6. Major Demand (3,974–3,986)
A strong base zone capable of halting further downside movement. Suitable for swing BUY setups with a favorable risk-reward ratio, as long as price stays above this level.
Trading Plan Summary
BUY PLAN:
Wait for bullish confirmation near Demand Area (4,065–4,043) or Major Demand (3,974–3,986).
First targets: Secondary Reaction Area (4,150) and Golden Ratio Supply (4,246).
SELL PLAN:
Wait for clear rejection or reversal candle near Golden Ratio Supply (4,246) or Strong Supply (4,336–4,350).
Target: Demand Area (4,065–4,043).
Conclusion
Gold is currently in a neutral strategic zone, squeezed between strong supply and solid demand. The next directional move will largely depend on how price reacts around the Secondary Reaction Area and Demand Area.
The key principle: don’t predict—react to confirmation.

LIKE A DILEMMA BUT AM VERY BULLISH ON GOLDGold failed to close above 4130 yesterday and that's a kind of trade dilemma because it's like it respected the sell zone above, so it's in-between a sell zone and a buy zone which can make price move in any direction but i still believe it would buy more, so if you took the yesterday's buy and you are holding i suggest you set sl at either 4090 or 4085 when market opens to lock profits and also allow room for retracement .
You can also target a buy at 4110-4105, with sl at4090/85, if you are not in a buy already,
if price moves and closes above 4130 by Monday afternoon time then it will have a high probability of buying to 4250 or above, but if it fails to move above 4130 and closes below 4100 then it could lead to more sells rather.

XAU/USD (GOLD) Inverse Head & Shoulder Pattern Bullish Analysis📈 #XAUUSD (Gold) Technical Update 💰✨
Bullish momentum building on the 1H timeframe with an Inverse Head & Shoulders breakout above the 4115 neckline! 🚀
🎯Breakout Level: 4115
💪Pattern: Inverse H&S — bullish continuation
Technical Targets:
TP1, 4156
TP2, 4202
TP3, 4375
As long as price holds above 4115, bias remains bullish 🟢
Keep an eye on volume confirmation and potential retest zones before the next leg up! 🔍
#Gold #XAUUSD #Forex #TechnicalAnalysis #PriceAction #Trading
