$3800 target for Gold coming soonExpecting Gold to have a minor Drop to $3800. Then Hover back to test $4000 again.
So load up when it drops.
Happy investing all!
Trade ideas

xauusd possible moveConsidering what l have mapped down, this is likely gold's next path
Analyse, execute, monitor
Disclaimer : Risk as per self responsible

1:10RR GOLD BUY SETUP FOR THE WEEKWe are looking for a bullish setup for the week. Price has broke shifted structure to the upside so will be only looking for buys this week. On our chart we have a breaker block which also confluences with our 61.8% Fibonacci. That's where we will be looking to take our trade.
ENTRY:3982
TP:4053
SL:3974

Gold holds above $4000 — waiting for breakout confirmation🟠 Market Overview
Gold (XAU/USD) is trading around $4012, moving in a narrow range between $4000 – $4020.
Buying pressure remains firm near the psychological support at $4000, while sellers are defending the $4025–$4030 resistance zone.
The market is in a neutral consolidation phase, waiting for direction before the U.S. session tonight.
📊 Technical Analysis
• Near-term support: $4000 – $4003
• Near-term resistance: $4025 – $4028
• EMA50 (H1): currently around $4008 — acting as dynamic support.
• RSI (H1): near 48 — neutral, suitable for two-way scalping setups.
🔎 Outlook
Gold is “compressing” around $4010.
Main scenario: if the price holds above $4000 and confirms a bullish H1 candle, the upward trend could resume toward $4035–$4050.
Conversely, if the price closes below $3998, a pullback to $3985 becomes likely.
→ Prefer BUY setups on support reactions, and SELL setups only on strong rejection near resistance.
🎯 TRADE STRATEGY
🔺 BUY XAU/USD : $3987 – $3984
🎯 TP: 40 / 80 / 200 pips
🛑 SL: $3980
________________________________________
🔻 SELL XAU/USD : $4026 – $4029
🎯 TP: 40 / 80 / 200 pips
🛑 SL: $4033

downtrend is over so gold is ready for the upsidegold might be able to make a correction towards the upside to correct the impulsive bearish movement.
we expect gold to be heading towards 4165 area.

INVALID SELLClose this trade because it's likely going to buy more , it doesn't look favorable to sell so let close and wait for another opportunity

What's next for the yellow metal?We've had an incredible run from September until late October, and even when the pullback started it was a solid move. And, so what's up now? Well, as you see in the chart for the converse ICT or SMC traders, the stacked Weekly BISI (Buyside Imbalance Sellside Ineffiency) held solid support to keep price from pushing any lower. Based on the current Dealing Range, price closed within the Discount range. I'd like to see price make a push higher and possibly testing into 4150, and maybe it'll start to create a base there for another leg higher. I won't be so ambitious to expect another ATH just yet, it'll take some time for price build some soild ground first. I'm expecting another range bound trades again until 4200 can be broken to confirm buyside momentum still intact.
Good luck and safe trade.

Gold (XAUUSD) Trade PlanGold (XAUUSD) Trade Plan
At the moment, this is the observation phase — I want to see which direction the market moves first.
The ideal scenario would be a gap-down open, followed by a liquidity grab below the previous week’s low, and then a move to the upside.
There’s a daily bearish Fair Value Gap (FVG) above that remains unmitigated, so if the market takes out the weekly low first and then starts showing strength, I’ll be looking for long setups targeting that upper imbalance.
However, if price fails to hold above the CISD level and breaks lower structure instead, I’ll shift my bias to bearish continuation toward the weekly T2 and DOL zones.
For now, patience is key — waiting for the first move to reveal direction before making any trade decisions.

XAU USD - Corrective wave ABC?Updte to previous post.
Still long, awaiting the corrective structure to occur - firstly to break and hold under $4000 (key level).
Downward channel - to $3800 which is another area of interest - reason being, it holds high volume at a structure point under $3800. So, we sit tight and await the corrective pattern to emerge and complete.
Daily chart image shows my thought pattern and an opportunity I am waiting for price to revert to.
I'm referring to the Daily price chart and key counts are in line with Wave counting and supply and demand curve trading levels based on fair value gap intervals of weekly trading sessions plotted to a daily chart at intervals of 60.
Current wave - 3 of 5 in the Elliott wave count.
Experiencing ABC corrective structure.
Master Key for zones
Red = Three Month
Blue = Monthly
Purple = weekly
Pink = Consolidative box example (Daily)
Orange = Daily
Risk Warning
Trading leveraged products such as Forex, commodities and CFDs, carries with it a high level of risk and so may not be suitable for every investor. Prior to trading the foreign exchange, commodity or CFD market, consider your investment objectives, level of experience and risk appetite. You should never risk more than you can afford to lose. If you fail to understand or are uncertain of the risks involved, please seek independent advice and remember to conduct due diligence as criteria varies to suit the individual.
Below are some of the take aways from the video - please listen again incase any detail is missed.
Do you enjoy the setups?
Professional analyst with 8+ years experience in the capital markets
Focus on technical output not fundamentals
Focus on investing for long term positional moves
Provide updates where necessary - with new updated ideas tracking the progress.
If you like the idea, please leave a like or comment.
To all the followers, thank you for your continued support.
Thanks,
LVPA MMXXIV

Possible BUY Opportunity for NovemberReason for Buy
- Fed Rate is weak for USD
- Price action is already forming higher highs
- wait for price to pullback from 4126 to 4043
- then enter buy
Other Scenario:
- on monday price may pullback further
- will go sideways on 3972 - 4044 range
- or trace liquidity beyond 3916
DO NOT TRADE WITHOUT PROPER CONFIRMATION

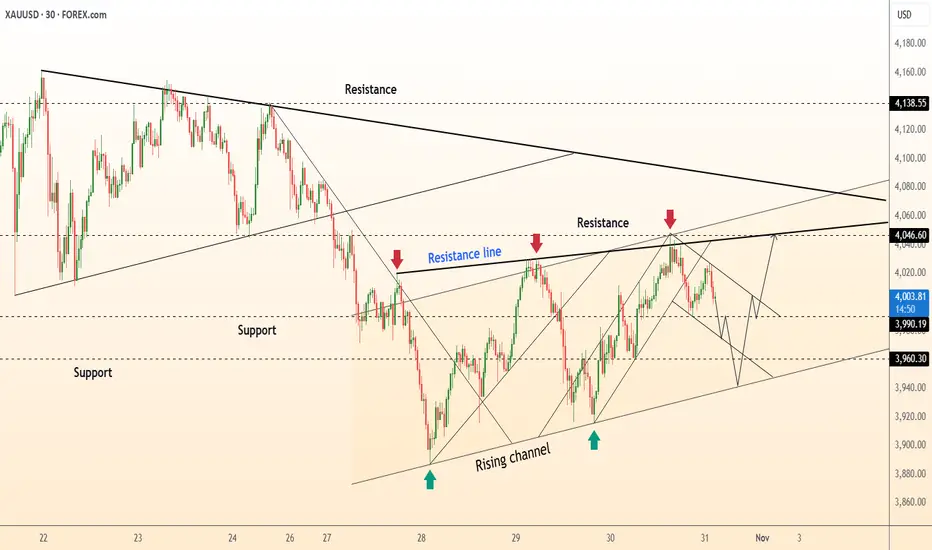
DeGRAM | GOLD is forming a new local ascending structure📊 Technical Analysis
● XAU/USD is forming a rising channel, holding firm above 3,960 support after rejecting from the resistance near 4,046.
● The pattern suggests a continuation of the uptrend as long as price sustains above the channel base, with potential breakout targets toward 4,138.
💡 Fundamental Analysis
● Gold remains supported by a softer dollar and cautious market sentiment ahead of key U.S. employment data, which could further boost safe-haven demand.
✨ Summary
● Long bias above 3,960; targets 4,046–4,138. Rising structure and weaker dollar fundamentals reinforce short-term bullish momentum.
-------------------
Share your opinion in the comments and support the idea with a like. Thanks for your support!
Continue to accumulate along the 4058 trend line⭐️GOLDEN INFORMATION:
Gold (XAU/USD) faces renewed selling pressure after an early Asian uptick toward $4,046, pausing this week’s rebound from its lowest level since October 6. The US Dollar (USD) holds near a three-month high following the Federal Reserve’s hawkish stance, weighing on the non-yielding metal.
Additionally, optimism over easing US–China trade tensions dampens safe-haven demand. Still, lingering worries about the prolonged US government shutdown could limit USD strength and offer some support to gold prices.
⭐️Personal comments NOVA:
market accumulation time, sideways around 4000. ended october with volatility
⭐️SET UP GOLD PRICE:
🔥SELL GOLD zone: 4058 - 4060 SL 4065
TP1: $4050
TP2: $4040
TP3: $4020
🔥BUY GOLD zone: 3887 - 3885 SL 3880
TP1: $3900
TP2: $3910
TP3: $3925
⭐️Technical analysis:
Based on technical indicators EMA 34, EMA89 and support resistance areas to set up a reasonable sell order.
⭐️NOTE:
Note: Nova wishes traders to manage their capital well
- take the number of lots that match your capital
- Takeprofit equal to 4-6% of capital account
- Stoplose equal to 2-3% of capital account

The Psychology Behind Winning Trades The Psychology Behind Winning Trades 🧠💹✨
Introduction – Hook:
📊 “Why do some traders consistently win 💰 while others struggle 💔?”
It’s rarely the strategy—it’s the mindset behind the trade! 🧠🌟
Your emotions, thoughts, and biases control your decisions, even with perfect technical skills. 🎯
1️⃣ What is Trading Psychology?
Trading psychology is the study of how emotions and mental habits affect trading decisions. 🌈🧘♂️
It’s about understanding:
How fear 😨, greed 😍, or impatience ⏳ impacts your trades
Why you sometimes ignore your rules 📝
How discipline 💪 can make the difference between profit 🏆 and loss 💸
💡 Tip: Even the best strategies fail if your mind isn’t in control. 🧠✨
2️⃣ Common Psychological Traps & How They Appear in Trades
Trap Emoji Effect Example in Trading
Fear 😨 Exiting too early Closing a winning trade because you’re scared of losing profits 💔
Greed 😍 Holding losing trades Waiting for a loss to “come back” and losing more money 💸
FOMO 🏃♂️💨 Jumping impulsively Entering trades last minute because everyone else is trading 🚀
Revenge Trading 😤🔥 Emotional loss-chasing Trying to recover losses by taking bigger, risky trades 💣
💡 Insight: Recognizing these emotions is the first step to controlling them. 🌟
3️⃣ How to Master Your Trading Mind
1️⃣ Pre-Trade Preparation 🧘♀️✅
Check your emotional state before trading 🕊️
Confirm your trade plan is clear 📋✨
2️⃣ During the Trade ✋🎯
Stick to your rules, don’t let emotions take over 💪🔥
Avoid impulsive exits or entries ⏱️❌
3️⃣ Post-Trade Reflection 📖🖊️
Keep a Trading Journal: note emotions, mistakes & wins ✨📓
Review trades to improve your mindset over time 📈🌟
4️⃣ Pro Tips for Winning Psychology
🔥 Mindset Checklist:
Am I trading calmly? 😌💭
Am I following my plan? 📋✅
Am I chasing losses or profits emotionally? ⚖️💡
💡 Daily Mindset Practice: Meditation 🧘♂️, journaling ✍️, or reviewing trades 📊 can help you stay disciplined under pressure 💎🌟
5️⃣ Why It Matters
Trading without psychology = strategy leaks money 💸💨
Emotional control = consistency, higher win rates, confidence 🏆💪
Professionals don’t just trade charts—they trade themselves 🧠✨
6️⃣ Engagement Section
👇 Question for your audience:
“What’s the biggest psychological trap YOU’ve faced in trading? Share your story below! 💬💭💖”

Elliott Wave Analysis – XAUUSD (Gold) | November 7, 2025
🔹 Momentum
D1 timeframe:
Daily momentum is turning upward, but just one more bullish candle will push it into the overbought zone. This suggests that the current upward move may not be sustainable, and a short-term correction could occur soon.
H4 timeframe:
H4 momentum is about to turn bullish from the oversold area. If this signal is confirmed, we can expect a short-term upward move. However, as the market is currently in a balanced state, even a small push from either buyers or sellers could shift momentum direction. Therefore, it’s better to observe carefully rather than act too early.
90M timeframe:
Momentum on the 90-minute chart is turning downward, indicating a possible short-term pullback before any further advance.
________________________________________
🔹 Wave Structure
D1 timeframe:
The ongoing rise in momentum indicates that wave X is still unfolding, meaning the corrective phase is not yet complete.
H4 timeframe:
Wave X is currently forming. The liquidity zone at 4028 remains a key level to watch.
If the price breaks above this zone, the next target will likely be the upper liquidity zone at 4070.
On the H4 chart, the green level around 4007 represents the highest-volume area, currently acting as a strong resistance.
Combined with the H4 bullish momentum reversal, it shows buying pressure exists, but the resistance remains heavy, making the 4007–4028 region a key battleground.
We should wait for a clear breakout before confirming the next direction.
90M timeframe:
• A triangle-like structure seems to be forming, but it’s not yet complete, so confirmation is needed.
• Waves a and b appear finished; the market may now be forming wave c (black) or wave d (black).
• Since H4 momentum is turning bullish, if the price breaks above 4012, it will likely confirm wave c continuation.
• Conversely, if the price drops toward 3950, completing a three-wave WXY (blue) structure, we can consider it wave d instead.
Currently, wave c (black) is temporarily labeled since the structure already shows three subwaves completed.
Therefore, I expect a decline toward 3950, where we can look for a short-term buy setup.
________________________________________
🎯 Trade Plan
• Buy Zone: 3952 – 3950
• Stoploss: 3935
• TP1: 3980
• TP2: 4000

Gold surginghopefully i setup is reaching target soon after overwhelming moves throughput the day and i am positive on gold buy if it remains above 4040 next week.

Gold consolidates below $4000Gold is continuing to consolidate inside of a dynamic support area below $4000 level. Volumes have dropped to the new low for the 4-weeks period, but open interest starts to slowly build at current price levels. The market may need more time to complete the consolidation and resume moving in the upward direction. Before bouncing back, it might retest the $3900 price area as shown at the chart.
Absence of macro economic publications freezes trading activity across the board, as traders lack new driving narratives.
Don't forget - this is just the idea, always do your own research and never forget to manage your risk!

Gold (XAU/USD) Technical OutlookGold (XAU/USD) Technical Outlook – Range-Bound Structure and Potential Upside Rebound
Gold continues to trade within a well-defined range on the 1-hour timeframe, showing clear reactions between the 3,950–4,030 zones. The market has been forming a sequence of equal highs and equal lows, signaling a potential accumulation phase before the next impulsive move.
1. Technical Overview
Price Structure: The market remains locked in a consolidation range. Each dip into the lower boundary around 3,950 has been met with buying pressure, while the upper zone near 4,030 consistently acts as resistance.
Trend Context: Although momentum remains neutral, the formation of a potential higher low structure indicates the possibility of a short-term bullish reversal within the range.
Dynamic Support: Price is currently hovering around the 9-period DEMA (4,006), which serves as intraday support. A rebound from this level could trigger the next leg toward the upper boundary.
Fibonacci Observation: The retracement from the recent swing high aligns with the 0.618 zone, adding confluence to the projected bullish reaction.
2. Key Technical Levels
- 4,025 – 4,035;Range top; key level to break for continuation
Support Zone
- 3,950 – 3,960;Lower boundary of the range; strong buy zone
Mid-Range Level
- 4,000;Intraday pivot area; currently acting as equilibrium
Major Support
- 3,920;Invalidation level; below here the bullish setup fails
3. Trading Scenarios
Primary Scenario (Range Rebound Buy)
Wait for price to test the 3,950 – 3,960 support zone.
Enter Buy after confirmation of bullish rejection.
Take Profit (TP): 4,025 – 4,035
Stop Loss (SL): Below 3,920
Alternative Scenario (Breakout Play)
If price breaks and closes above 4,035, it could open room for a larger move toward 4,070 and beyond.
Look for breakout retests to re-enter in direction of momentum.
4. Summary
Gold is consolidating inside a wide range after recent volatility. As long as the 3,950 support holds, the bias remains neutral-to-bullish, with potential recovery toward 4,030 in the coming sessions. A confirmed breakout above this ceiling could mark the start of a stronger upward impulse.
Traders should remain patient and look for confirmation signals around the range extremes, as fakeouts are common within tight consolidation phases.
If you found this setup helpful, follow for daily market structure insights and professional trade ideas — consistent strategy builds consistent results.

XAUUSD — Intraday bullish if 3,996 holds — Targets 4,031 → 4,046Overview
Market printed CHOCH → BOS up intraday. I’ll look for a sell-side sweep into 3,996 (Bullish OB + FVG) and take confirmation longs toward BSL at 4,031 and extension 4,046. I’m not interested in chasing highs; I want liquidity → confirmation.
SMC Map (from your chart)
Buy-side liquidity (targets): 4,031.455, 4,046.774
Supply / Bearish OB: ~4,011
Mitigation zone: Bullish OB + FVG ~3,996.993
HTF Demand / Invalidation floor: 3,952.474
Structure: CHOCH → BOS up (intraday).
Playbook: sweep → BOS → FVG fill → OB entry.
Scenarios (reference levels)
Scenario 1 – Long (preferred)
Entry zone: 3,997–3,999 after a sweep of 3,996 + M5 BOS up and pullback (FVG fill).
SL: below 3,992 or below the M5 BOS swing low.
TP1: 4,011 (supply/OB).
TP2: 4,031 (BSL).
Runner: 4,046 (next BSL).
Management: take partial at TP1, move SL → BE; trail to structure.
Scenario 2 – Defensive short (reaction only)
Entry zone: 4,011–4,013 if price taps supply and prints M5 BOS down.
SL: above 4,016 or above reaction high.
TP1: 4,002 (intra support).
TP2: 3,996 (mitigation zone) → consider flip long if confirmation appears.
Invalidation: H1 close above 4,015 (supply reclaimed).
Notes & Session Timing
Focus on London Killzone; re-assess for NY if 4,011 breaks/holds.
No entries without confirmation (avoid FOMO at highs).
News/catalyst: manage size around data; protect gains into volatility spikes.
Risk
Partial at TP1, SL → BE post-confirmation. Risk per trade ≤ your plan. This is a personal view, not financial advice.

XAU/USD – Retest Before Takeoff📊 Market Structure
After several days of fluctuating within a narrow range, gold has finally broken through the main descending trendline extending from the peak of 4,108 USD.
Buyers are currently controlling the short-term structure by continuously creating BoS (Break of Structure) in the price range of 3,965 – 3,980 USD.
The Order Block 3,970 – 3,975 USD area has become an important dynamic support zone , converging with the newly formed trendline.
If the price continues to hold above this area, there is a high possibility of a light retest to absorb liquidity before breaking out to higher resistance zones.
Above, the Resistance 4,028 USD zone is the first barrier to overcome to confirm the medium-term uptrend, while the Liquidity Zone around 4,070 – 4,080 USD is the extended target of the breakout.
💎 Key Technical Zones
• Order Block (Support): 3,970 – 3,975 USD → potential retest area.
• Resistance Zone: 4,028 USD → first profit-taking point for buyers.
• Liquidity Zone: 4,070 – 4,080 USD → extended target if resistance is successfully broken.
🎯 Trading Scenarios
1️⃣ BUY Scenario – Retest OB:
If the price adjusts to the 3,970 – 3,975 USD area and a confirming candle signal appears (bullish rejection / engulfing):
• Entry: 3,972 – 3,975
• SL: 3,960
• TP1: 4,015
• TP2: 4,028
• TP3: 4,070
→ Prioritize trading with the trend after the uptrend structure is confirmed.
2️⃣ SELL Scenario – Reaction at Resistance:
If the price hits the 4,028 – 4,070 USD area and there is a strong reversal signal:
• Entry: 4,045
• SL: 4,065
• TP1: 4,015
• TP2: 3,985
→ Short-term scalp, only activate if a clear rejection signal appears.
🧠 Vincent’s View
Gold is showing signs of transitioning from accumulation to range expansion .
Breaking the descending trendline is the first signal for a new upward move, as long as the OB 3,970 area remains intact.
Buyers can take advantage of pullbacks to increase their position, targeting 4,070 USD – where significant liquidity converges above.
“Break the line, respect the retest — that’s where smart money joins the move.” ⚜️
⏰ Timeframe: 1H
📅 Updated: 07/11/2025
✍️ Analysis by: Captain Vincent

XAUUSD – WAITING FOR CONFIRMATION OF UPTREND – TARGET 4050 💛 XAUUSD – WAITING FOR CONFIRMATION OF UPTREND – TARGET 4050 🎯
🌤 1. Overview
Hello everyone 💬
Gold today is still in a phase of hesitation – waiting for signals to confirm a new trend.
On the H2 chart, the price has broken the downtrend line and is retesting this line. The structure of “higher lows” indicates that buying power is gradually gaining the upper hand.
The previous peak around 4018 is currently the decisive point for the trend – if the price confirms a breakout above, the uptrend could extend towards the 4050 area.
Currently, the market is fluctuating within the range of 3964 – 4018, and needs to break out of this range to determine a clearer direction.
💹 2. ICT Perspective
📈 The price has broken the downtrend line and retested the structure on the H2 chart – an early signal for the potential formation of an uptrend.
🟣 The 3964–4018 area is a short-term liquidity accumulation zone before the price expands.
🔹 OB 4040–4042 coincides with significant resistance, suitable for short sell (scalp) orders if there is a strong reaction.
💫 When the price exceeds 4018, the uptrend structure will be confirmed and the expansion target could head towards 4050 – 4077.
🎯 3. Reference Trading Plan
💖 BUY Scenario (priority when confirmed)
Entry: above 4018 | SL: 4011
TP: 4025 – 4033 – 4050 – 4077
💢 Short SELL Scenario (scalping)
Entry: 4040–4042 | SL: 4046
TP: 4022 – 4015 – 3998
⚠️ 4. Important Notes
Clear confirmation is needed when breaking the 4018 area before entering a buy order.
If the price continues to fluctuate within the 3964–4018 range, trading should be limited.
Today is Friday, manage risk more strictly, prioritize accuracy in each order.
🌷 5. Conclusion & Interaction with LanaM2
Gold is showing positive signals 💛
Be patient and wait for reactions around the 4018 area – this could be the start of a new uptrend if clearly confirmed.

Gold (XAU/USD) Technical Analysis – November 7, 2025Gold is currently consolidating within a broad sideways range between 3940 – 4040, showing limited directional conviction after several sessions of choppy movement. On the 1H timeframe, the price structure suggests a potential short-term retracement before a new bullish wave emerges.
Technical outlook:
EMA(9) is flattening near 3990, confirming indecision and range-bound sentiment.
Price has repeatedly rejected the 4035–4040 resistance zone, forming a temporary ceiling.
The support area lies near 3935–3945, aligning with previous demand and the lower boundary of the current accumulation channel.
The projected move shows a possible dip toward support before rebounding toward 4040–4050 if buyers regain momentum.
Trading strategy:
Buy Zone: 3935–3945 (look for bullish confirmation patterns)
Take Profit (TP): 4040–4050
Stop Loss (SL): Below 3925
Alternatively, sell scalps near 4035 with tight risk until breakout confirmation.
Market sentiment:
The market remains in equilibrium, awaiting new macro triggers (such as US economic data or bond yield adjustments). A breakout above 4040 could shift bias toward 4080–4100, while a breakdown below 3930 may reopen a path to 3880.
Keep monitoring intraday reactions at the range boundaries — patience and precision are key in sideways markets.
Follow for daily insights and updates on gold price action.

LONG ON GOLD XAU/USDGold has swept sell side liquidity and has given us a choc (change or character) to the upside.
There is tons of buyside liquidity to the upside with huge FVG's (Fair value gaps) and equal highs (double top) that need to be mitigated.
I am buying gold looking to catch over 200-300 points.
That's 2000-3000 pips.

There’s a desynchronization between timeframes.
11:52 / UTC+2
Bias D1 – Short
h4 / h1 – Long
There’s a desynchronization between timeframes.
A safe long will be confirmed once the price consolidates above 4030 as the first sign of long validation, with the main confirmation being a close above Fractal D1 4046.
Until these confirmations appear, I’ll be waiting for short confirmations on h1.
The current price range is 1.33% (as of 11:48 UTC+2), so I expect increased activity closer to the NY session.
Below, internal swings remain a magnet, with the main target at PWL.
On h1, the growth is quite solid, so the long may continue, with the primary target at Fractal D1 4046.
