Wall Street Weekly Outlook - Week 44 2025 [27.10.- 31.10.2025]Wall Street Weekly Outlook – Week 44, 2025 📊💥
Let’s dive into another exciting trading week! 🚀
Rate decisions, month-end flows, and fresh quarterly earnings are setting the stage for strong market moves.
Sit back, enjoy the overview, and dive into the world of banks, hedge funds, and institutional flows — with exclusive insights into how the pros are positioning right now. 🧠💼📈
Extra Lessons: Strategies, setups, and market psychology — everything you need to know for the week ahead. ⚡️
**S&P500 Performance after FED rate cuts**
**Overview: The most important events of the week**
Have a great start to the trading week!
Meikel
Trade ideas

GOLD → A psychologically important level of $4,000 lies aheadFX:XAUUSD continues to correct, unable to consolidate above $4,100, with the 4K mark ahead. Pressure is intensifying due to hopes for a trade deal between the US and China, as well as profit-taking ahead of the Fed's decision on interest rates...
Key factors:
Progress in trade negotiations: the US has withdrawn the threat of 100% tariffs, and China may support the situation. Thursday's meeting between Trump and Xi Jinping increases the chances of a deal.
Bets on two rate cuts in 2024 are almost fully priced in. US inflation (3% y/y) was lower than forecast (3.1%), but did not change expectations.
The correction may continue if the positive backdrop for the trade deal remains. The Fed's decision on Wednesday will be a key catalyst.
Technically, the 4K zone is ahead, and it is too early to talk about a break of this support, as we do not know how the market will react. However, at the moment, the price is in the range of 4000-4163, and from a technical analysis point of view, it is logical to consider a false breakdown and a pullback.
Support levels: 4000, 3975, 3944
Resistance levels: 4060, 4090, 4163
As part of the decline, the market may test one of the specified zones: 4000, 3975, 3944. However, since a liquidity pool has formed below 4K, the reaction to the psychological support level may be aggressive. It is important to monitor the situation, as closing below 4K and consolidating below a strong level could trigger a further decline. Otherwise, if the bulls manage to hold their ground above 4K and bring the price back above 4050, the market may have a chance to grow.
Best regards, R. Linda!

GOLD → Price stuck in range after Fed speech FX:XAUUSD continues to battle for the $4,000 zone. The fundamental backdrop has a hint of unpredictability following the Fed's statement. Technically, the range of 3,915-4,015 is developing
Key factors: US shutdown (4th week): Weighs on the economy and the dollar, supporting gold as a safe haven. However, the Fed toughened its tone yesterday: It cut rates by 25 basis points, but Powell ruled out guarantees for a cut in December. Trump and Xi meeting: Agreements reached on soybeans and rare earths, reducing demand for defensive assets.
Gold balances between shutdown risks and monetary policy tightening. Growth is only possible if macro statistics deteriorate or geopolitics escalate.
Resistance levels: 4015 - 4050
Support levels: 3980 - 3960 - 3915
Gold may continue its correction from the 4015 - 4050 zone to 3950 - 3900 if the bulls are unable to keep the price within the upper range. However, if the market continues to buy the metal (there are no fundamental reasons for this yet) and the price closes above 4015, there may be a chance for growth to 4050 - 4085.
Best regards, R. Linda!

Gold Forecast — Market Turning BullishGold (XAU/USD) maintains a strong long-term bullish trend, supported by rising investor demand and global macroeconomic stability. After completing a healthy correction phase, the market is showing renewed strength, indicating a potential continuation of the broader uptrend.
Current price action reflects accumulation behavior among institutional traders, signaling confidence in gold’s long-term value growth. The consistent pattern of higher lows and steady momentum suggests that buyers are firmly in control, preparing for another upward expansion cycle.
From a fundamental perspective, global inflation concerns, a weaker U.S. dollar, and geopolitical tensions continue to support gold prices. Investors are increasingly seeking protection in safe-haven assets, which further strengthens gold’s long-term position in the market.
Technical structure and sentiment both align with a buy-side outlook, highlighting the potential for gold to extend gains as liquidity continues to build in the current price zones.
In summary, gold remains in a strong buying phase, with market data, investor sentiment, and macroeconomic indicators all favoring sustained upward momentum.
Keywords: Gold forecast, XAU/USD analysis, gold long-term trend, gold price outlook, bullish gold market, gold accumulation phase, forex gold trading, gold price prediction 2025.

( Gold Protocol ) Bearish After Break Detected Status: Active Reversal Protocol
Symbol: Gold
Session: London–New York Overlap (Smart Exit Window)
Confidence Level: ★★★★★ ( Hanzo Volume Detected )
☄️ Bearish After Break Out 4005
Reasons
1. Alpha Sequence Engaged
— Smart flow detected within Hanzo precision range.
2. Volume Window Synced
— Session energy aligns with internal volume pulse.
3. Liquidity Cycle Active
— Engineered sweep confirms smart money transition.
4. Time Lock Confirmed
— Market phase locked with directional intent.
5. Volume Map Aligned
— Cluster balance reveals real directional flow.
6. Hanzo Wick Detected
— Manipulation wick verified under Alpha filter.
⤵️Every like & comment on our TradingView posts helps us grow. More engagement means more exposure, which benefits everyone in the community!

XAUUSD: Correction Phase Aiming Toward 3,900 SupportHello everyone, here is my breakdown of the current Gold setup.
Market Analysis
Gold (XAUUSD) has shifted from a strong bullish phase into a clear bearish structure after failing to sustain momentum above the 4,130 Resistance Zone. The market initially traded within an Upward Channel, forming a steady series of higher highs and higher lows until buyers lost strength near the top of the range. A breakout from the channel confirmed the end of the bullish impulse, followed by a range formation and multiple fake breakouts, indicating indecision and growing selling pressure. Eventually, the market broke below the range, retested the resistance area, and established a Downward Channel, showing that sellers have regained control.
Currently, Gold is moving within this descending structure, respecting both the upper and lower boundaries of the channel. The Resistance Zone around 4,130 has once again acted as a strong supply area, rejecting price and pushing it lower toward the Support Zone near 3,900.
My Scenario & Strategy
From my perspective, XAUUSD is likely to continue its short-term bearish correction toward the 3,900 support level, which aligns with the lower boundary of the channel. A successful test of this area could trigger a short-term reaction or even a potential reversal if buyers step in.
As long as price remains below the Resistance Zone (4,130) and within the Downward Channel, the bearish sentiment remains dominant. A confirmed breakdown below 3,900 could open the door for a deeper move toward the 3,850–3,820 zone. For now, I remain bearish in the short term, looking for short opportunities from the upper channel resistance with a primary target at 3,900.
That's the setup I'm tracking. Thank you for your attention, and always manage your risk.

XAUUSD – Bearish Pressure After Historical HighsGold prices continue to experience significant downward pressure as profit-taking surges after a strong rally. From the historical peak of nearly 4,400 USD/ounce, gold has lost nearly 12 million VND per tael , and is at risk of falling further if the 4,000 USD/ounce level cannot hold.
On the H4 chart, XAUUSD is forming a bearish trend with a clear price structure. Gold is facing a downward trendline , and each recovery from the lows encounters strong selling pressure . Currently, the price is hovering around 3,935 USD, near the support zone at 3,990 USD, and could drop further to 3,750 USD if this level fails to hold.
Key factors affecting the price:
USD recovery: The strengthening of the US dollar and rising US Treasury yields have reduced gold's appeal, as it does not yield interest.
Increased risk appetite: Progress in US-China trade talks is drawing funds towards equities and industrial commodities.
Trading Strategy: Sell gold around 4,000 USD, with a target of 3,750 USD, and stop loss above 4,050 USD.
Conclusion: XAUUSD remains in a mild bearish trend, with further downside potential if the 4,000 USD level is broken.

Gold 1979 vs 2025 — When History Whispers and Markets Listen
🌕 1. The Echo of 1979
In 1979, the world watched Gold do the impossible. The metal surged from $226 to over $850 per ounce in less than a year, a 275% explosion that turned fear into fortune.
The triggers were seismic.
🇮🇷 The Iranian Revolution disrupted global oil flows.
🏛️ The U.S. Embassy hostage crisis fueled geopolitical panic.
⚔️ The Soviet invasion of Afghanistan reignited Cold War fears.
💸 And double-digit inflation in the U.S. shredded faith in the dollar.
By early 1980, panic replaced logic. Every newspaper screamed, “Buy Gold before it’s too late!” Then came Paul Volcker’s shock therapy as interest rates jumped above 15% and COMEX doubled margin requirements. Within eight weeks, Gold fell more than 40%, marking the end of one of the most dramatic speculative manias in modern history.
🔁 2. Fast-Forward to 2025: The Parallels Are Uncanny
The world of 2025 looks hauntingly similar.
🕰️ 1979 🔮 2025
Iranian Revolution and Cold War tensions Gaza war, U.S.–China decoupling, and regional instability
Oil shock and inflation Energy disruptions and persistent post-pandemic inflation
Dollar under pressure Record U.S. debt and fiscal erosion
Panic buying of Gold Central bank accumulation and retail FOMO
Fed under Volcker turns hawkish Fed under Powell trapped between cuts and control
By late August 2025, gold sat quietly near $3,415, then erupted into a seven-week vertical rally above $4,300, a mirror image of 1979’s euphoric climb. But just like back then, euphoria was the prelude to exhaustion.
⚠️ 3. The Anatomy of the Current Crash
On October 17, 2025, Gold plunged $250 in one day, a shocking 5–6% drop that broke its parabolic structure and sent fear rippling across markets.
What triggered it?
🏦 A hawkish shift in the Federal Reserve’s language as officials hinted rate cuts might be delayed.
💰 Real yields surged, breaking the inverse correlation that had fueled gold’s climb.
🏛️ Institutional profit-taking hit record levels, confirmed by rising COMEX open interest and volume.
🗞️ Sentiment flipped overnight as headlines shifted from “Gold to $5000” to “Gold crashes $250.”
The move marked the first true break of structure (CHoCH) since the rally began, historically the signal that smart money is quietly exiting.
🔍 4. Lessons from 1980 — The Signs of a Top
Before gold crashed in 1980, five clear warning signs appeared.
⚙️ 1979–1980 Signal 💡 2025 Equivalent 🧭 Status
Fed turns hawkish Powell signals “pause / higher for longer” ⚠️ Emerging
Rising bond yields vs. flat Gold Real yield divergence ✅ Confirmed
Parabolic candles Daily range above $100 ✅ Seen
Media frenzy “Gold to $5000” hype ✅ Seen
Margin hikes and record OI Record COMEX participation ⚠️ Rising
Four out of five signals are already flashing. History teaches that when everyone believes Gold can only rise, it’s often about to fall.
🧭 5. What Smart Traders Should Do Now
🟡 Phase 1 – Immediate Protection (Next 24 Hours)
If you’re long, secure 50–75% of gains and protect above $3,950.
If you’re short, trail stops to $4,200 and look for targets at $3,950 → $3,800 → $3,600.
If you’re flat, stay patient and wait for at least two daily candles of stabilization before acting.
🟠 Phase 2 – Stabilization (Next 3–5 Days)
Watch for:
🕯️ Long lower wicks on daily candles show buyer absorption.
📉 Shrinking COMEX volume indicates exhaustion of sellers.
📊 Flat or falling real yields confirming support.
🔵 Phase 3 – Re-evaluation (Next 1–2 Weeks)
If gold reclaims $4,000+ with strength and Fed tone softens, a controlled re-rally may begin. If Gold stays below $3,800, the correction likely extends toward $3,500, the same 30–40% retracement seen in 1980.
🧘♀️ 6. Beyond the Chart — Discipline Over Drama
When a $250 candle appears, instincts scream, “Do something!” But professionals know the truth: reaction destroys capital, observation preserves it. The coming days are not about prediction but about posture. Stay liquid, track sentiment, watch real yields, and remember that even in 1980, Gold’s crash didn’t end its story — it simply reset the cycle for the next era of accumulation.
✨ History doesn’t repeat, but it rhymes. In 1979, Gold taught us that fear creates bubbles. In 2025, it’s reminding us that even truth needs a pullback before it shines again.
If this article helped you today and brought you more clarity:
Drop a 🚀 and follow us✅ for more trading ideas and trading psychology. Thank you.

GOLD → Technical analysis of the current situation FX:XAUUSD is consolidating, and the daily market behavior pattern is not particularly positive, but it does have bullish implications. Market sentiment largely depends on the fundamental background
This week, the Fed is expected to hold a meeting on interest rates, where it will most likely decide to lower them, which could generally support the dollar (but this news is most likely already priced in). Accordingly, the rest depends on decisions regarding the shutdown, trade war, and inflation. The resolution of the first two issues may weaken the price.
As for the technical side, since the price is currently within the trading range, it is worth considering trading within these limits first. However, a breakout and closing above/below one of the key levels: 4060 - 4150 could trigger further movement in the direction of the breakout, which in turn could push the price into another (bearish or bullish) trading range. Below, there is the 4000 zone, and there is a possibility of a retest of this area, with a potentially aggressive reaction.
Resistance levels: 4150, 4218, 4275
Support levels: 4060, 4015, 3944
While uncertainty remains, the market may continue to hold the price between 4060 and 4150. Another retest of the range boundary and the reaction to this retest will show the market's intentions for further movement.
Best regards, R. Linda!

GOLD Finally Bearish , Short Setup Valid To Get 300 Pips !Here is My 30 Mins Gold Chart , and here is my opinion , we finally Below 4050.00 With 4H Candle And this never happened for a long time ! and we have a 4H Candle closure below it And Perfect Breakout and this give us a very good confirmation , so we have a good confirmation now to can sell after the price go back to retest the broken area 4050.00 , and give us a good wicks as previous wicks ! and we can targeting 100 to 200 pips . if we have a daily closure above this area this mean this idea will not be valid anymore .
Reasons To Enter :
1- Perfect Touch For The Area .
2- Clear Bearish Price Action .
3- Bigger T.F Giving Good Bearish P.A .
4- Over Bought .
5- Perfect 30 Mins Closure .

GOLD: Waiting For the Bulls To Join the PartyGOLD: Waiting For the Bulls To Join the Party
From our previous analysis, gold reached the same target twice. The bullish momentum is low, but it could increase over time.
The prevailing trend is evident, which is intact and remains bullish.
Today on the US economic calendar, the PCE data was expected to be reported.
Given that we have a data shortage due to the US government shutdown, this could raise questions again and could help gold to rise.
You may find more details in the chart!
Thank you and Good Luck!
❤️PS: Please support with a like or comment if you find this analysis useful for your trading day❤️
Previous analysis:

THE KOG REPORT - UpdateEnd of day update from us here at KOG:
Interesting open on the markets with gaps all over the place. Gold managed to break below on the open then continuing to complete not only the red box targets but our Algo target as well. We would have liked higher to get in on this move, ideally we wanted 4055 during the NY Session but it wasn't to be. The move commenced and those that got in managed to bag themselves a decent trade short.
For now, due to another stretch on buyers, we would like to see where we close today. We have circled the potential play with a swing high looking like it will attempt the 4030 level while the red box below will need to break in order to continue to our long awaited target below.
As always, trade safe.
KOG

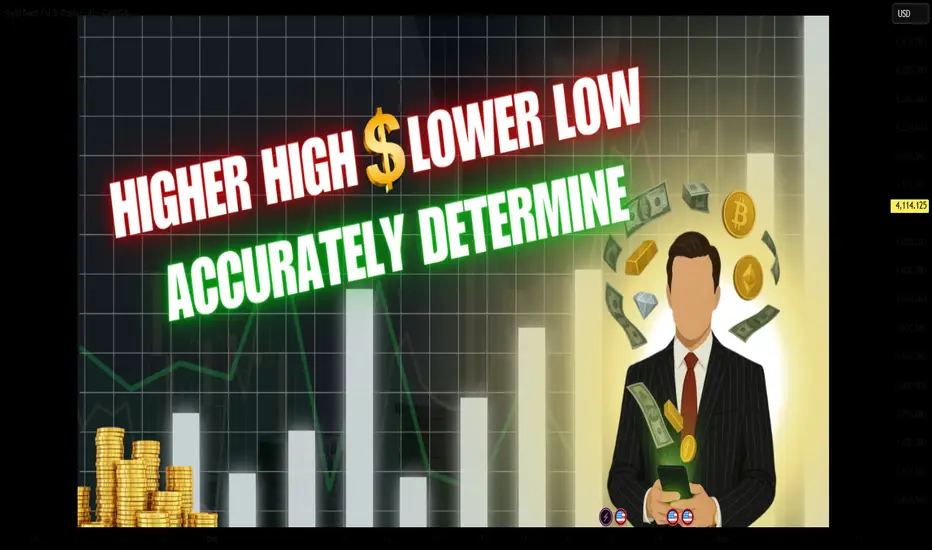
How to Identify Higher Highs and Lower Lows AccuratelyIn price action trading, identifying Higher Highs (HH) and Lower Lows (LL) may seem simple, but it’s actually one of the most essential foundations for reading market structure.
If you get it wrong, you’ll often end up trading against the trend without realizing it.
1. Understanding Higher Highs & Lower Lows
Higher High (HH): a new peak that’s higher than the previous one → indicates the uptrend is still intact.
Lower Low (LL): a new trough lower than the previous one → confirms the downtrend continues.
It sounds simple, but the tricky part lies in choosing the correct main swing to read from.
2. Common Mistakes That Mislead Traders
Many traders identify HH–LL patterns on very small timeframes, which causes confusion because of minor pullback waves inside the bigger trend.
Example:
The M5 chart might show HH–HL (uptrend), while the H1 chart is clearly forming LL–LH (downtrend).
If you buy based on the small timeframe, you’re essentially buying into a pullback.
💡 Pro tip: Always identify the main market structure on higher timeframes (H1–H4) before looking for entries on smaller ones.
3. How to Identify Them Accurately
Find the main swing:
Look for the points where price truly reverses with strong candles or noticeable volume.
Mark clear highs and lows using the swing high/swing low tool.
Check structural continuity:
If HH and HL remain intact → the trend is bullish.
If LL and LH keep forming → the trend is bearish.
If the structure breaks (for example, a HH forms in a downtrend) → the market may be shifting direction.
4. Practical Tips
Use the H4 timeframe to determine the overall trend.
Then, drop to M15 or M30 to locate precise HH/LL points for entry.
Avoid identifying HH/LL inside sideways (ranging) markets — it’ll only confuse your analysis.
Gold consolidating a new high zone pullback from support Gold is currently consolidating after a sharp reaction, with price action moving quickly and testing the new high zone. Technically, the price broke the 4,000 level but experienced a pullback from above this support area. The next directional move will likely depend on a breakout from the current consolidation range.
A clear break above resistance could trigger a move toward the next resistance zone at 4,165–4,200 a break below the range would suggest that gold remains neutral to bearish in the short term may test the support again rebound to upside.
You may find more details in the chart.
Trade wisely best of Luck buddies.
Ps; Support with like and comments for better analysis Thanks for Supporting.

Gold Declines as Sellers Dominate the MarketGold is undergoing a controlled correction phase after an extended period of sustained gains. Market behavior over recent sessions reflects a shift from expansion to contraction as liquidity flow decreases and momentum weakens across key time horizons.
The previous upward cycle attracted substantial speculative interest, but current market dynamics suggest profit-taking by institutional participants and reduced accumulation from large holders. The recent structural shift confirms that sentiment has turned defensive, aligning with global market caution amid evolving economic conditions.
Despite short-term consolidation, the broader setup indicates that gold remains sensitive to global financial stability concerns and policy signals. Market participants are now waiting for clarity on upcoming economic data and interest rate outlooks, which could determine whether the correction deepens or transitions into a new accumulation phase.
In the near term, volatility is expected to remain elevated as investors reassess exposure levels. The prevailing outlook maintains a cautious bias, with traders closely observing how price reacts to continued shifts in liquidity and macro sentiment. Sustained capital outflow from hedge assets could pressure gold further, while renewed demand for safety could limit downside potential in the medium term.

THE KOG REPORT - UpdateEnd of day update from us here at KOG:
Simple one this evening. Yesterday we wanted to see which way it broke, the red boxes activated, the short hit target, we then got the TAP AND BOUNCE, red box activated with the hot spot and Excalibur, and BOOM! RIP And FLIP.
Now, support below at the 3930 level with resistance 3955 could be the play but the close here is important! The pull back here is huge, all the way up to the level of 4050 which needs to break to change the structure, otherwise, more downside is on the horizon.
From Camelot this morning:
Red boxes:
Break above 3909 for 3920✅ and 3933✅ in extension of the move
Break below 3890 for 3865, 3955 and 3848 in extension of the move
As always, trade safe.
KOG

GOLD (XAUUSD): Support & Resistance Analysis For Next Week
Here is my latest support & resistance analysis for Gold.
Horizontal Structures
Resistance 1: 4186 - 4244 area
Resistance 2: 4358 - 4381 area
Support 1: 4040 - 4060 area
Support 2: 3942 - 3959 area
Support 3: 3870 - 3897 area
Support 4: 3766 - 3831 area
Support 5: 3691 - 3735 area
Vertical Structures
Vertical Support 1: Rising trend line
Consider these structures for pullback/breakout trading next week.
❤️Please, support my work with like, thank you!❤️
I am part of Trade Nation's Influencer program and receive a monthly fee for using their TradingView charts in my analysis.

Gold resumes upward trend after testing 3900📣Gold resumes upward trend after testing 3900
From my update yesterday, gold is clearly rising. The market is positioned for a rate cut by the FED today.
The FED is expected to cut rates by 25 bps to 4% vs 4.25 previous.
Whether this is good or bad for gold is another topic, as gold moves as it wants dominated by a strong bullish trend.
However, our area near 3900 stopped the price, indicating that who created the bearish movement was taking some profits and may be is back in the game to make more profits.
I think Gold can go higher today, despite the big mess that FOMC could create today.
You may find more details in the chart!
Thank you and Good Luck!
❤️PS: Please support with a like or comment if you find this analysis useful for your trading day❤️

Gold (XAU/USD) – Testing key support zone near 4,020 USDGold (XAU/USD) – Testing key support zone near 4,020 USD, potential short-term rebound
On the 15-minute chart, Gold (XAU/USD) continues to show weakness after failing to hold above the 4,080 USD resistance. Price action has formed a clear lower-high structure, indicating sellers remain in control.
Currently, gold is testing the horizontal support area around 4,010 – 4,020 USD, which previously acted as a strong demand zone. The market is consolidating in this region, suggesting that a short-term reaction or pullback could occur before the next major move.
Technical Outlook
Resistance: 4,080 – 4,090 USD
Support: 4,010 – 4,000 USD
Market Structure: Lower-High / Lower-Low (bearish bias)
EMA50: Slope remains downward, confirming short-term bearish momentum
RSI: Near oversold territory on lower timeframes, indicating possible rebound pressure
Despite the downward trend, the proximity to the 4,010 USD support zone increases the likelihood of a technical bounce toward 4,080 USD before any continuation lower.
Trading Plan Suggestion
Buy (counter-trend scalp):
Entry: 4,030 – 4,035 USD
Stop Loss: 4,010 USD
Take Profit: 4,080 USD
Sell (trend continuation):
Entry: 4,083 – 4,090 USD (after rejection)
Stop Loss: 4,110 USD
Take Profit: 4,020 – 4,000 USD
Summary
Gold remains in a short-term downtrend, but buyers may attempt to defend the 4,010 USD level. A strong bullish reaction from this zone could trigger a temporary pullback, whereas a breakdown below 4,000 USD would confirm further weakness toward 3,950 USD.
Keep this setup on your watchlist — follow to receive daily price action updates and intraday trading strategies.

GOLD (XAU/USD): Important Bearish Breakout📉GOLD has a high potential to continue falling
after a breakout of a key daily/intraday horizontal support.
Next supports: 3900

XAUUSD next week (October 27, 2025 - October 31, 2025)After yesterday's CPI news on 24/10/2025, we saw interest rates unfavorable for the USD. This makes gold continue its upward trend in the coming time. Targets are 4380-4475 respectively.

XAUUSD: Bulls vs. Resistance — 4050 Decides the Next MoveIn yesterday’s analysis, I mentioned that after the reversal from the 3920 support zone, Gold (XAUUSD) could continue higher toward the 4050 resistance area.
Indeed, that target has been reached, followed by a 600-pip leg down overnight.
At the moment, the price is resuming its upward move and is trading back above $4,000, around 4025.
Going forward, I expect volatility to remain high. If the bulls fail to sustain the price above 4050, another leg to the downside could follow.
For now, I’m out of the market, waiting to see whether we’ll get another test of 4050 — and more importantly, how the price reacts in that zone. 🚀

XAUUSD: Bullish Reversal Setup From Triangle SupportHello everyone, here is my breakdown of the current Gold setup.
Market Analysis
Gold (XAUUSD) continues to trade within a larger bullish market structure, maintaining higher lows above its key ascending Trend Line. After a strong impulsive rally that pushed the price above the 4,200 resistance, the market faced rejection near the top of the Range and entered a corrective phase. This correction evolved into a triangle pattern, with price now testing the Triangle Support Line, aligning closely with the horizontal Support area around 4,020 – 4,000 — a historically important demand zone.
Currently, the price is consolidating near the lower boundary of this structure, showing early signs of stabilization. This region also coincides with the previous breakout point, adding further confluence for potential buyer interest.
My Scenario & Strategy
I expect the price to hold above the Triangle Support Line and form a bullish reversal structure, signaling that buyers are once again defending this level. A confirmed breakout above the Triangle Resistance Line would indicate renewed bullish momentum and a potential continuation of the overall uptrend.
My primary target zone lies around 4,215, where previous resistance and the upper range boundary converge. However, if the support near 4,000 fails to hold, it could trigger a deeper correction toward 3,950, where the next demand zone is located. This setup offers a favorable risk-to-reward opportunity for traders anticipating a rebound from a major technical confluence zone.
That's the setup I'm tracking. Thank you for your attention, and always manage your risk.
