GOLD TO 4150 📈 CHART MARKUP:
ANALYSIS:
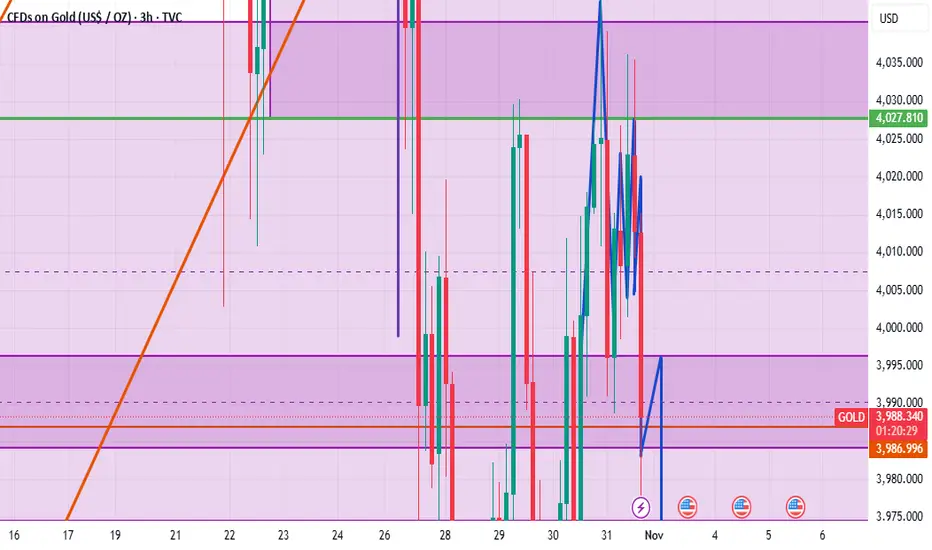
Price has been accumulating after that strong downside push into a previous demand zone. Liquidity has already been cleared from both sides which gives room for a clean move higher. The structure is showing early signs of strength with consistent rejections from the same range and a potential shift in orderflow building up around 3950.
This is where smart money starts scaling into positions quietly before the crowd catches on. My focus is on price maintaining above the purple demand area and giving that clean momentum candle out of the range to confirm strength.
If that happens, we could see a clean sweep toward 4015 and possibly extend to 4150 if momentum holds into mid week.
💼 TRADE IDEA:
Entry Zone → 3953 to 3960
Stop Loss → 3940
Take Profit 1 → 3975
Take Profit 2 → 4015
Take Profit 3 → 4150
⚖️ Note:
Use proper risk management. The setup is valid for the next 7 days or until the structure shifts. Let the market come to you and don’t chase candles.
🔥 The move is simple: react, don’t predict. Institutions already built their positions. Now it’s our turn to follow the flow and capitalize with precision.
Trade ideas

Gold ranging between 3900-4050gold is currently ranging between this key levels
making the current market as a sideways for this period.
However the current bearish is still in pressure that the power seem lowering thou.
so plans is buy at support and sell only at resistance.


Gold vs SPX Head and ShouldersDoes anyone else see a MASSIVE H&S in this chart?
It seems insane to think this could ever hit the measured move ($44).
Regardless, if this breaks above the descending line.. GET INTO GOLD!

XAU/USD - Setup Analysis / Bullish ReversalPrice has recently swept the Previous Day’s Low (PDL), a key swing point often associated with potential reversal zones.
However, the current structure suggests that price may continue its liquidity run, targeting the Previous Week’s Low (PWL) and the unfilled weekly Fair Value Gap (FVG) positioned just below.
Upon completion of this liquidity sweep and mitigation of the weekly imbalance, a reversal is anticipated.
The projected draw on liquidity aligns with the unfilled H1 order block on the buy-side, in confluence with an engineered liquidity pool formed around the Previous Day’s High (PDH) and the London Session high.

Gold (XAUUSD) Pullback Analysis: Testing OB Before TargetsA potential trading setup based on concepts from Smart Money Concepts (SMC) or similar institutional methodologies.
Asset and Timeframe: XAU/USD (Gold Spot / US Dollar) on a 1-Hour (1H) timeframe.
Current Price: The price is hovering around $3,983.55.
Market Structure:
There's a recent Break of Structure (BOS), suggesting an upward bias or a shift in momentum to the bullish side.
The price is currently pulling back into a key zone.
Key Zones/Concepts:
OB (Order Block): The shaded gray area is identified as an Order Block. This is a zone where significant institutional buying/selling previously occurred, and the price is expected to react to it.
$$$ (Liquidity/Equal Lows): The three dollar signs indicate an area of liquidity or equal lows below the current price action. These are often targeted for a stop-hunt or liquidity grab before a significant move.
1H / BPR (Balance Price Range): The lower green box is labeled as a 1H / BPR. A Balance Price Range is a more refined area of support/demand, suggesting an even stronger reaction zone if the initial OB fails.
Projected Trade Scenarios: The dotted lines outline two primary possibilities:
Bullish Scenario (Solid Line): A bounce from the OB (Order Block) to hit Target 1 ($4,030.00).
Bearish/Liquidity Grab Scenario (Dotted Line): A drop below the OB to sweep the $$$ (Liquidity), potentially testing the 1H / BPR before a sharp reversal back up to Target 1 or even Target 2 ($4,050.00).

Gold market opens with a corrective move to take out imbalance Gold market opens with a corrective move to take out imbalance through the 3960’s, setting the stage for a potential bullish recovery. Price projection points toward 4023, where momentum may determine the next directional bias.
follow for more insights for gold market , comment and boost idea

GOLD USDHI GUYS
The video above illustrates on how i grab sniper entries on Gold,
We i identify a combination of price patterns and trade sessions on candle close ,be it buy or sell the price patterns are always there.

XAU/USDGold had slow volatility on Monday this analysis is anticipating gold to be short. The respected resistance zone on Gold in 1 hour timeframe is 4056.08 & 4030.56 these levels should be also your entry level for short term sell.
XAU/USD SELL @ 4030.56
TAKE PROFIT @ 3885.97
STOPLOSS @ 4129.56
TIMEFRAME 1 HOUR

Latest gold analysis and trading strategies:
I. Core View
Trend Judgment: Gold is expected to show oscillatory and back-and-forth movements next week, generally biased towards rushing higher then pulling back. Momentum is limited after the strong rise, with significant overhead pressure, warranting vigilance against correction risks.
Key Drivers:
Bullish Factors: The Fed's rate cut has enhanced gold's appeal.
Bearish/Uncertainty Factors: Fed Chair Powell's hawkish signals, suggesting a December rate cut is not guaranteed, are capping the upside potential for gold prices. Market分歧 between bulls and bears is intensifying.
II. Technical Analysis Essentials
Current Pattern: A "bullish engulfing" candlestick formed on the daily chart, but the failure to maintain strength on Friday indicates weakening bullish momentum.
Key Levels:
Strong Resistance Zone: 4030 - 4060 area. A break above could lead to a further test of the 4080 - 4090 area, which represents trendline resistance and is an ideal level to consider short positions.
Core Support Zone: 3970 - 3960 area. A break below this zone targets the 3940 - 3950 area.
Medium-Term Pivot Point: 3915 - 3920 area. A decisive break below this zone would confirm a bearish trend, opening the door for a larger decline towards 3885 - 3890.
III. Trading Strategy Recommendations
Primary Approach: Focus on selling high (going short) on rallies.
Short Strategy (Primary):
Entry Zone: Look to initiate short positions in batches within the 4030 - 4060 range during price advances.
Ideal Shorting Level: If the price rallies to the 4080 - 4090 zone, it presents a better risk-reward opportunity for short entries.
Target: Aim for 3970 - 3960, and hold towards 3940 if broken.
Stop Loss: Place above key resistance levels (e.g., above 4060 or 4090).
Long Strategy (Secondary):
Entry Zone: Consider light long positions near the 3970 - 3960 support area to capture a bounce.
More Robust Long Level: A pullback to the 3940 - 3950 zone can be viewed as a safer opportunity for short-term long trades.
Target: Look towards 4010 - 4030.
Stop Loss: Place below key support levels (e.g., below 3950).
IV. Risk Warning
Closely monitor subsequent speeches from Fed officials and US economic data. Any clear signals regarding the interest rate path could trigger significant market volatility.
If gold breaks strongly above 4090 and sustains, a reassessment of the short strategy is necessary, as it could indicate renewed upward momentum.
If gold directly breaks below the key 3915 - 3920 support, follow the bearish trend.
Summary: Exercise caution in gold trading next week, avoid chasing rallies or selling panics. The preferred strategy is to look for shorting opportunities when prices rebound to key resistance levels, trade swiftly, and strictly use stop losses to control risk.

GOLD: Will Go Down! Short!
My dear friends,
Today we will analyse GOLD together☺️
The in-trend continuation seems likely as the current long-term trend appears to be strong, and price is holding below a key level of 4,016.56 So a bearish continuation seems plausible, targeting the next low. We should enter on confirmation, and place a stop-loss beyond the recent swing level.
❤️Sending you lots of Love and Hugs❤️

Gold Trade Set Up Nov 3 2025Price is making HL/HH on the 1h and is now testing 15m Supply so i will only be looking for buys if price continues to make a HH but if price can respect this supply and make bearish internal structure on the 5m-15m i will look for sells down towards SSL

GOLD - SELL - 200$ downsideAs per time cycles, Gold opened gap down on previous Monday and breaking the wedge it went down 200$ in 8 bars. Similarly today gold opened gap down on Monday and expecting it to go down 200$ in 8 bars. Therefore going Short on gold

Gold’s Pullback Is a Trap for the UnpreparedGold is not collapsing. It is consolidating after a historic surge, and the evidence across timeframes shows this dip is a high probability buying opportunity. Traders focused only on the short term are missing the bigger picture because the monthly and weekly charts reveal a powerful bull trend still intact.
The monthly timeframe tells the dominant story. Gold closed October at 3858.45, near its all time high of 4381.44, with the 1M RSI 7 at 95.44 and 1M ADX 14 at 63.15—confirming an extremely strong uptrend. The MACD histogram remains positive at 81.78, and price is trading well above all major monthly moving averages, including the 1M SMA 200 at 1592.71. This is not a market ready to reverse. It is a market pausing to digest gains before its next leg up.
On the weekly chart, the structure remains bullish. Price pulled back from 4381.44 to test the 3886.47 low, which aligns with the 1W SMA 10 at 3776.44 and the lower Bollinger Band at 2991.35—still far below current levels. The weekly ADX 14 is 53.91, signaling a strong trend, and the MACD histogram is still positive at 59.92. Even though the weekly RSI is overbought, that is normal in strong bull markets and does not signal an imminent reversal.
Now look at the daily chart. Price is at 4002.81, below the 1D SMA 10 (4096.48) and 1D SMA 20 (4080.89), creating short term bearish pressure. The daily MACD histogram is negative at –41.99, and RSI 14 is neutral at 52.48, suggesting temporary weakness. But crucially, price is holding above the daily pivot at 3989.09 and the 1D SMA 50 at 3808.41—a major support zone. The 3950.95 S1 pivot and 3877.38 S2 level offer clear downside buffers.
The 4 hour chart shows early signs of stabilization. Price is trading above the 4H SMA 20 (3982.52) and the MACD histogram has turned positive at 8.49, hinting at short term momentum building to the upside.
Short term, gold could test 3950 over the next 5 to 10 days as bears push for a deeper retracement. But the higher probability outcome is a bounce from this zone toward 4100, supported by 4H momentum and daily support alignment.
Medium term, within 4 to 8 weeks, gold is likely to reclaim 4250 and challenge the all time high near 4380. This aligns with the upper weekly Bollinger Band at 4140.24 expanding upward and sustained volume on up weeks.
Long term, by the end of Q1 2026, gold is positioned to reach 4700, based on the monthly R3 pivot at 4442.75 and the continuation of the primary bull trend confirmed by monthly ADX and MACD strength.
This pullback is not weakness. It is the market separating disciplined trend followers from emotional sellers. The technicals across timeframes confirm one truth: gold’s bull run is far from over.

GOLD READY TO BUYPROJECTION (BULLISH)📈📉👀🗞️
1. Fill out the IMB @ discount zone.
2. A sweep of EQL
3. A sweep of of SSL
4. A bullish BOS above IDM
5. A sweep of EQH
6. Fill out the IMB @ Premium zone
7. Asweep of BSL

Buy Alert #1:Buy Gold Now Before You Miss This OpportunitySo i sat in this restaurant very quiet and
i was not alone. Along side
some beautiful
waitress
but she was rude to all customers
she had the script down to a memory
saying,
"The price total is..."
She mentions the exact same total almost
like she knew what
the guys would order.
"I want a shawama...and.."
"How much is the drink?"
"Okay give me water", i said.
I reduced my total order to cost
by 20% just by
ordering water instead of the soft drink
which included
the common price she kept
giving other customers.
I felt like i won the price war.
Water and shawama
The best combination.
I looked at my smart phone screen.
Checking the price of Gold.
Then it hit me...
"GOLD!!"
I have to buy gold.
The economy is going to shambles...you need to prepare
this next global crisis is going to be
massive.
Make sure you stick to your
strategy
As for me its Buying Gold
I have been buying gold for a while
on the simulation trading account
for practise...and now is
the time
i think i have mastered how to buy Gold.
Using the rocket booster
strategy
What is the rocket booster strategy? :
1-The price should be above the 50 EMA
2-The price should be above the 200 EMA
3-The price should gap up
You will see this gap up in momentum
using the RSI indicator below this price action
pattern
Trade safe.
Rocket boost this content to learn more.
Disclaimer: Trading is risky
please learn about risk management and profit taking strategies,.
Also feel free to use a simulation trading account
before you trade with real money.

Next week's trading strategy and analysisPolicy aspect: The loose tone of the Federal Reserve remains unchanged, and the liquidity dividend continues to be released.
The expectation for interest rate cuts remains flexible: The Federal Reserve cut interest rates by 25 basis points to 3.75%-4.00% as scheduled in October. Although Powell stated that an interest rate cut in December is "not inevitable", the CME FedWatch tool shows that the probability of a 25 basis point cut in December still reaches 67.8%, which is a decrease from 95.3% before Powell's speech, but the general direction of easing has not reversed. It is worth noting that the internal hawkish and dovish differences within the Federal Reserve have intensified (Milan advocates a 50 basis point cut, Schmid opposes a cut), and the meeting minutes of November may reveal more clues on easing, providing expected support for gold prices.
The termination of balance sheet reduction is a definite positive factor: The Federal Reserve clearly stated that it would end the reduction of the balance sheet on December 1 and fully reinvest the maturing bonds, releasing approximately 60 billion US dollars of liquidity to the market each month, equivalent to "implicit QE", directly reducing the holding cost of gold, and this policy dividend has not been fully priced.
There is room for economic data disturbances: The US government shutdown has led to the postponement of the release of several key data. Market judgments on the economic fundamentals are divided. If the ISM manufacturing PMI, non-farm payrolls, etc. data in the next week are not up to expectations (current expectations are PMI 49.2, non-farm payroll increase 170,000), it will further strengthen the expectation of easing.
Next week's trading strategy and analysis
buy:4000-4010
tp:4025-4035-4100
sl:3995

XAUUSD – Corrective phase in progressGold is currently moving within a corrective phase, which appears to be developing as a WXY structure.
Price is now completing wave X, with one final minor wave C to the upside likely remaining.
The more probable scenario suggests a limited bullish move toward the 4140–4180 zone before continuing lower as part of wave Y.
Bullish trigger: 4046 (for the final leg of wave C)
Bearish alternative: A confirmed breakdown and consolidation below 3960 would invalidate the current count and shift focus to a continuation of the broader bearish move — in that case, the wave structure will be updated accordingly.

GOLD Short-Term Pullback 🔹 COT (Commitment of Traders)
(Last update: September 23, 2025 – data not refreshed due to the CFTC shutdown)
Gold (COMEX)
Non-commercial longs: 332,808 (+6,030)
Non-commercial shorts: 66,059 (+5,691)
→ The latest available data (outdated) showed an increase in both positions, with a stronger rise on the long side — indicating institutional accumulation in late September ahead of the October rally.
Although outdated, the COT report still reflects a mildly bullish structure, but no longer captures the current market dynamics after recent volatility.
🔹 FX Sentiment (Retail Positioning)
58% long / 42% short
📌 Retail traders remain moderately long on gold. This supports a short-term contrarian bearish bias, aligning with the ongoing corrective move in price.
🔹 Seasonality
Historically, October and November tend to be statistically bullish months for gold, with average gains between +2% and +4% over 10–20-year periods.
📌 Seasonal conclusion: the context remains bullish on a seasonal basis, with potential for recovery once the current correction stabilizes.
🔹 Price Action
After the strong bullish impulse that pushed XAU/USD into the 4,350–4,400 area, price entered a phase of consolidation/distribution.
Current structure shows:
Key resistance: 4,250–4,300
Main demand zone: 3,950–3,900
RSI remains neutral but continues to lose momentum, consistent with a possible minor bearish leg before a new bullish wave.
🎯 Main Scenario:
Expecting a continuation of the corrective phase toward 3,950–3,900, aligning with the daily demand area and a likely institutional reaccumulation zone.
From there, a potential bullish resumption could emerge within November’s seasonal strength.
⚙️ Invalidation: daily close below 3,850, which would compromise the medium-term bullish structure.

XAUUSD 🎯 My Summary & View For Yellow metal
Bias: Bullish, provided support holds.
Strategy Suggestion:
Consider long entries on retests of support zones or after a confirmed breakout above resistance.
Place stop-losses just below the confirmed support to protect against sudden turnarounds.
Set profit targets at the next logical resistance / structure zone.
Watch-outs:
If price breaks below key support and closes there, the bullish thesis weakens.
Overbought conditions / exhaustion of momentum could lead to consolidation or a shallow correction even while trend remains up.
Keep an eye on macro events (Fed decisions, USD strength, geopolitical flare-ups) since gold is sensitive to those
⚠️ Risk Disclaimer
Trading financial instruments such as gold (XAUUSD), forex, cryptocurrencies, and other markets involves a high level of risk and may not be suitable for all investors. The information and setups provided are for educational and informational purposes only and do not constitute financial advice or investment recommendations.
Past performance is not indicative of future results. Market conditions can change rapidly, and there is always the potential for loss of capital. You should carefully consider your financial situation, trading experience, and risk tolerance before making any trading decisions.
Always use proper risk management, including setting stop-loss levels and managing position size. The author of this content is not responsible for any losses incurred from following analyses, trade ideas, or setups shared here.
By engaging in trading activities, you acknowledge and accept all risks associated with financial markets.

EXPECTATION FOR COMING WEEKS This sell today clears the way for a major sell from monday going to somewhere around 3860 before the rate and CPI buy start from there with momentum and incase the buy fail then that will lead to another long term sell , i will update anyway, no matter what happens.
GOLG BULLISH BREAKOUT SETUP TARGETING 4030 AFTER STRUCTURAL SHIFEntry Point: Around 3,994 – 4,000 USD — where price retested the demand zone after BOS.
Stop Loss: Below 3,978 USD, just under the last higher low to protect from fakeouts.
Target Zone 1: Around 4,011 USD — short-term resistance and first liquidity area.
Target Zone 2: Around 4,034 USD — strong supply zone and next liquidity pool (EQH zone).
Smart Money Concept (SMC) Insights:
Liquidity Sweep: The chart shows that equal lows (EQL) were swept before bullish structure formed — a common SMC pattern indicating accumulation.
Fair Value Gap (FVG): Price may fill a small imbalance before continuing higher.
Strong High Zone: Around 4,034, which could act as the final liquidity target before a potential pullback.
Trade Idea:
Setup: Bullish continuation after market structure shift.
Risk/Reward: Approximately 1:3 R/R ratio.
Bias: Bullish as long as price holds above 3,978 – 3,980 zone.

SELL SETUP – Gold (XAU/USD) – Smart Money + FundamentalsTechnical Analysis:
Price has created a lower-high structure after rejecting the major supply zone (4110–4135). The market recently tapped into a mitigation zone (4080–4090) — a previous support turned resistance (RBS) — and showed rejection signs. Liquidity above that area has been cleared, indicating distribution before the next impulsive bearish move.
Targeting liquidity resting below 3976, where a demand imbalance sits waiting to be filled. Structure remains bearish unless price breaks above 4110.
Trade Plan:
Entry: 4085–4090
Stop Loss: 4110
Take Profit: 3976
Risk–Reward: ≈ 1:3
Fundamental Analysis:
Gold continues to face bearish pressure as the U.S. Dollar Index (DXY) strengthens amid hawkish Fed expectations and recent positive U.S. economic data.
Interest rates: Market anticipates rates to stay elevated longer, reducing gold’s appeal as a non-yielding asset.
Geopolitical tone: With current global tensions stable and no major escalation, safe-haven demand remains limited.
Bond yields: Rising U.S. Treasury yields further support USD strength, adding weight to short-term downside in gold.
Concept:
This setup aligns Smart Money Concepts (SMC) with macroeconomic sentiment, anticipating institutional selling continuation toward lower liquidity pools.
